


Chainlink has been one of the best performers in the cryptocurrency industry since the beginning of September. However, it possibly reached a top on November 14 and has been decreasing since — losing 18 percent of its value.
Even though Chainlink has been announcing a string of positive news, with numerous providers launching Chainlink Nodes, the market has not responded positively at all. To the contrary, the LINK price has been gradually decreasing.
Full-time trader @traderescobar stated that the ChainLink price outlook looks bearish — predicting a continued decrease that spills over until next year.
Has the LINK price reached a top? If it breaks down, where will it find support? Continue reading below if you are interested in finding out.
Market Cycles
The LINK price has made several higher lows since December 2017. Every time it has made one, the rate of increase in the ensuing upward move has intensified — creating a steeper ascending support line each time.
However, once it reached highs above 34,000 satoshis, the LINK price created long upper wicks — a sign that indicates selling pressure.
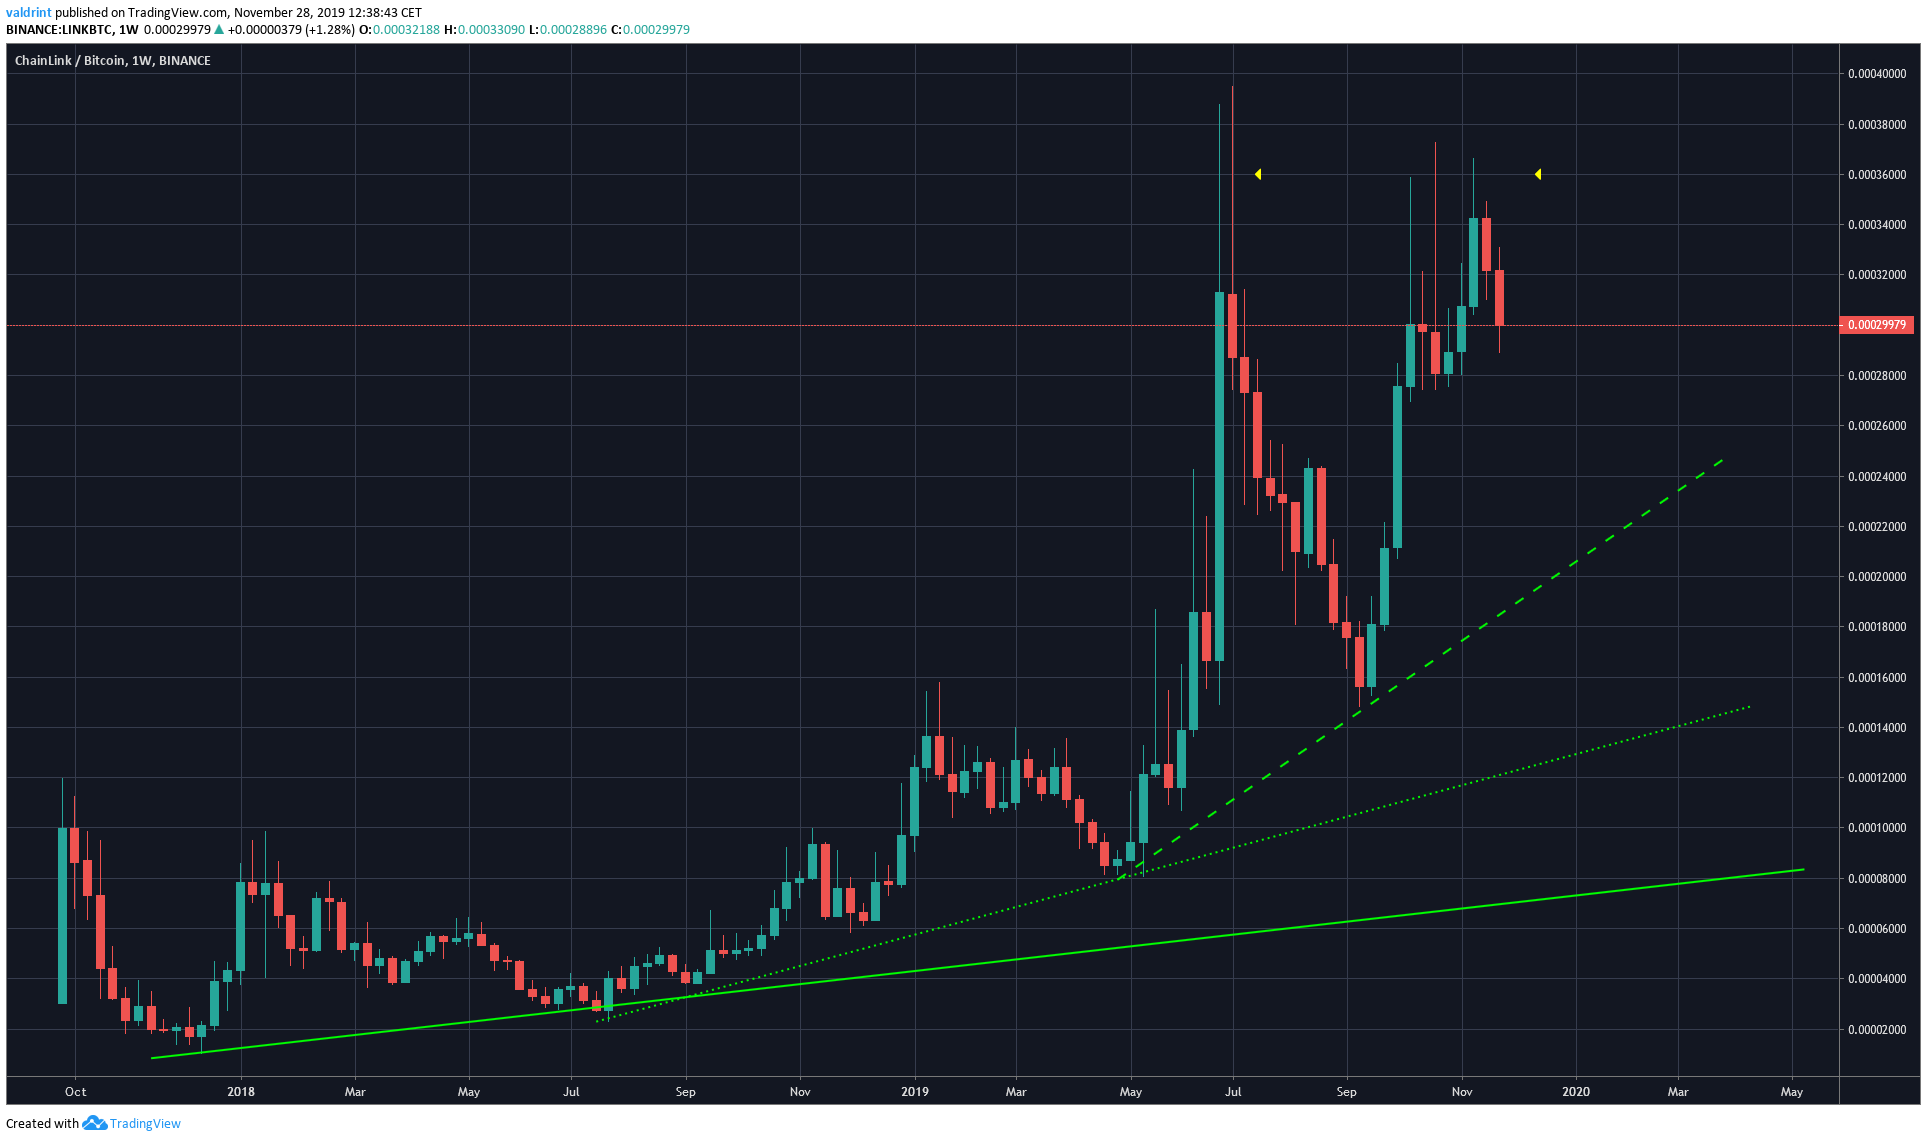
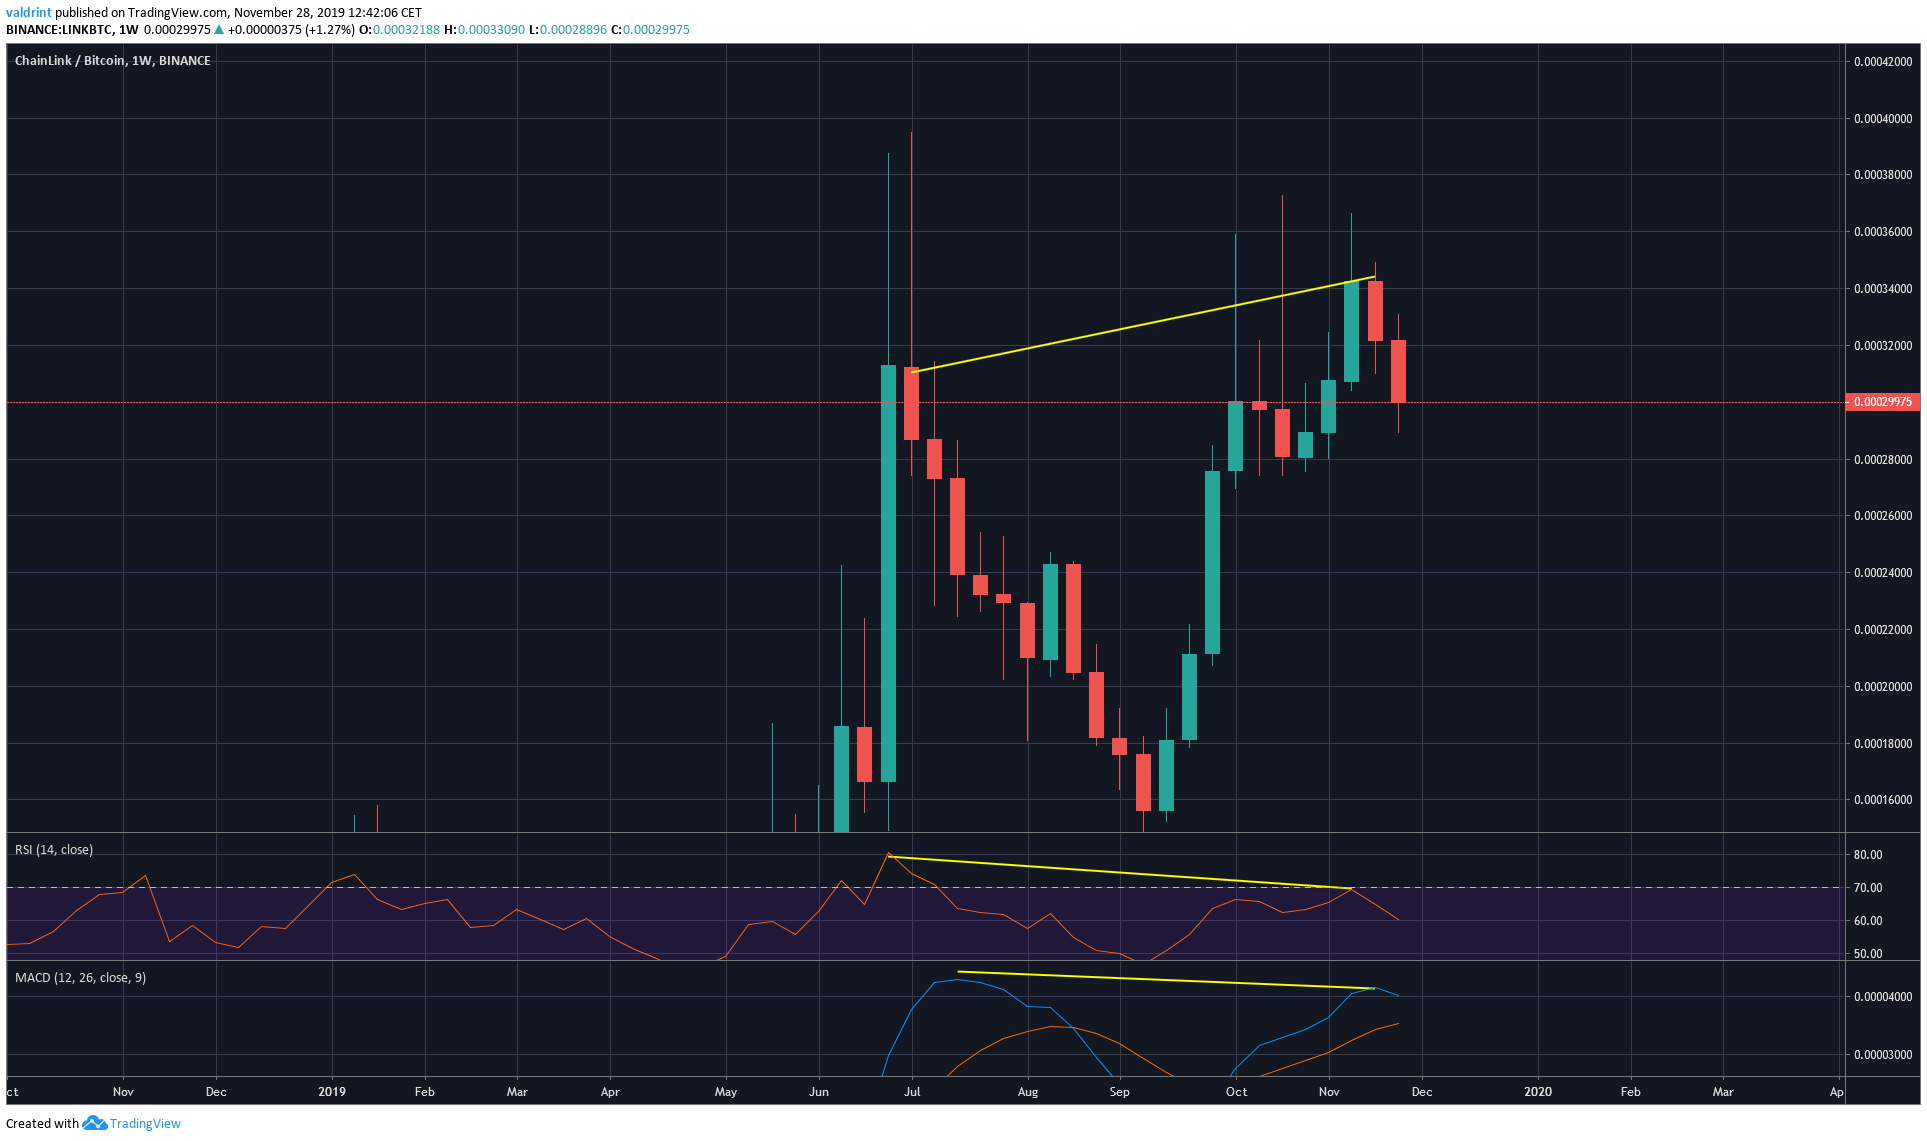
Furthermore, momentum indicators such as the RSI and MACD show a pronounced bearish divergence — which is present in the weekly time-frame. This suggests that the current upward move has lost its power and a retracement is likely. Since the ever-accelerating rate of increase is realistically unsustainable, this is not entirely surprising.
Previously, we have used the Wyckoff distribution method to predict the current price decrease.
Trading Range
Chainlink has been trading in a range between 28,000 and 36,000 satoshis since June. While the entire upward movement was preceded by a bullish cross between the 100- and 200-period moving averages (MA), the opposite is close to occurring — since we almost have a bearish cross, solidifying the possibility that the upward move might have ended.
A breakdown of the full height of the pattern would take us to 20,000 satoshis.
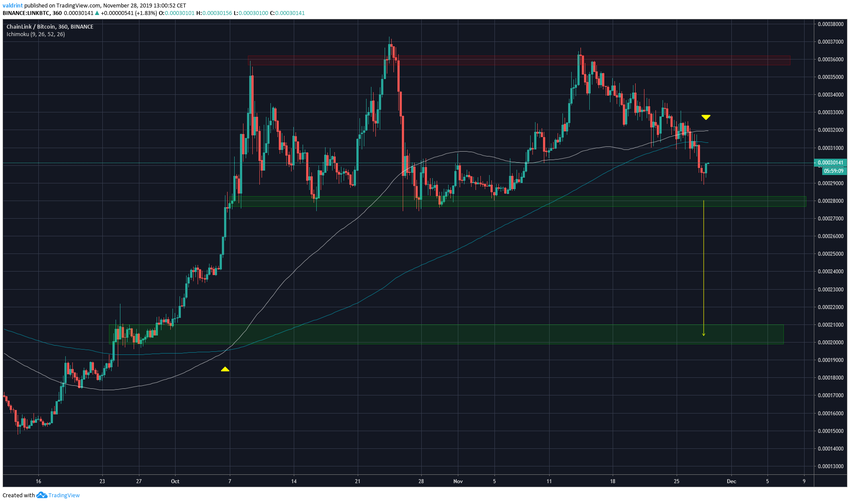
However, a full retracement should be considered a lower limit, since the LINK price will not necessarily retrace all the way.
A more common retracement would be to 23,500 satoshis, which is found at the convergence of both the 0.618 Fib level and 200-day MA.
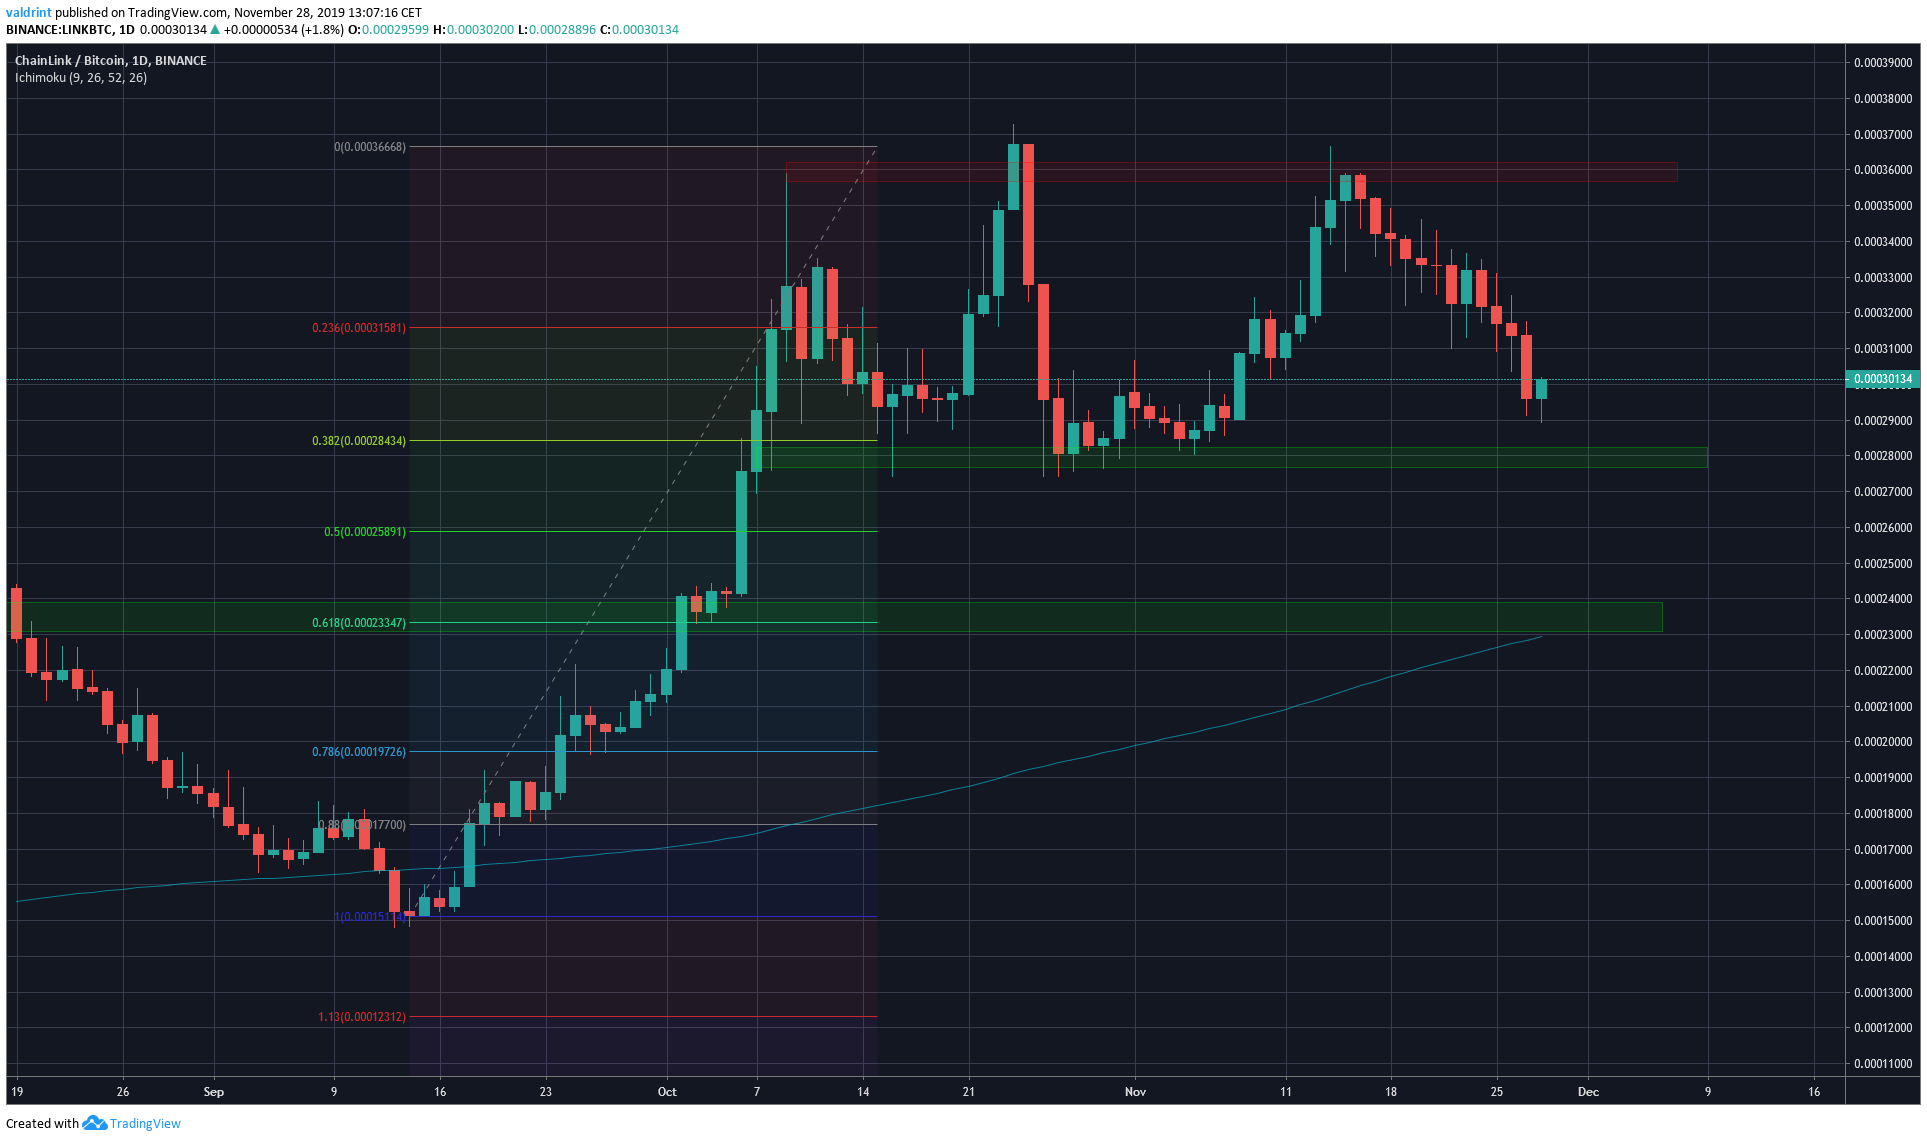
To conclude, LINK looks to have finished its market cycle for the medium-term. We expect a retracement towards the mid 20,000s satoshi support area.
Disclaimer: This article is not trading advice and should not be construed as such. Always consult a trained financial professional before investing in cryptocurrencies, as the market is particularly volatile.
