


Despite positive news and recent highs, the Chainlink price movement has been bearish.
Chainlink announced on November 13 that it had launched its community advocate program. The program continuously searches for advocates who will add value to the product by engaging in events in order to increase referral leads, sale references and contribute to higher customer value.
Chainlink previously announced its new node — the prophet node — which will give real-world data to the ecosystem of the project.
We're excited to welcome @prophet_node as the newest node operator to further decentralize the Chainlink network. They're backed by a team of blockchain enthusiasts and early adopters with a wealth of blockchain infrastructure experience. https://t.co/m8zUmat6A8
— Chainlink (@chainlink) November 5, 2019
Positive news aside, there are several possible patterns in play for Chainlink — which all suggest further price decreases.
Cryptocurrency trader @pentoshiswallet stated that the LINK price is following a Wyckoff distribution method and has reached a top.
https://twitter.com/Pentoshiswallet/status/1196326984734969856?s=09
According to the chart, the Chainlink price is currently in Phase D before a massive price decrease begins. Let’s take a closer look at the LINK price movement and examine what may happen next.
Chainlink and a Possible Wyckoff
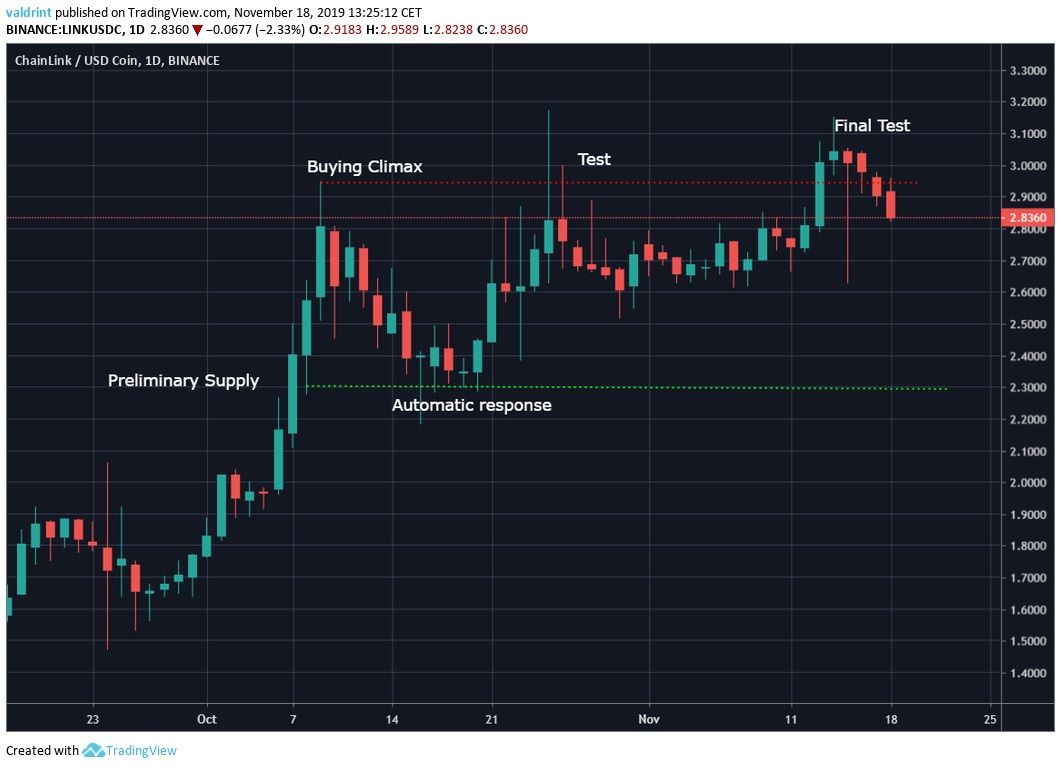
In order to use the Wyckoff chart, several stages are outlined in the graph below.
The rally was initiated at the beginning of October when the Chainlink price increased from $1.5 to $3. This was the “Preliminary Supply” stage. After the “buying climax” was reached, the Chainlink price decreased in a retracement which was the “Automatic Response.” The slightly higher high on October 25 was the “Test” and the even higher high on November 14 was the “Final Test.”
The Chainlink price has been decreasing since. The next phases predict an intensified downward move.
Other Possibly Bearish Patterns
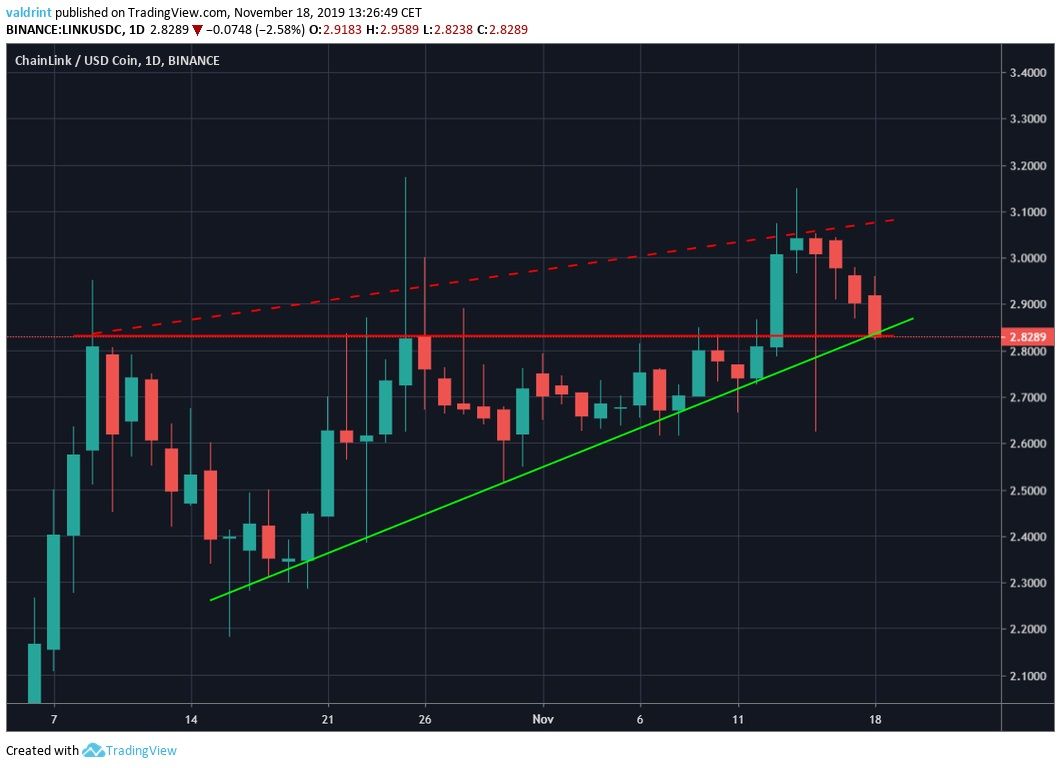
Even if we do not use a Wyckoff distribution, there are two possible patterns developing for Chainlink.
- The LINK price broke out from an ascending triangle. The breakout could not be sustained and the price is in the process of decreasing to pre-breakout levels.
- The LINK price is trading inside an ascending wedge. After reaching the resistance line, it began to decrease and is currently in the process of breaking down from the support line.
Both of these movements should be considered bearish.
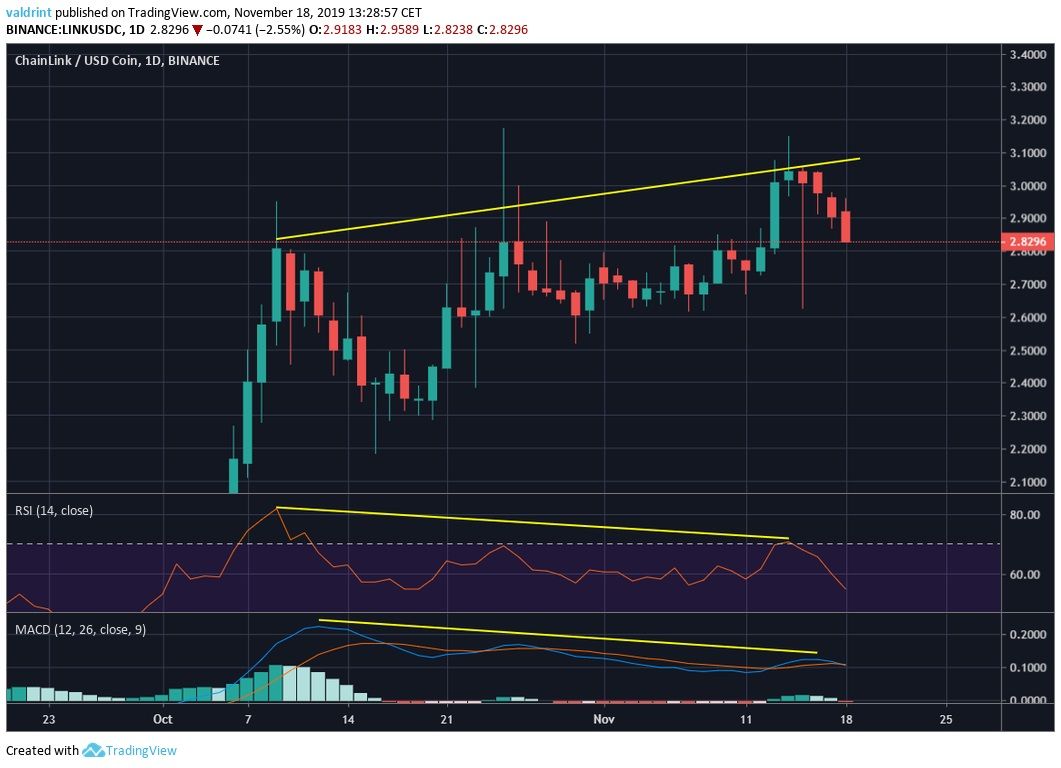
Finally, these higher highs have all been combined with a bearish divergence in both the RSI & MACD. This validates our hypotheses laid out previously which suggests price decreases. Therefore, the LINK price movement looks bearish — regardless of the method used to do the analysis.
Disclaimer: This article is not trading advice and should not be construed as such. Always consult a trained financial professional before investing in cryptocurrencies, as the market is particularly volatile.
Did you know you can trade sign-up to trade Bitcoin and many leading altcoins with a multiplier of up to 100x on a safe and secure exchange with the lowest fees — with only an email address? Well, now you do! Click here to get started on StormGain!


