


The Cardano (ADA) price has fallen since reaching a new yearly high of $0.68 on December 14.
The decrease ended a streak of eight successive weekly bullish candlesticks. Should bulls be worried?
Cardano Increase Leads to New Yearly High
The technical analysis from the weekly time frame shows that the ADA price has increased swiftly since October (green icon).
During the increase, the price broke out from a long-term horizontal resistance area, which had been in place for 420 days. This led to a new ADA yearly high of $0.68 on December 14.
However, the price created a bearish candlestick last week, characterized by a long upper wick (red icon). The ADA price has fallen slightly since.
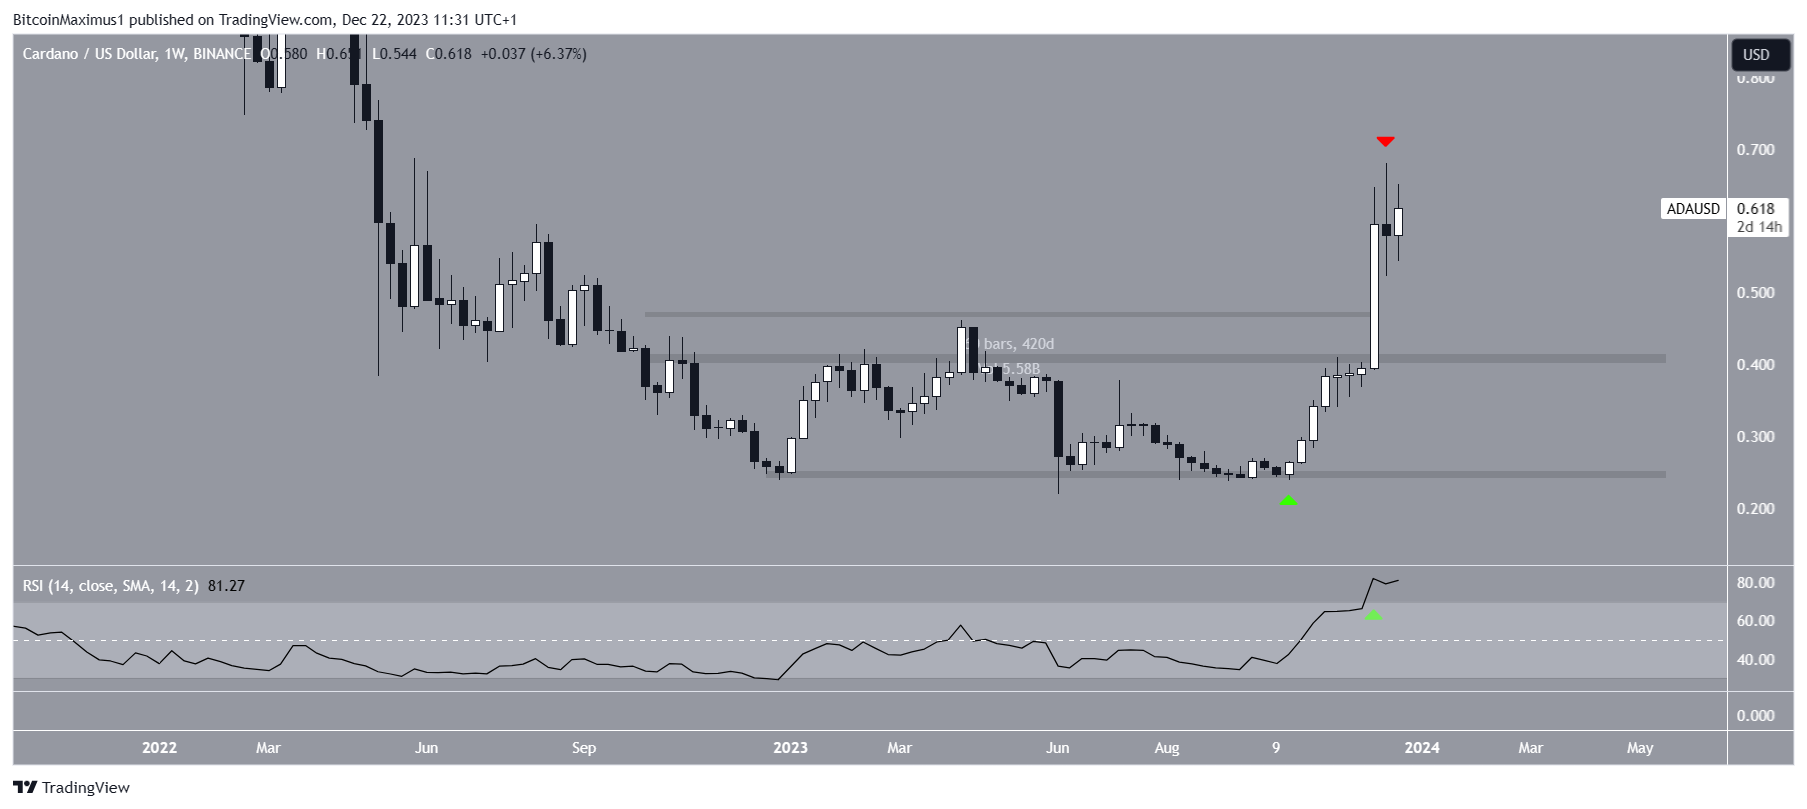
Market traders use the RSI as a momentum indicator to identify overbought or oversold conditions and to decide whether to accumulate or sell an asset.
Readings above 50 and an upward trend indicate that bulls still have an advantage, whereas readings below 50 suggest the opposite.
Despite the slight ADA price decrease, the RSI is above and moving upwards, both signs of a bullish trend.
Read More: How to Stake Cardano (ADA)
Cardano (ADA) Price Prediction – Correction or Extension?
The technical analysis of the daily time frame indicates that the ADA price is expected to correct before resuming to new highs. This is because of the wave count and RSI readings.
Technical analysts employ the Elliott Wave theory as a means to identify recurring long-term price patterns and investor psychology, which helps them determine the direction of a trend.
Cryptocurrency trader Blue Crypto believes that the main resistance area is at $0.68. If the price breaks it, it can quickly increase to the next resistance at $0.90.
Read More: How to Stake Cardano (ADA)
However, the most likely count suggests that ADA will not break out above the $0.68 resistance. Rather, it has begun wave four in a five-wave upward movement (black). The sub-wave count is in white.
If the count is correct, then ADA will fall by 18% and reach the 0.382 Fib retracement support level at $0.50.
The daily RSI supports this scenario since it has generated a bearish divergence (green line).
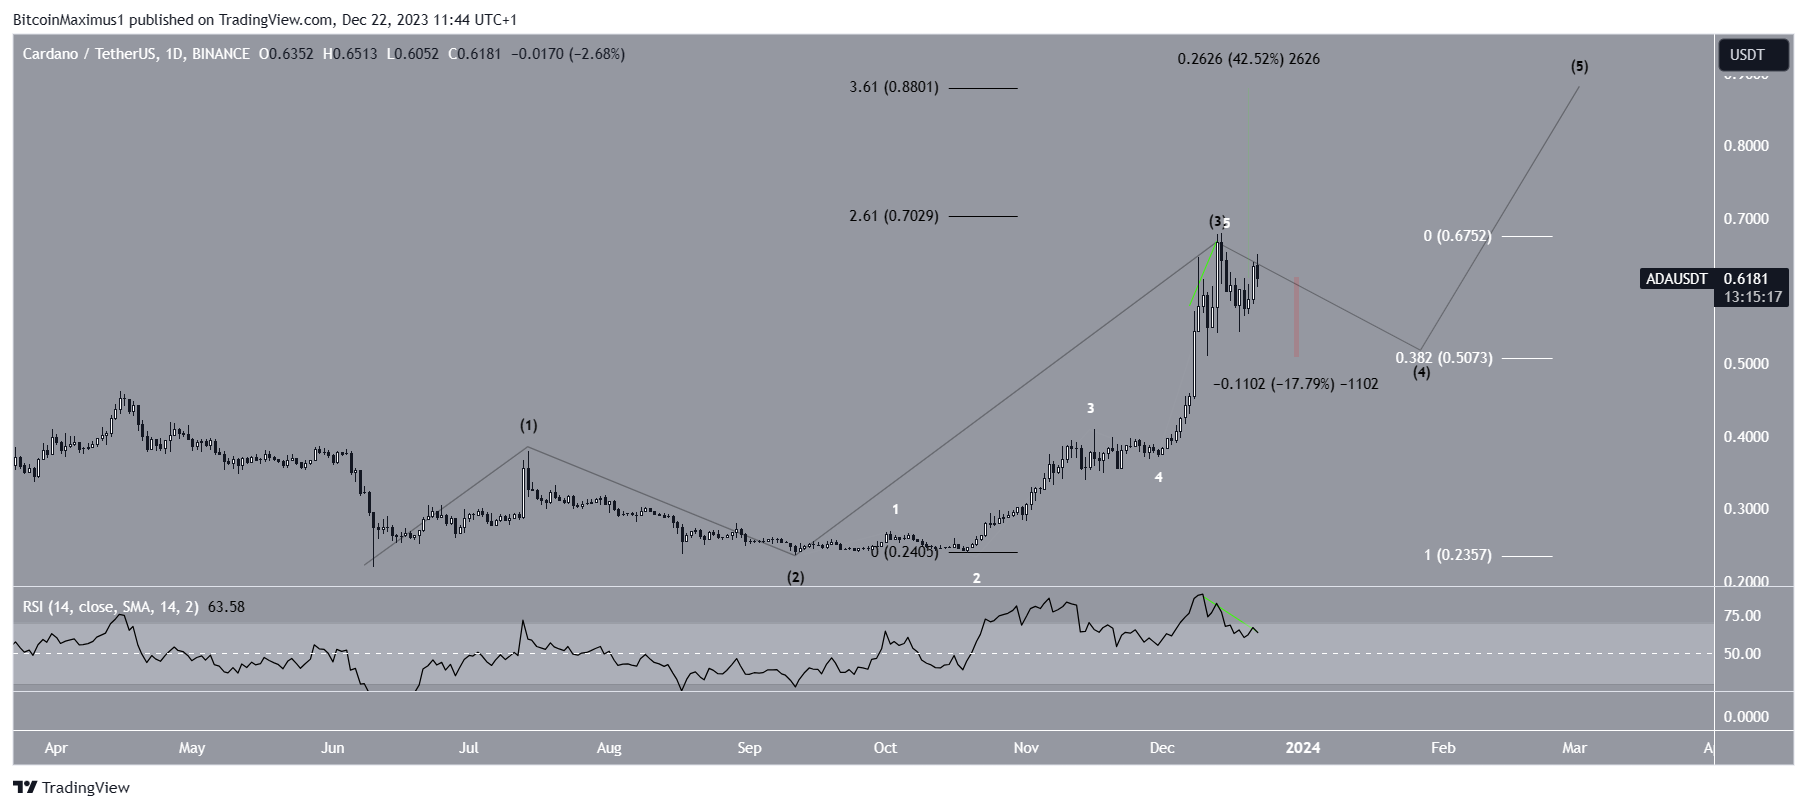
Despite this bearish ADA price prediction, moving above $0.68 would mean wave three will extend. If so, the ADA price could potentially increase by 40% to the next resistance at $0.88.
For BeInCrypto’s latest crypto market analysis, click here.


