


The Cardano Vasil upgrade went live at 21:45UTC and early indications show relative sideways action in terms of price.
Updated Sep. 23, at 6:00 AM UTC: Cardano’s TVL surged by 6% in the last 24 hours to hit a high of $82.85 million.
The recent price movement for Cardano (ADA) is bearish and indicates that a breakdown will occur soon. Despite being up 5% over the last 24 hours, most likely in anticipation of the Vasil upgrade, which has now occurred.
Cardano’s blockchain launched its Vasil upgrade on Thursday. The upgrade is named after Vasil St. Dabov, a Cardano community member who passed away in 2021.
However, the new capabilities for developers will be only available on Sept. 27, one epoch later.
Vasil is part of Cardano’s third development cycle and is considered the most extensive upgrade attempted for Cardano to date. The upgrade is expected to reduce transaction fees, increase speed and improve decentralized application (dApp) development.
The latter point is especially important, since while ADA has a market capitalization of more than $15 billion, ranking #8, it only has $78.80 million Total Value Locked (TVL), lagging considerably even below smaller blockchains like Solana and Avalanche.
Cardano blockchain long-term decrease despite Vasil upgrade
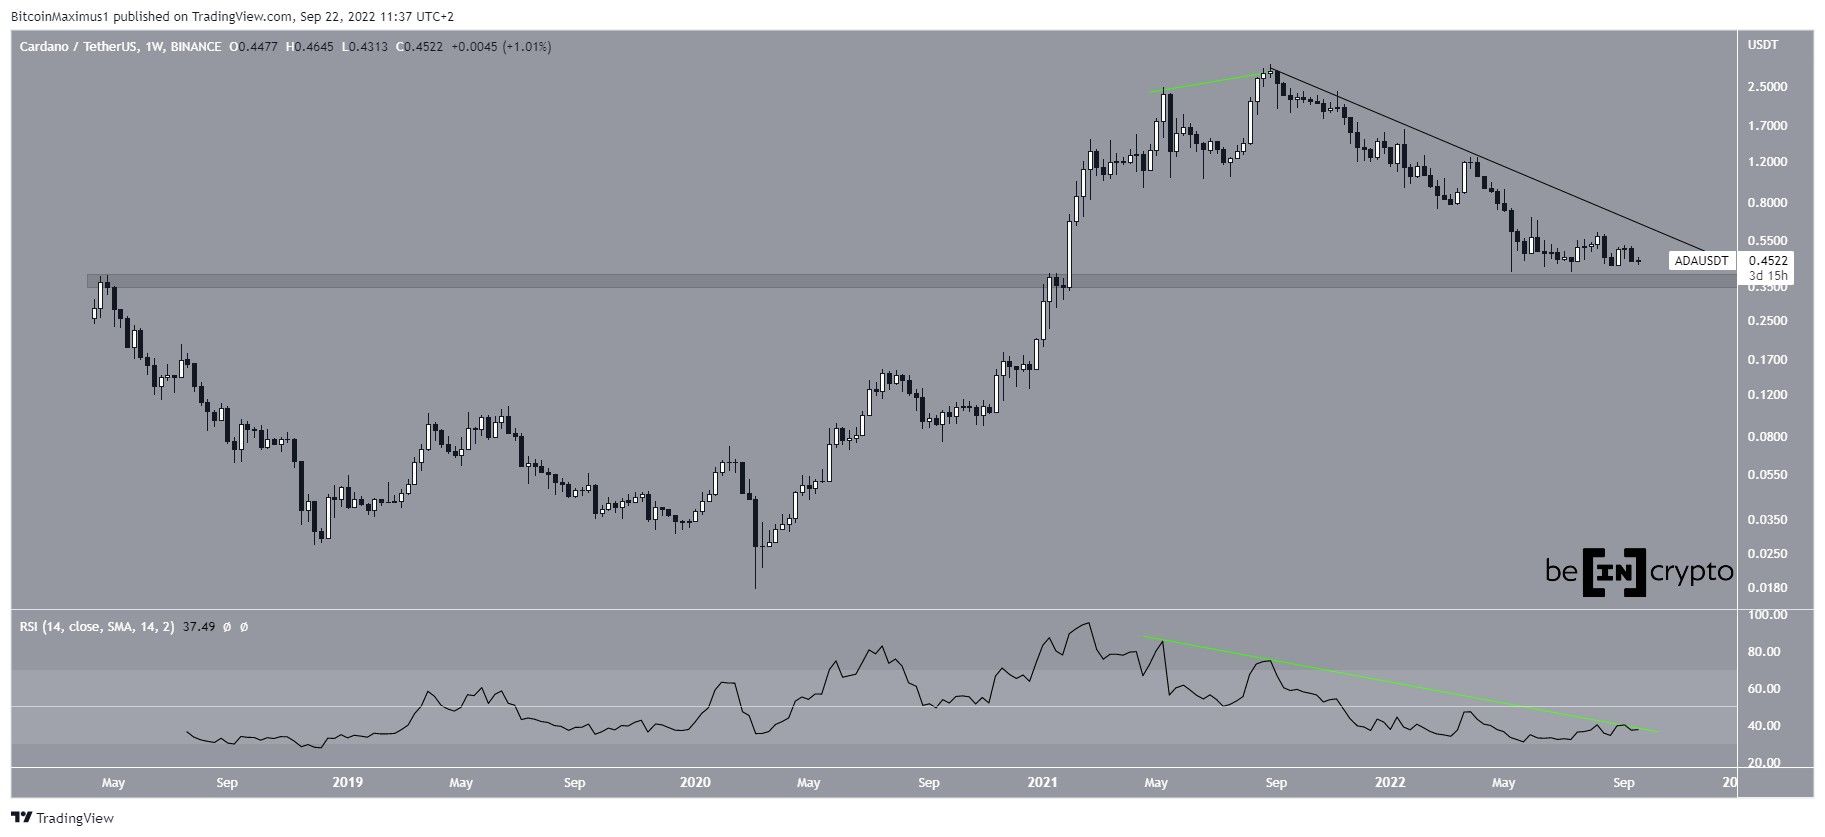
ADA has been decreasing below a descending resistance line since Sept. 2021, when it had just reached an all-time high price of $3.10. The decrease has led to a low of $0.40 in May 2022.
The low was made just above the $0.36 horizontal support area, which acted as the top in May 2018.
The price increased slightly afterward. But, it has yet to reach the aforementioned descending resistance line. Additionally, the weekly RSI has yet to break out from its bearish divergence trendline (green). Until both of these occur, the trend cannot be considered bullish.
ADA price wave count analysis
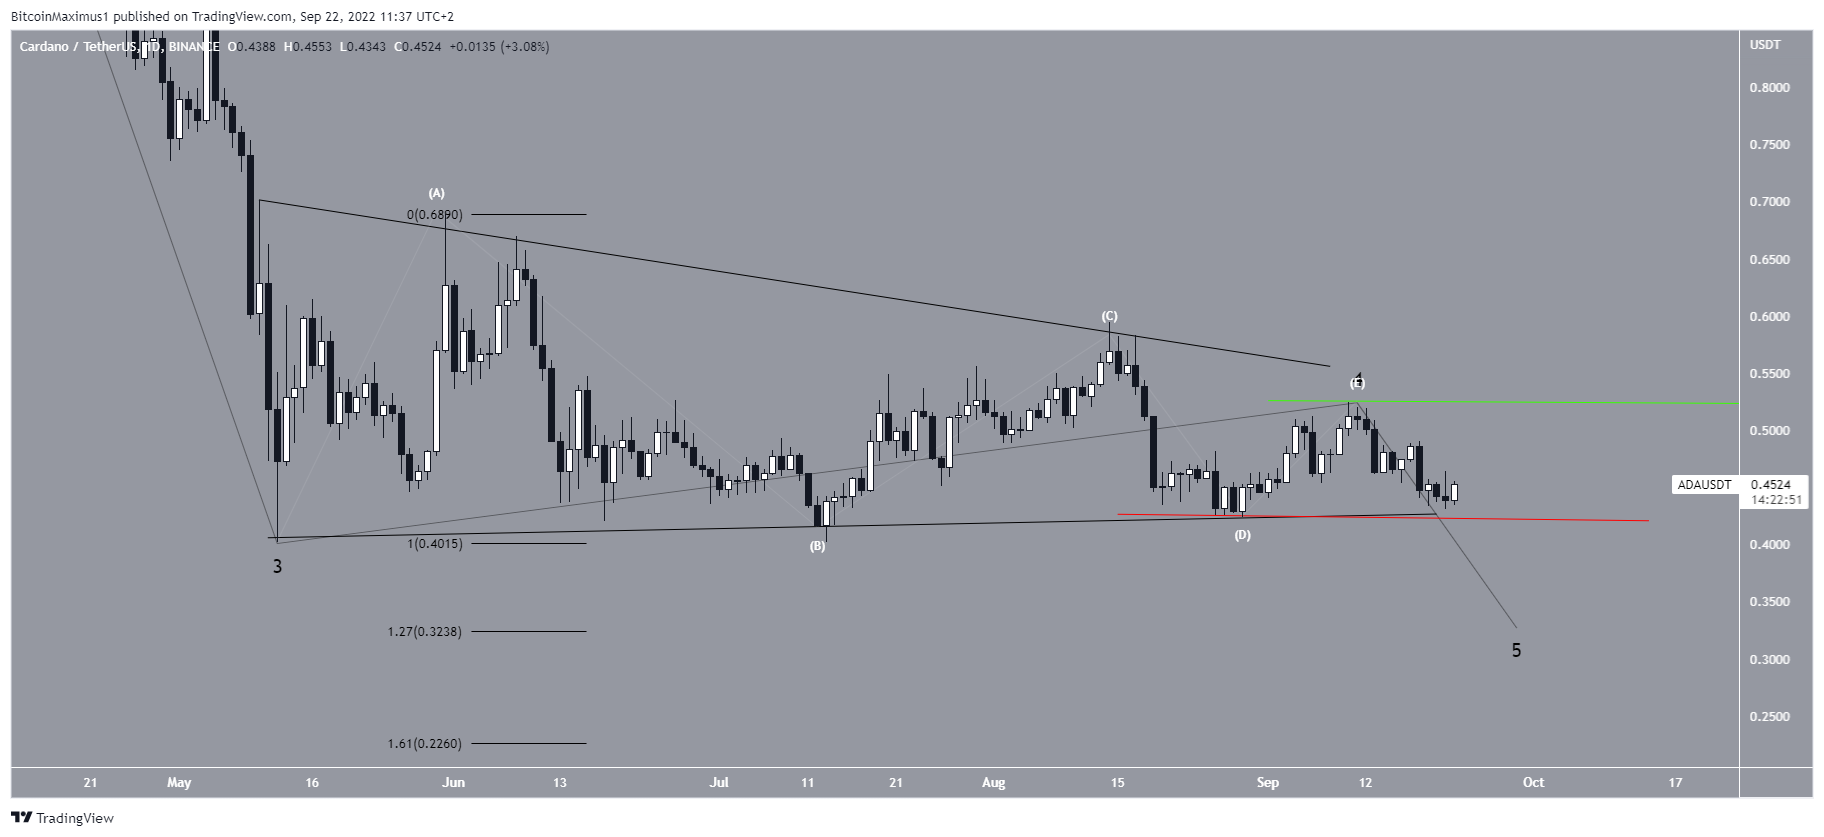
Since the May bottom, it seems that ADA is trading inside a symmetrical triangle, which could be wave four (black) of a five-wave downward movement. The sub-wave count is given in white.
If so, the ensuing breakdown would be part of wave five, which would be expected to take the price to one of the closest support levels at $0.32 or $0.22. The targets are given by the 1.27 and 1.61 external Fib retracement levels respectively when measuring the height of the triangle.
A breakdown below the $0.427 low (red line) will confirm this count while an increase above $0.594 high (green line) would invalidate it. At the current time, the latter seems unlikely.
For Be[In]Crypto’s latest Bitcoin (BTC) analysis, click here


