


The price of Cardano (ADA) currently trades near the midpoint of a long-term range. It got there after a rejection from the top of this range in July.
This rejection was validated after the price lost an ascending support line. This occurrence implies that the ADA price is undergoing a correction phase.
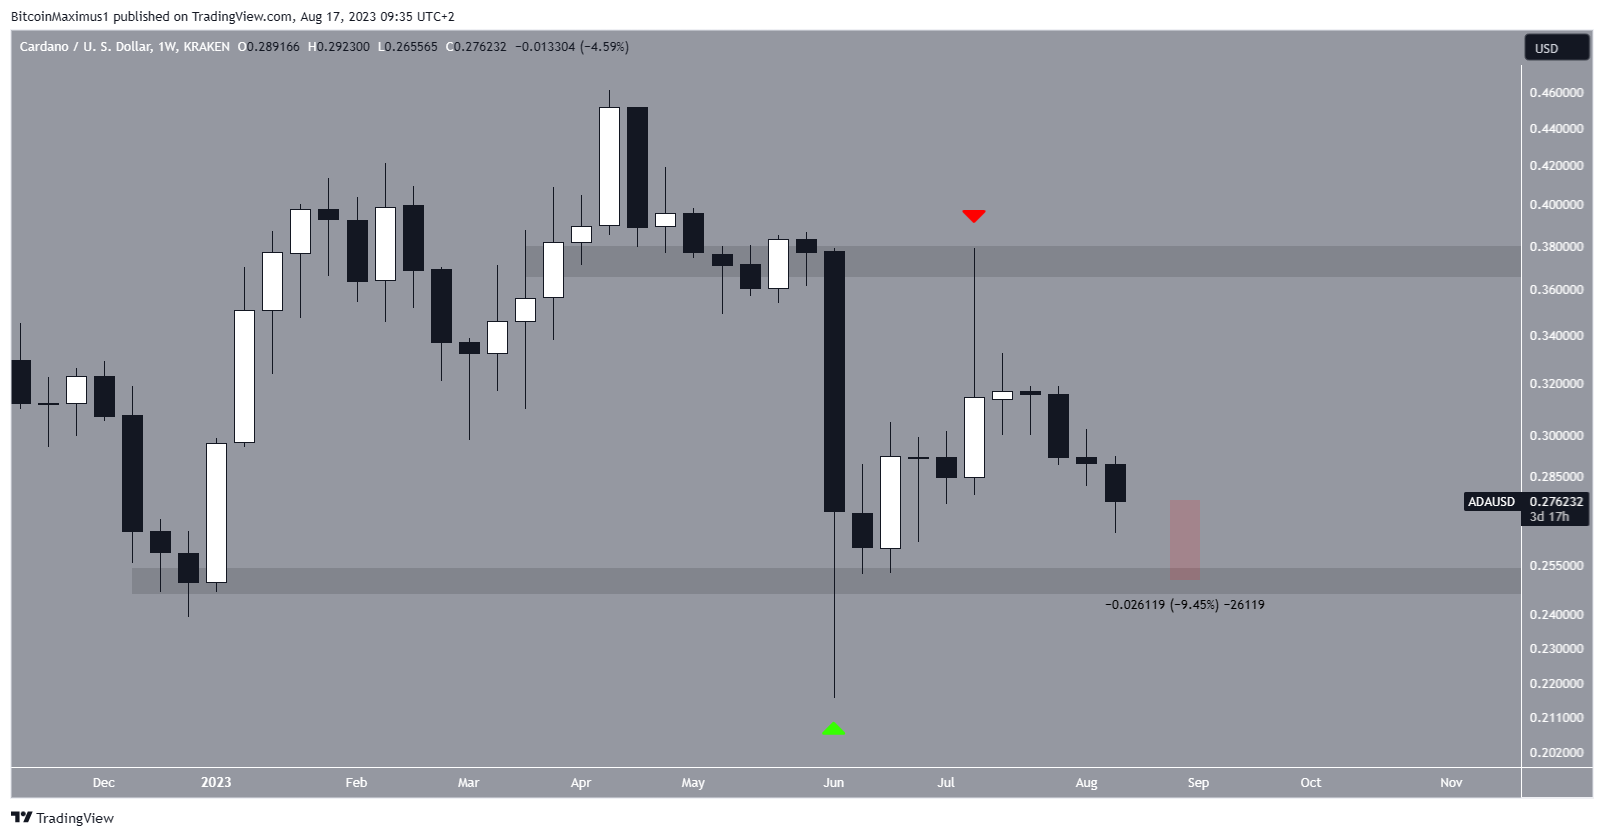
Cardano Resumes Descent to Range Low
The weekly timeframe technical analysis shows that ADA was rejected by the $0.38 horizontal resistance area in July (red icon). The rejection created a long upper wick, considered a sign of selling pressure. Moreover, it initiated a downward movement that is still ongoing.
The closest support area is at $0.25, close to the yearly lows. The price is approaching it despite a considerable increase in Total Value Locked in the Cardano blockchain this year.
ADA has traded above it since the beginning of the year, with the exception of a temporary decrease in June (green icon), which created a long lower wick.
Crypto investing, simplified. Get ADA price predictions here.
The ADA price now trades at $0.27, 10% above the $0.25 horizontal support area. It is worth noting that Cardano whales have withdrawn $29 million in a span of 7 days and that network activity declined steadily in July.
The weekly RSI gives an undetermined reading. When evaluating market conditions, traders use the RSI as a momentum indicator to determine if a market is overbought or oversold and to decide whether to accumulate or sell an asset.
If the RSI reading is above 50 and the trend is upward, bulls still have an advantage, but if the reading is below 50, the opposite is true. While the indicator is increasing, it is still below 50. This is a sign of an undetermined trend.
ADA Price Prediction: Breakdown Can Lead to Lows Near $0.25
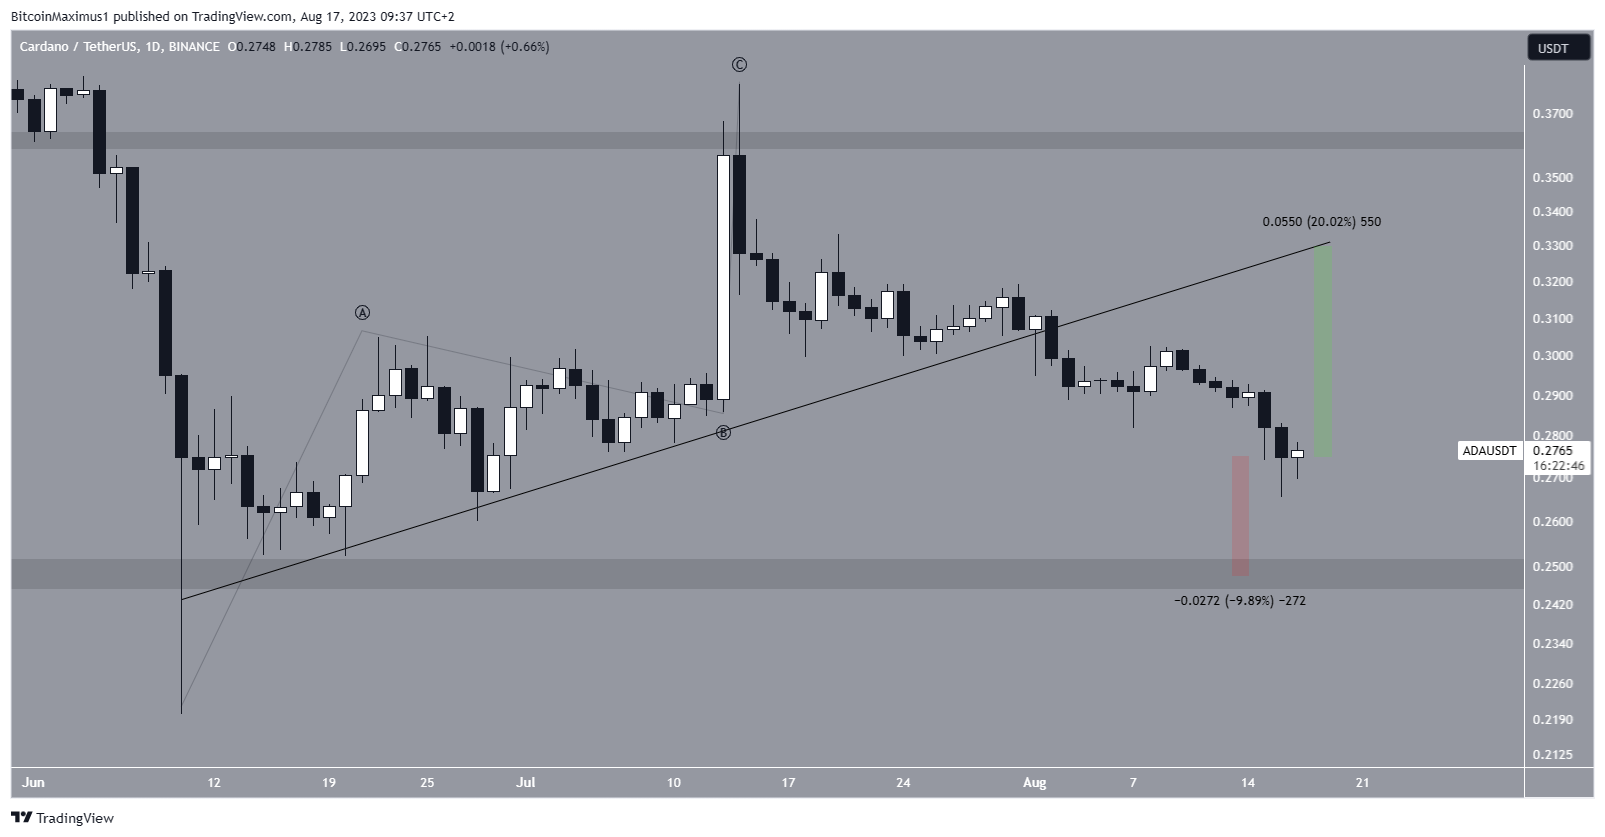
The analysis conducted on the six-hour timeframe reveals a bearish perspective. Both the observed price movements and the application of the Elliott Wave principle support this outlook.
The examination of the Elliott Wave pattern has pointed towards completing a corrective A-B-C structure (black). This configuration trends upwards, suggesting that the trend is bearish. The Elliott Wave theory is a tool utilized by technical experts to identify recurrent prolonged price trends and investor sentiments, aiding in anticipation of the trend’s future direction.
This bearish viewpoint received validation when the ADA price experienced a breakdown below a short-term upward support line on July 31, despite a positive announcement by Charles Hoskinson. This occurrence marked the end of the preceding upward movement.
Should the ADA price continue its descent, there is potential for a further decline of approximately 10%. This would lead to the horizontal support level at $0.25.
Conversely, a resurgence in price momentum could yield a 20% rise, bringing the price back to the ascending support line, where it would be verified as resistance. In that case, the line would be at $0.33.
The daily RSI supports this bearish outlook since it falls below 50 (red circle).
As things stand, the prediction for ADA’s price is bearish, projecting a decline toward the $0.25 range.
However, a strong bounce at the current level could initiate an upward movement that takes ADA to the previous ascending support line at $0.33. This would be an increase of 20%, measuring from the current price.
Trade With AI – 9 Best AI Crypto Trading Bots to Maximize Your Profits
For BeInCrypto’s latest crypto market analysis, click here.


