


Even though Cardano (ADA) has not increased significantly since its June lows, it has started to gain traction, potentially because of the upcoming Vasil hard fork. Weekly indicators are leaning on being bullish.
The Vasil hard fork is expected to go live on Sept 22. In anticipation of the hard fork, decentralized applications (dApps), exchanges and validators are continuously upgrading the system in order to ensure compatibility.
On Sept 9, the team released Daedalus v.5.0.0, the final mainnet prior to the hard fork. Version 5.0.0 fixes several issues, most importantly one in which the system still sends the previous amount of tokens even if the user has altered the amount during fee calculation.
Long-term movement
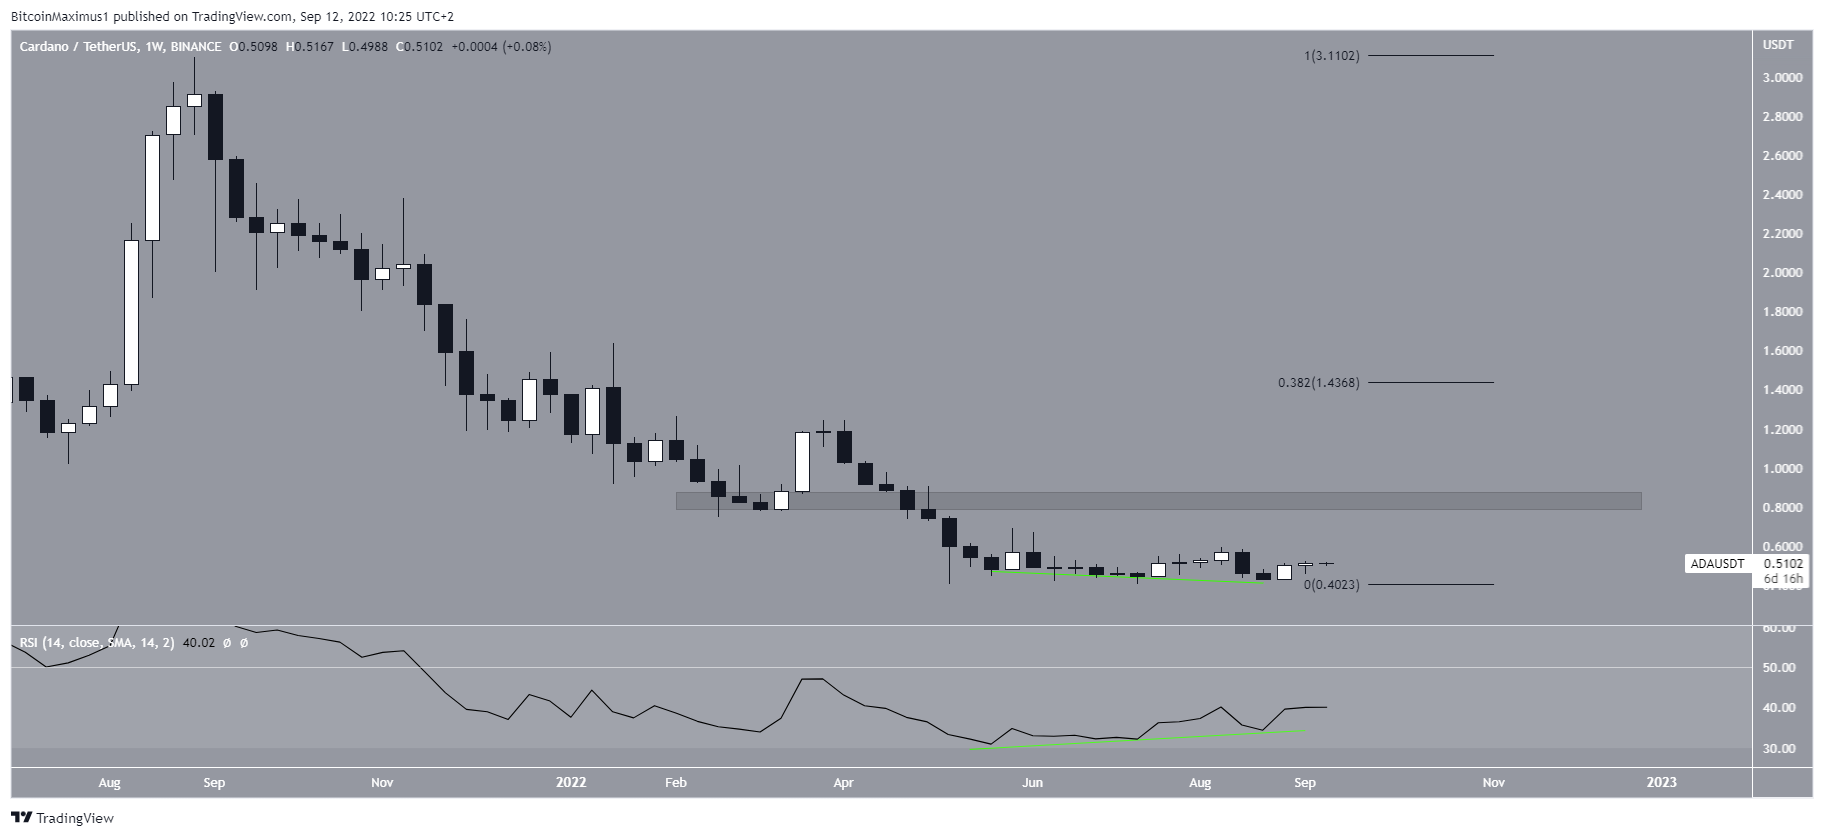
The weekly chart for ADA also shows the potential for future increases. The main reason for this is the potential double/triple bottom pattern that has been in development since June. The pattern has been combined with bullish divergence in the weekly RSI (green line). Such divergences are often catalysts for considerable upward movements.
However, the weekly RSI is still below 50. If it were to move above it, it would confirm the divergence and would likely be the catalyst for a pronounced upward movement.
If one occurs, the closest resistance area would be at $0.85. Afterward, the next resistance would be at the 0.382 Fib retracement resistance level at $1.43.
ADA wave count analysis
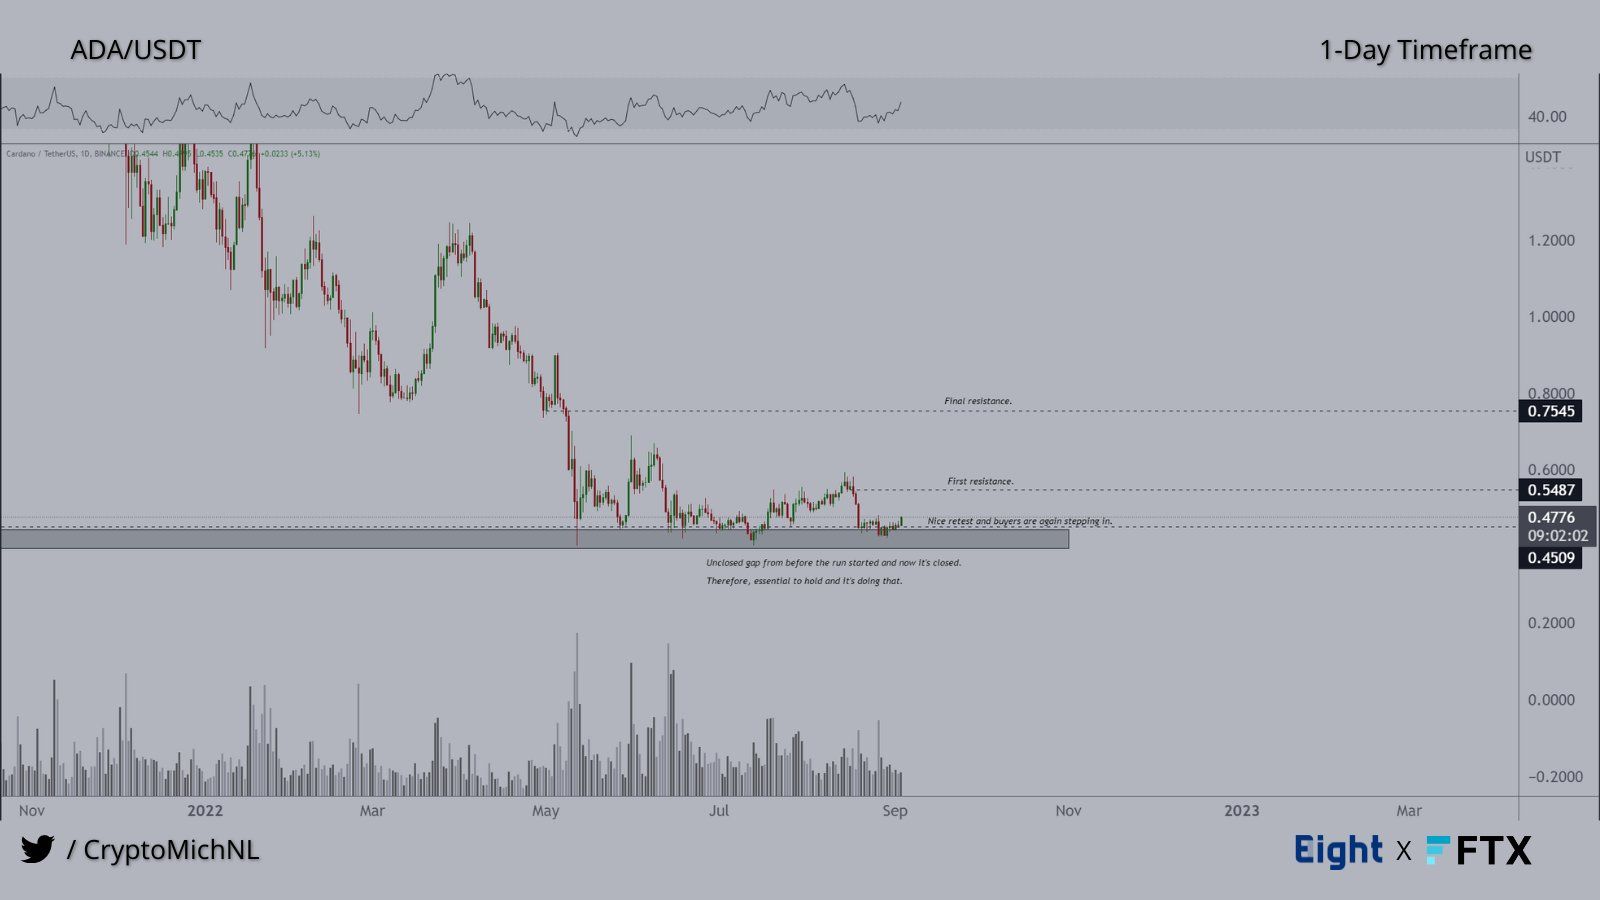
Cryptocurrency trader @CryptoMichNL tweeted a chart of ADA, stating that the price could increase towards $0.55 and $0.75, respectively.
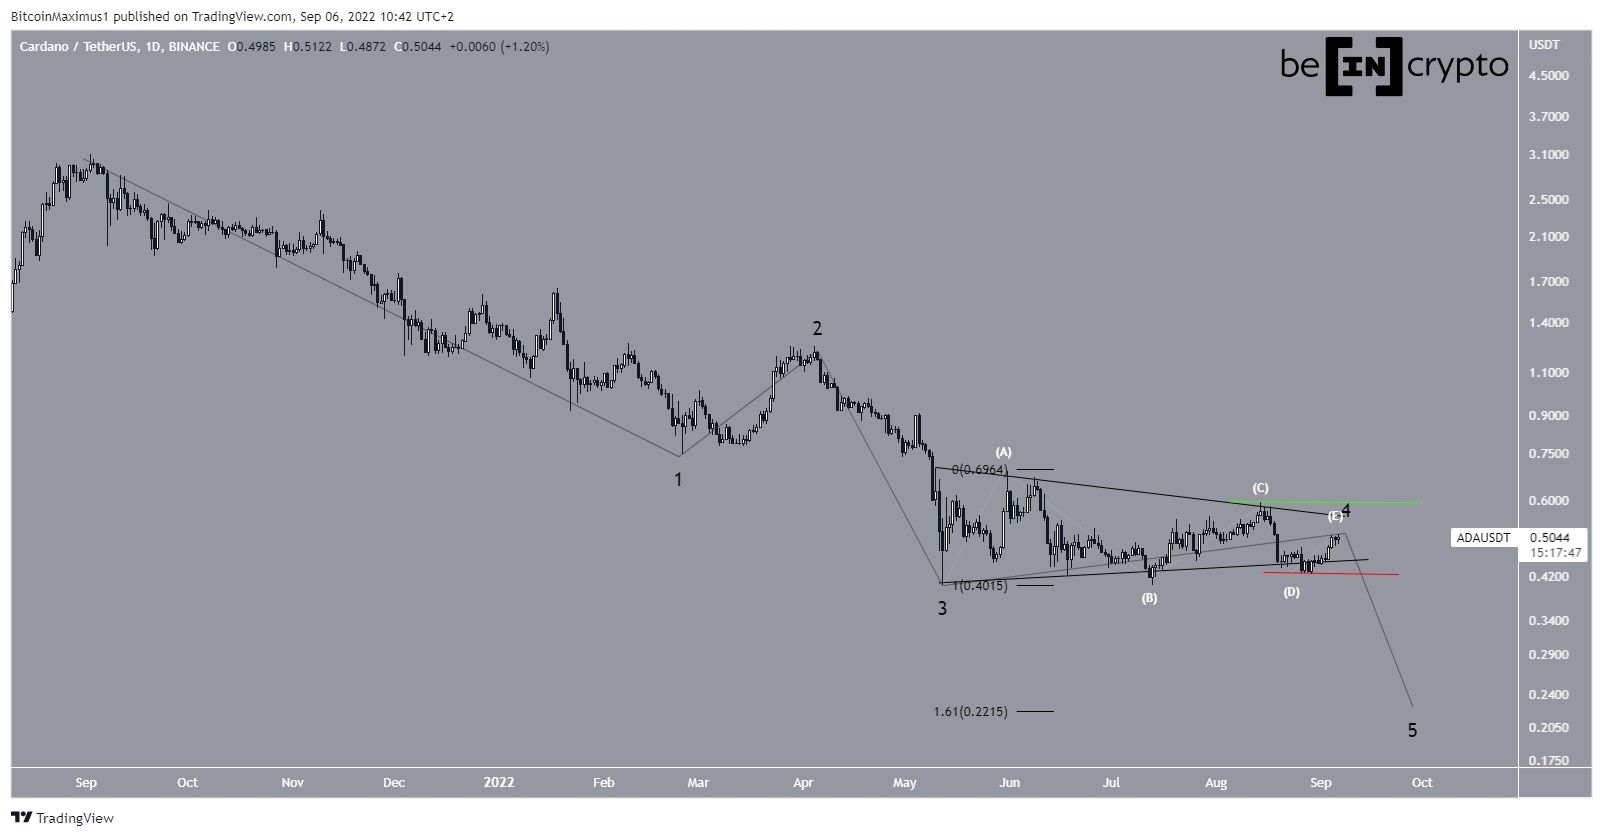
However, the wave count casts some doubt in this possibility. Measuring from the all-time high, it seems that the price is in the process of completing a five-wave downward movement (black).
If so, it is currently in the fourth wave, which has taken the shape of a symmetrical triangle. The sub-wave count is given in white.
If the count is correct, the price will break down from the triangle and decrease towards the next closest support area at $0.22. The target is given by the 1.61 external Fib retracement when measuring the height of the triangle.
So, since the indicator readings and price movements are not in alignment, whether the price breaks out from the $0.594 high (green line) or breaks down from the $0.427 low (red line) will likely determine the direction of the future movement.
For Be[in]Crypto’s latest Bitcoin (BTC) analysis, click here


