See More

Can Polkadot (DOT) Price Climb to $12 After Defeating Solana and Cardano?

2 mins
Updated by Ryan James
Join our Trading Community on Telegram

In Brief

  • Polkadot price marked a 12% recovery to reclaim the support of the rounding bottom pattern neckline.
  • DOT outperformed the likes of Solana and Cardano last week in becoming the favorite asset of institutional investors.
  • Investors are gaining confidence toward a rally as the recent recovery induced optimism.
  • promo

Polkadot price is witnessing the bullish impact of the positive interest it has received from institutional investors. The altcoin seems to be heading towards a previously failed high.

However, it might face multiple resistances in its path, which could subdue the bullishness noted presently.

Polkadot Outperforms Solana and Cardano

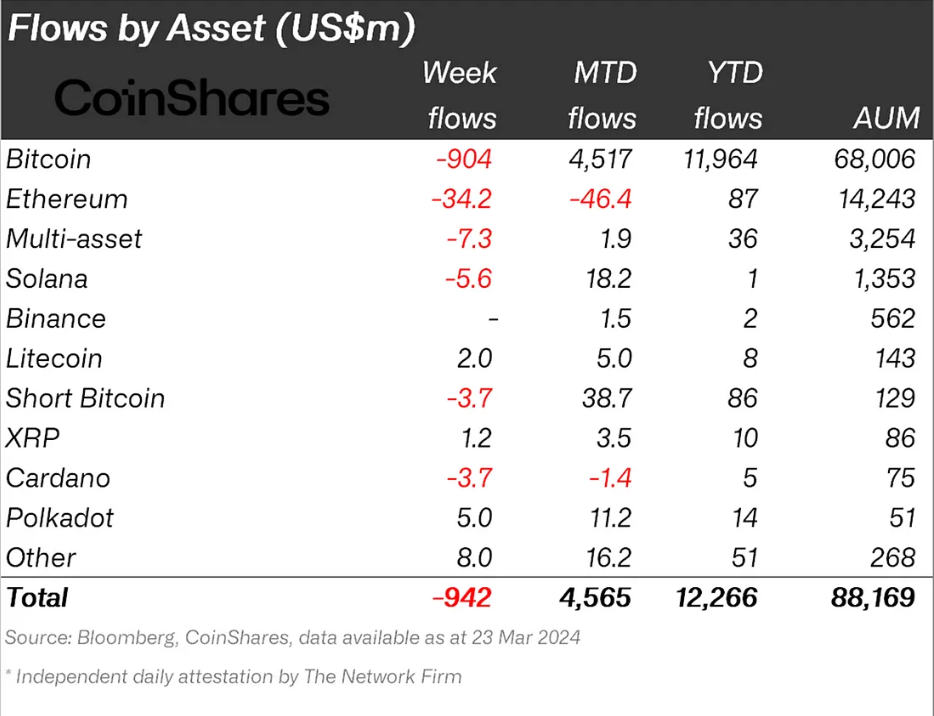
Polkadot price recovered by 12% this week and part of the credit for this goes to institutions along with retail investors. Their interest in DOT surged in the week ending March 23, so much so that they picked this altcoin over the likes of Solana and Cardano.

Polkadot recorded inflows worth $5 million, which, albeit not much, is still positive. On the other hand, SOL and ADA both observed outflows worth $5.6 million and $3.7 million, respectively. This shows that institutions opted for DOT this week, which also gave the price a boost.

Polkadot Institutional Flows.
Polkadot Institutional Flows. Source: CoinShares

Read More: Polkadot (DOT) Price Prediction 2024/2025/2030

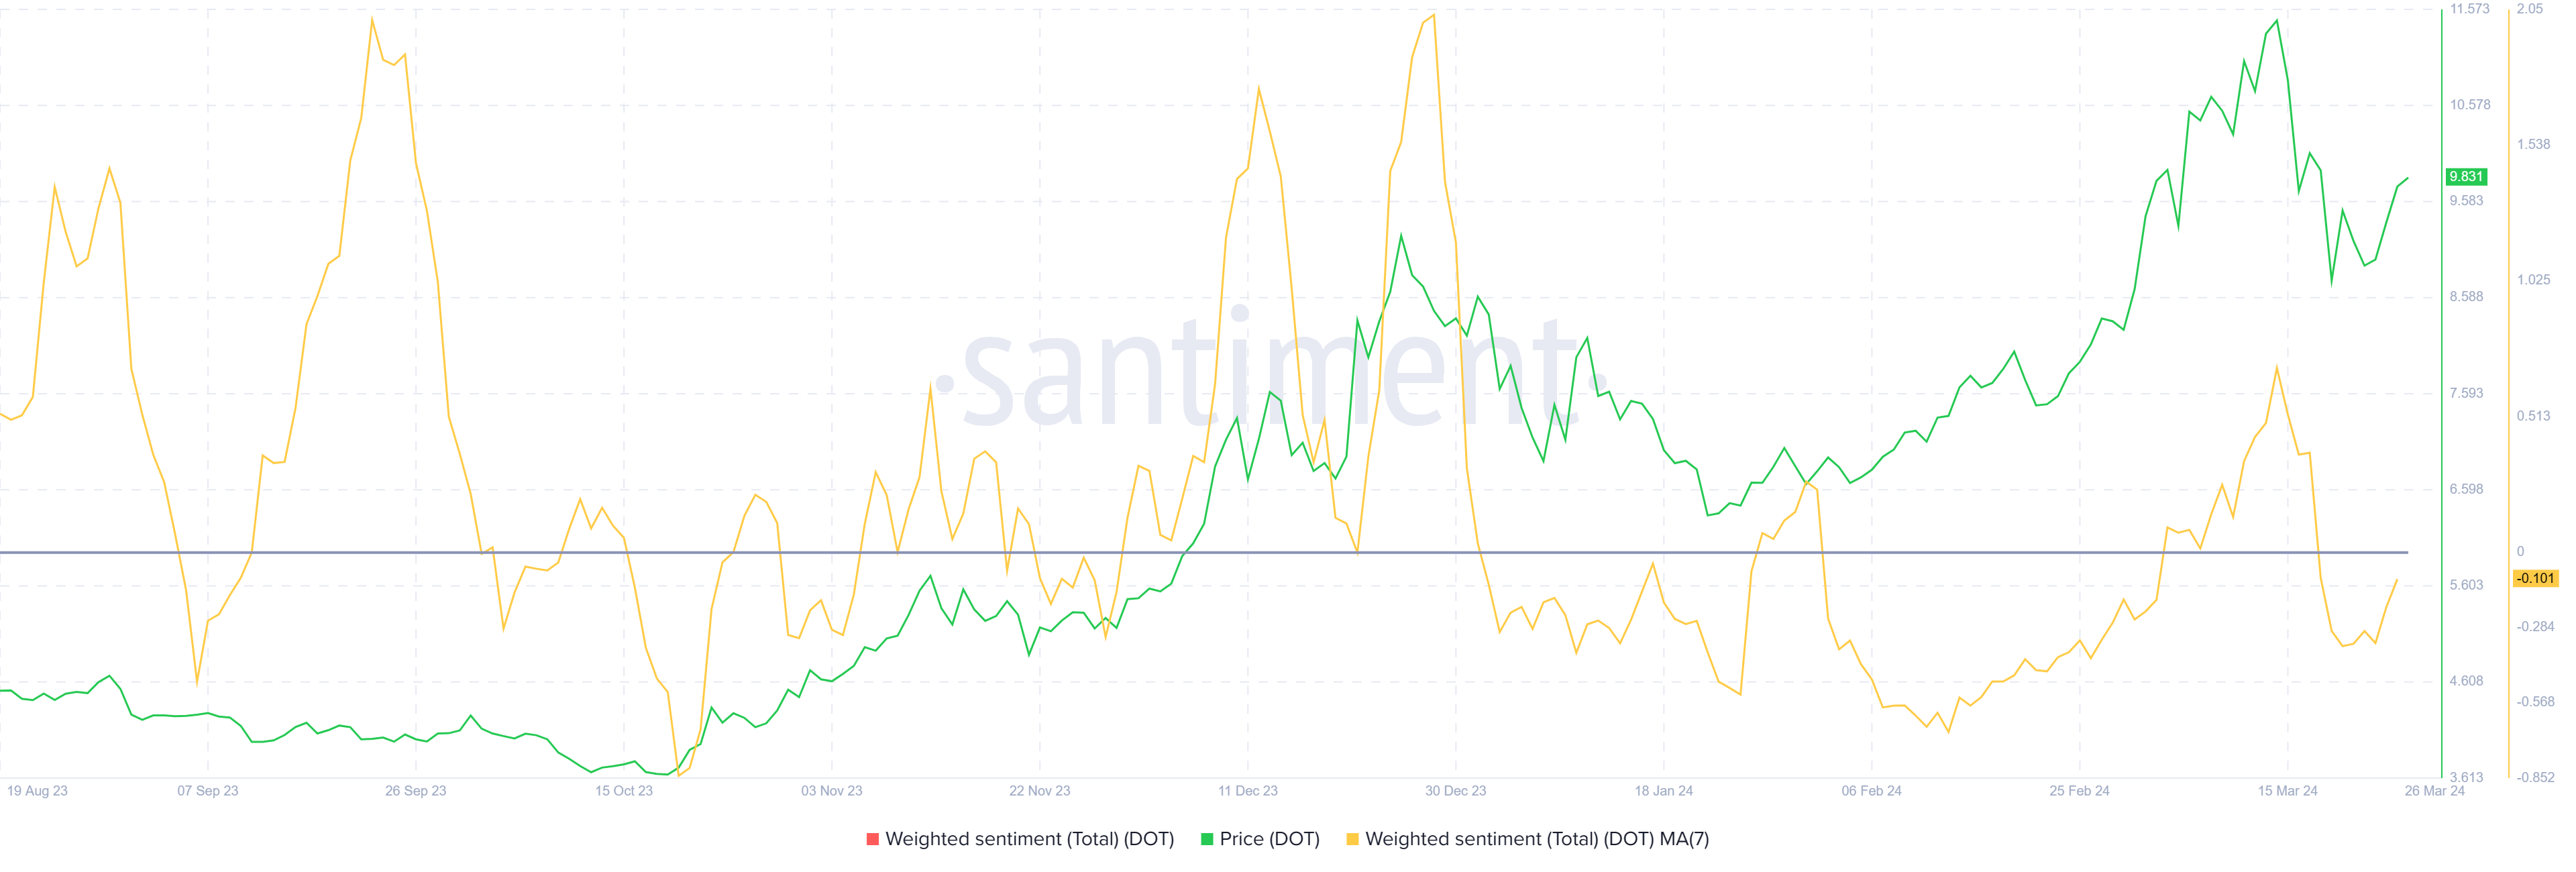
Similarly, retail investors are also exhibiting a comeback of the bullish sentiment following the recovery. This is crucial for Polkadot price as optimism would induce conviction which would keep the altcoin trending upwards.

Polkadot Investors' Sentiment.
Polkadot Investors’ Sentiment. Source: Santiment

DOT Price Prediction: Will Investors See $12 Again?

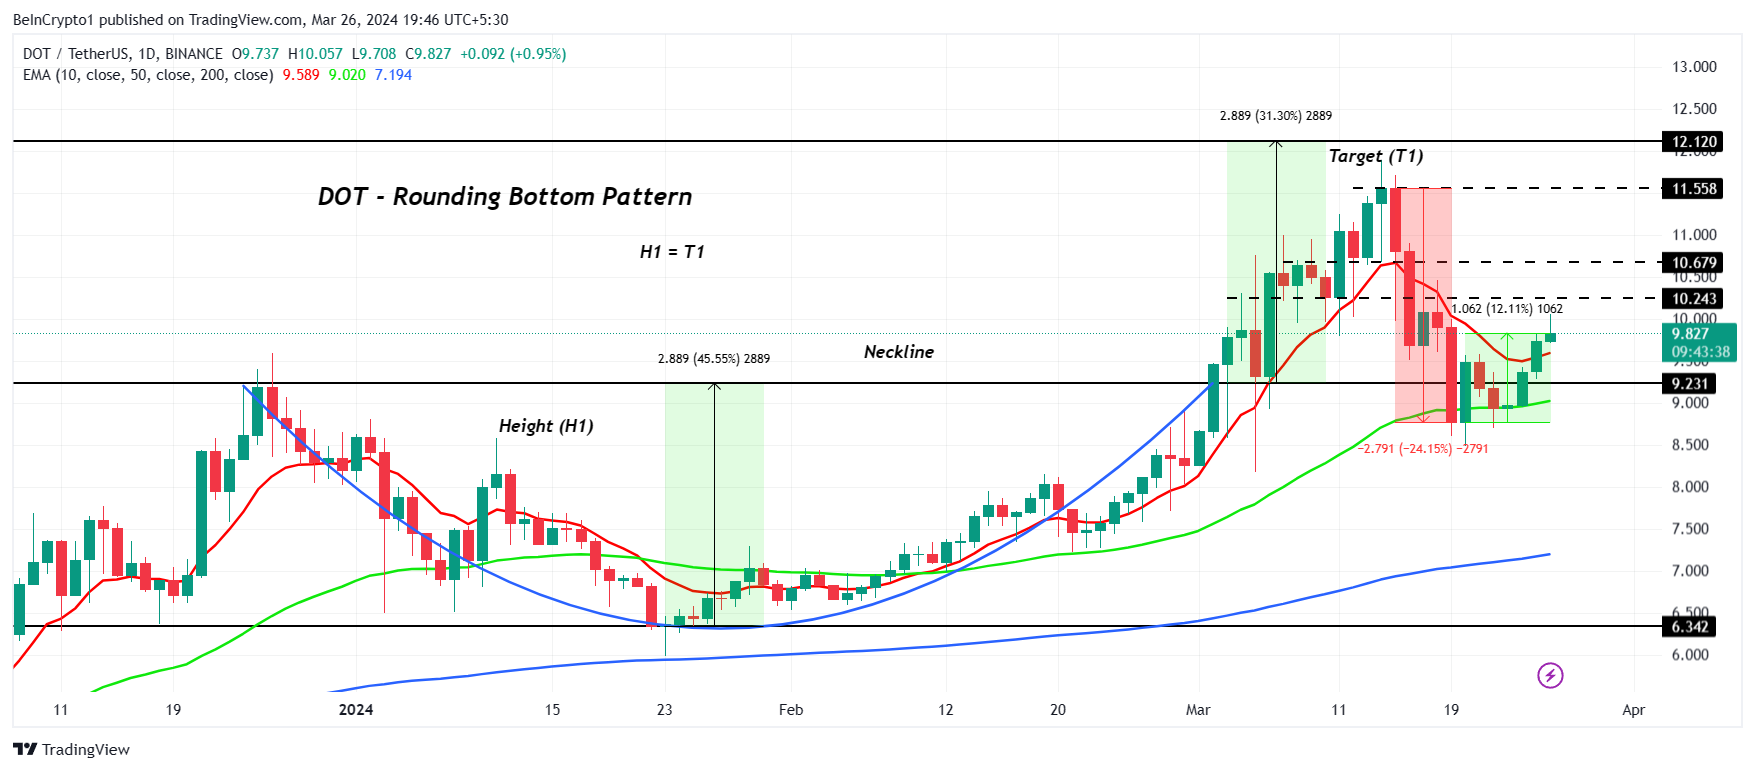
The bullish cues suggest that Polkadot price is certainly on the path of recovery and will continue rising. Over the past few weeks, the altcoin could be seen forming a rounding bottom pattern. This bullish reversal pattern suggested a potential rally of 31%, placing the target price at $12.

While DOT could not manage to fulfill this target during the previous bull run, it has a shot this time around, provided it can breach through the resistance levels marked at $10 and $11.

DOT/USDT 1-day chart.
DOT/USDT 1-day chart. Source: TradingView

Read More: What Is Polkadot (DOT)?

This local barrier might act as a hindrance to Polkadot’s rise, and if it fails to breach these resistances, it could fall back down to the $9.2 support floor. Losing this level would invalidate the bullish thesis, causing a decline to $8.

Best crypto platforms in Europe | April 2024
YouHodler YouHodler Explore →
M2 Exchange M2 Exchange Explore →
Wirex App Wirex App Explore →
PrimeXBT PrimeXBT Explore →
SunContract SunContract Explore →

Trusted

Disclaimer

In line with the Trust Project guidelines, this price analysis article is for informational purposes only and should not be considered financial or investment advice. BeInCrypto is committed to accurate, unbiased reporting, but market conditions are subject to change without notice. Always conduct your own research and consult with a professional before making any financial decisions. Please note that our Terms and ConditionsPrivacy Policy, and Disclaimers have been updated.

Frame-2t314.png
Aaryamann Shrivastava
As a Mass Media (Journalism) graduate, my journey into cryptocurrency journalism has evolved into a distinguished role as an On-Chain Analyst over the past two and a half years. Collaborating with industry-leading media companies like FXStreet, AMBCrypto, and FXEmpire, I’ve delved deeply into the intricate realms of Crypto and Blockchain, crafting over 2,500 meticulously curated SEO-focused articles. Driven by a commitment to excellence, I remain steadfast in delivering the highest caliber...
READ FULL BIO
Sponsored
Sponsored