
The Bitcoin price has broken down from an important support area and is in the process of validating it as resistance. If the price gets rejected, it could signal the beginning of a corrective period.
The Bitcoin price had an eventful day with considerable volatility on May 14. The price reached a high of $9,939, dropped to $9,511 in one of the biggest one-minute candlesticks in recent history, only to pump back to $9,800. However, BTC began May 15 with a decrease that is still ongoing.
Bitcoin’s Lower-High
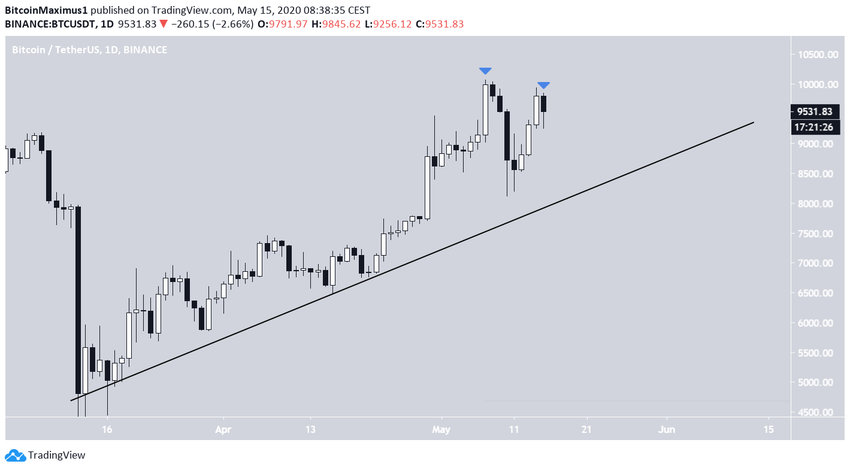
The Bitcoin price has been following an ascending support line since the price reached a bottom on March 13. It accelerated its gains on April 22 and the price has not touched the support line since. The price reached a high of $10,067 on May 6 and has been decreasing since.
Yesterday, the price generated the first lower-high relative to May 6. Therefore, this could be the beginning of a downward trend that takes the price back to this ascending support line and possibly even lower.
Short-Term Movement
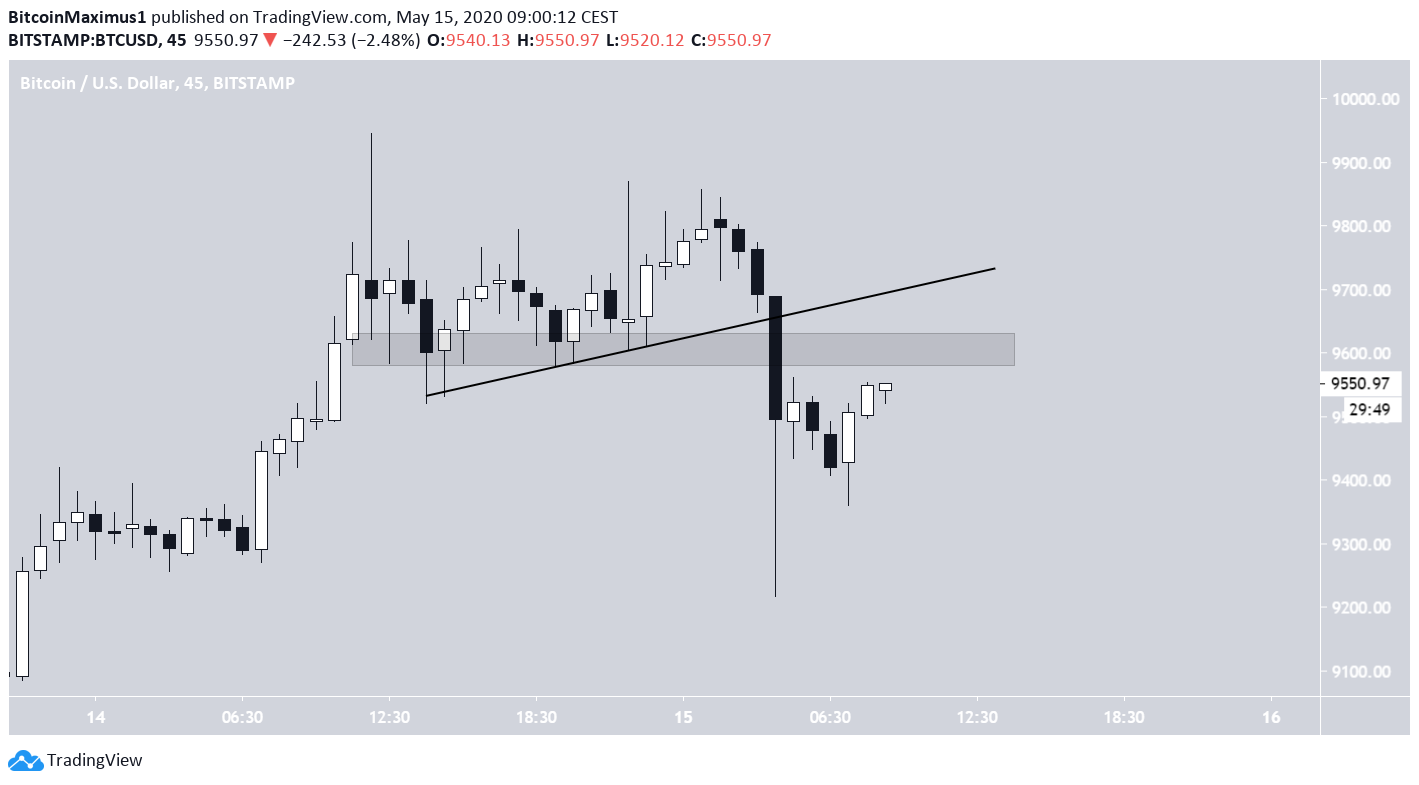
In the short-term, BTC has broken down from an ascending support line along with a support level found at $9,600.
The customary movement would be a re-test of this area or line as resistance, followed by a price decrease. If the price were to reclaim this support, it could mean that it is heading towards new highs.
As for the wave count, it is possible that yesterday’s high was the top of the ‘B’ wave, and the price has just begun a correction. Furthermore, the decrease shares numerous similarities with that after the May 7 high. So, if the fractal holds true, we could soon see a rapid decrease in the BTC price.
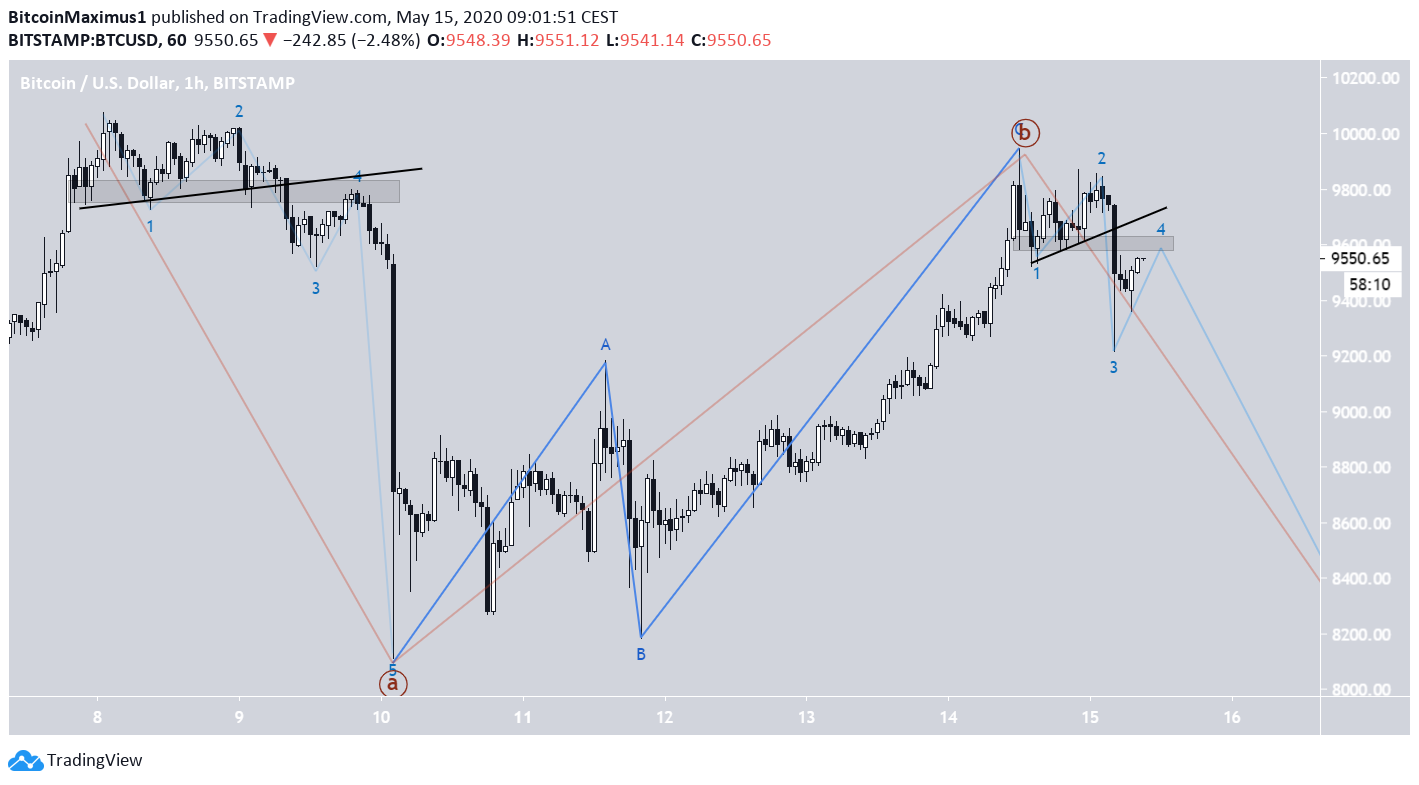
To conclude, the Bitcoin price has possibly reached the top of the ‘B’ wave and will likely soon begin a correction. This possibility would be invalidated by reclaiming the ascending support area that BTC just broke down from.
For those interested in BeInCrypto’s previous Bitcoin analysis, click here.
