


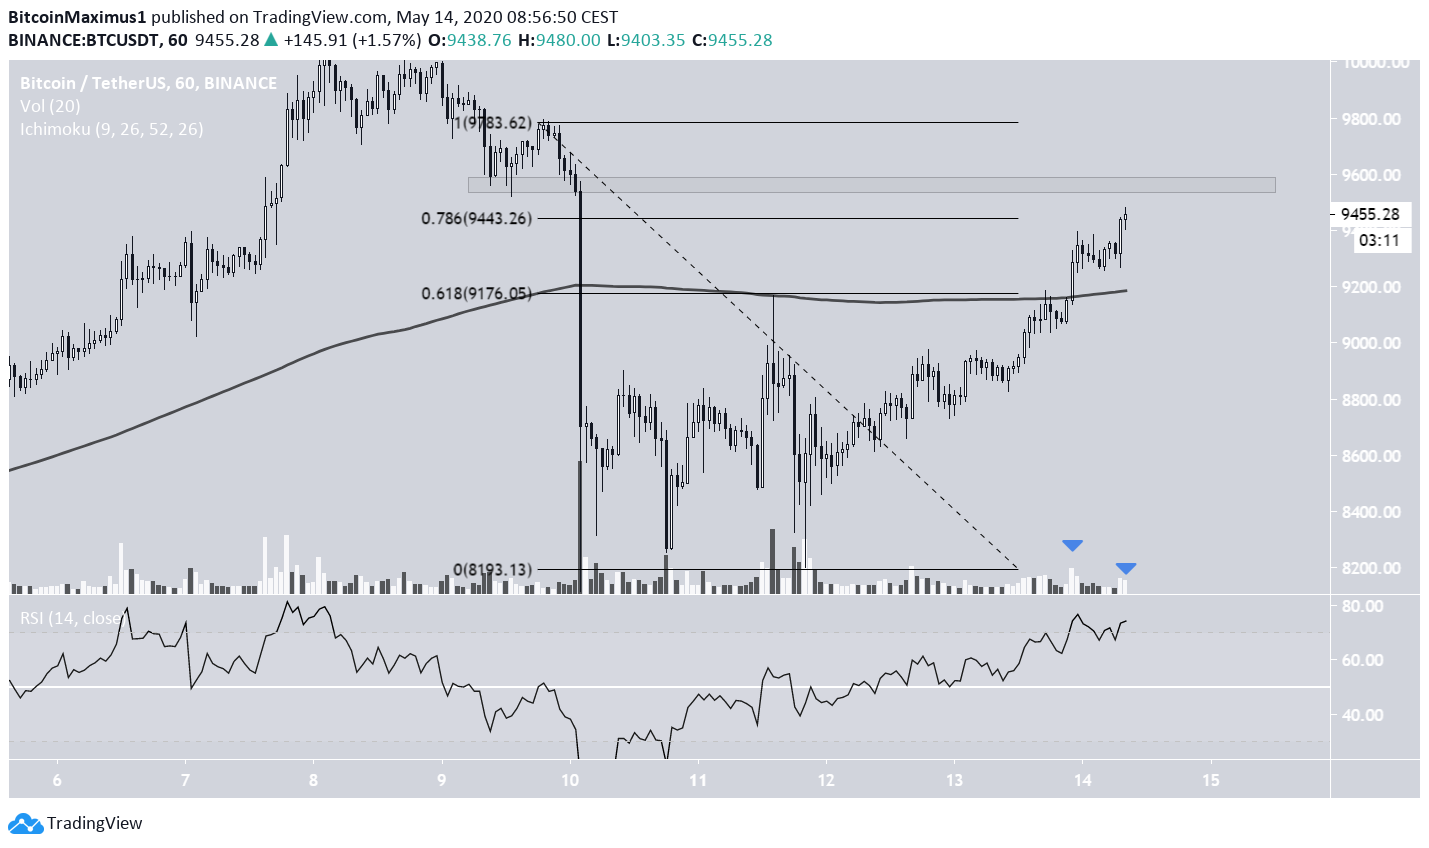
On May 13, the Bitcoin price was finally successful in moving above the $9,150 area that had been providing resistance since the drop on May 10.
The Bitcoin price had been increasing since March 11 and moved above the aforementioned MA on its third try. However, volume was almost non-existent during the breakout and has been even lower since. Finally, the RSI has begun to show the first signs of weakness in the form of a bearish divergence.
Bitcoin Breaks Through
At the time of writing, the price was trading right under the 0.786 Fibonacci level, which is expected to initiate a reversal. Furthermore, there is a minor resistance level near $9,600 which is also likely to reject the price.
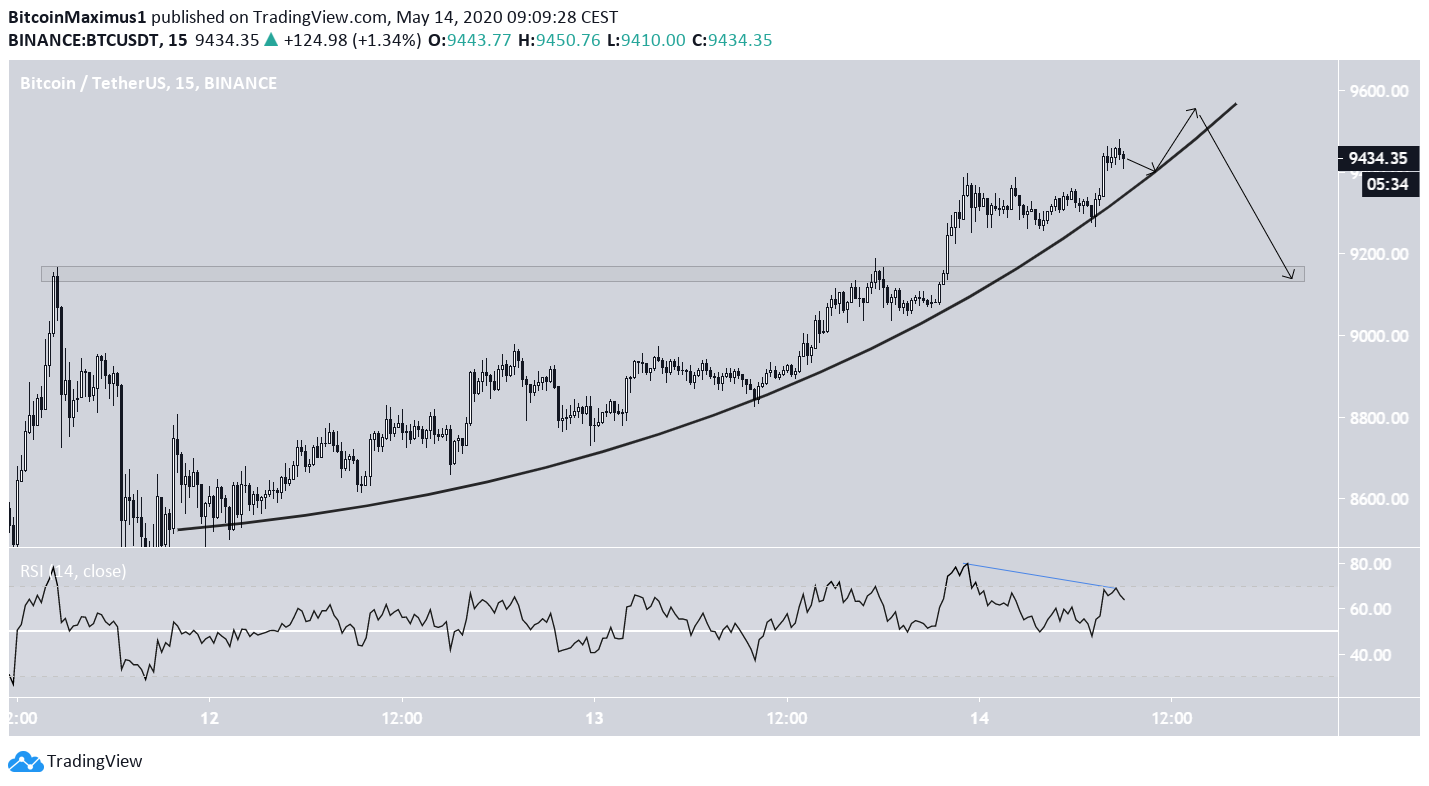
Looking at the 15-minute chart, we can see that the move has become parabolic. This is unsustainable in the long-run and suggests that the price will eventually break down. If so, the first minor support area is found at the breakout level of $9,150.
Wave Count
Since the $10,074 high on May 7, it is possible to outline an A-B-C correction, inside which the price is very close to the top of the B wave.
The correction has taken the zigzag form since its sub-wave count is 5-3-5 instead of 3-3-5. The main difference for this is the length of the C wave, which is now likely to be the same as the length of the A wave.
This also fits with a drawing of a potential parallel channel that connects the top of the A-B waves to the bottom of the A-C waves and suggests that the bottom of the C wave will be reached near $7,200.
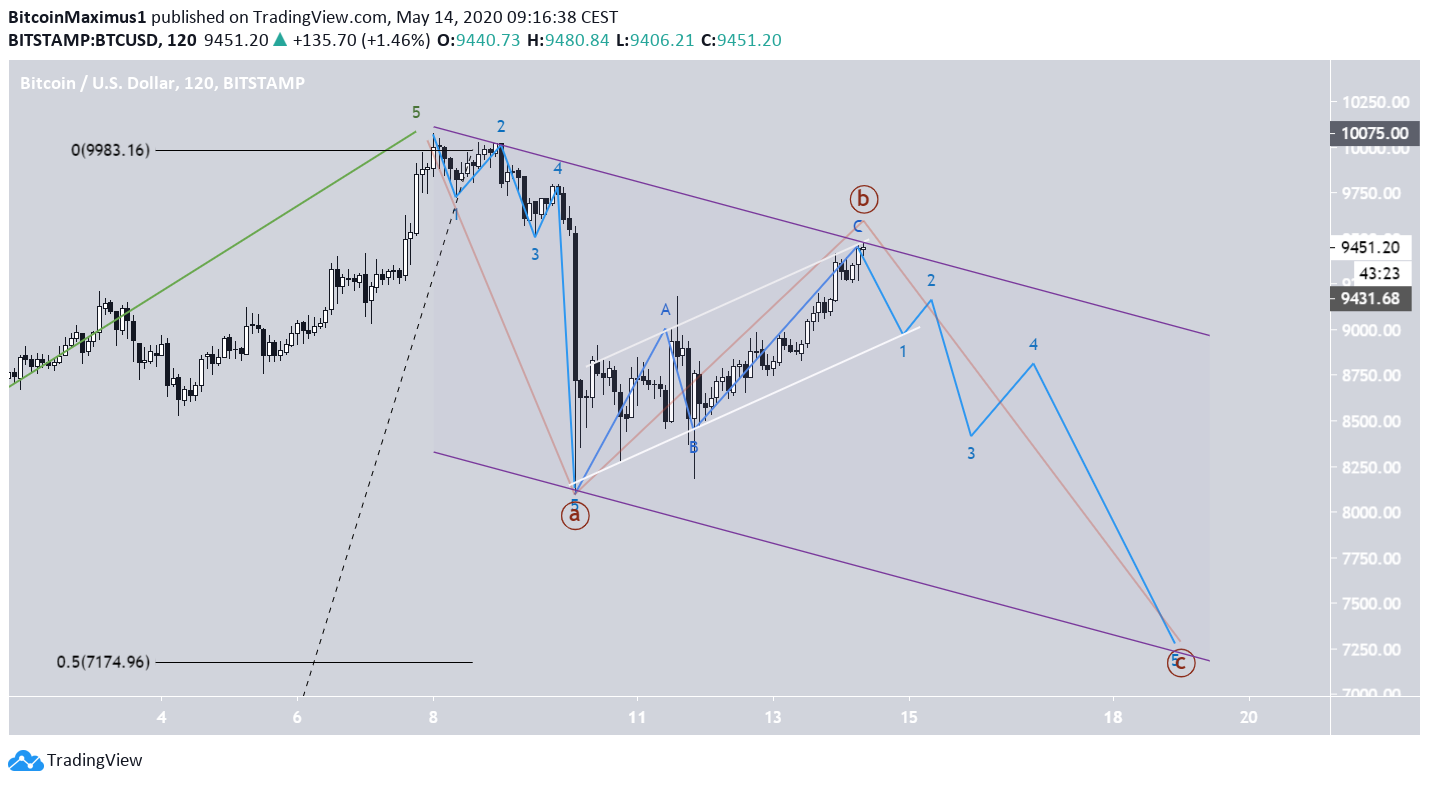
To conclude, the Bitcoin price is possible nearing the top of the B wave, after which a long-term correction is likely, and could take the price all the way back to $7,200.
For those interested in BeInCrypto’s previous Bitcoin analysis, click here.


