
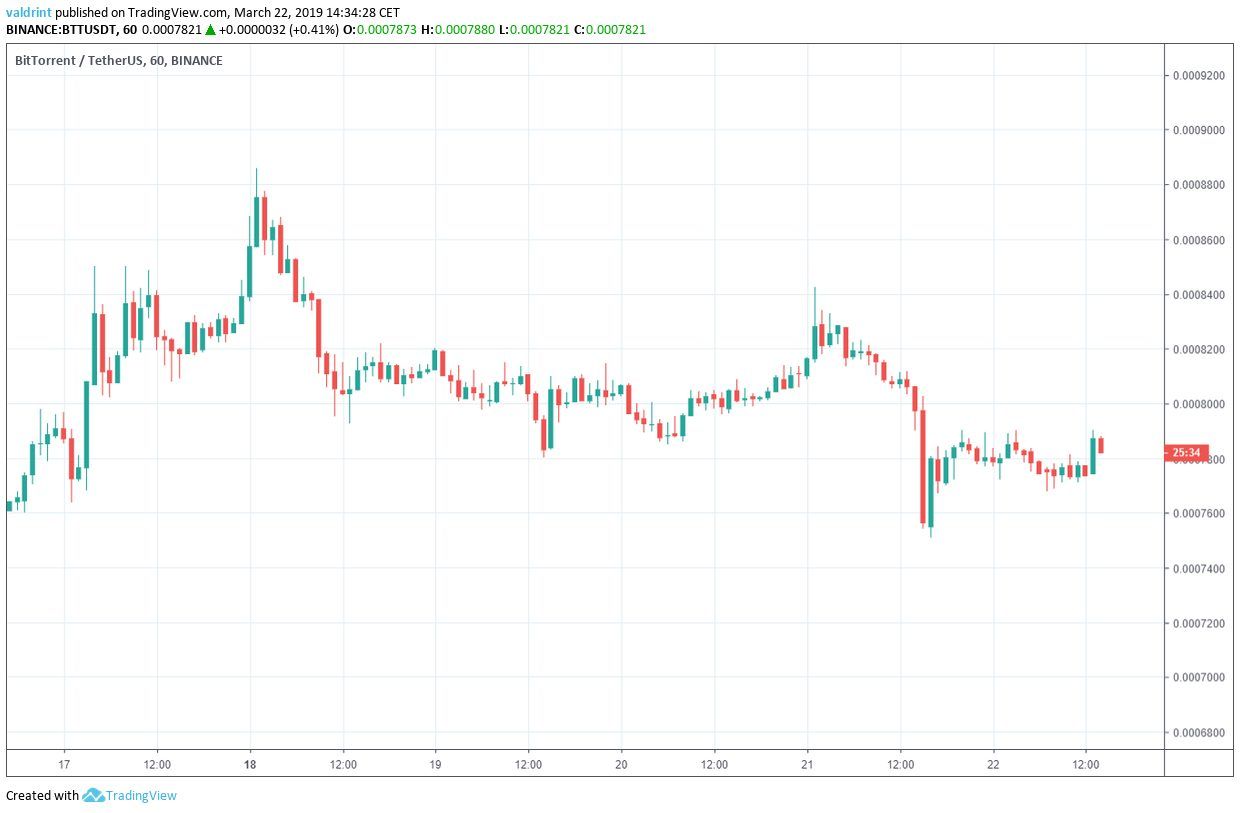
On March 18, 2019, the price of BitTorrent Token (BTT) reached a high of nearly $0.0009. A week earlier, a monthly airdrop of 990 billion tokens was airdropped to BTT holders and price reached a similar high.
However, price subsequently dropped to a low of $0.000712 on the same day. At the time of writing, similar price drops have been seen following the Mar 18 high; however, the lows experienced since have been higher than the Mar 11 bottom.
Click Here To Learn More About BitTorrent Airdrops!
In our Mar 15 analysis of BitTorrent we predicted gradual price increases will continue. We also defined three possible levels that BTT might reach following a rise. The first was $0.00084 and the second was $0.0009. With a high of over $0.00088 reached on Mar 18, our prediction was validated.
Since reaching this level, BTT has fallen below $0.00084.
Based on today’s analysis, we believe that the price of BTT will increase slightly. However, it is now trading in a downward facing channel—which suggests that gradual price decreases are expected beyond this short-term movement toward resistance.
BitTorrent Token (BTT): Trends And Highlights for March 22.
- BitTorrent Token has been on a gradual downtrend since Mar 18.
- BTT is trading inside a descending channel.
- The MACD and SMAs have triggered a buy signal.
- There are resistance areas near $0.00084 and $0.0009.
- There is support near $0.00077 and $0.00074.
Tracing Support
The price of BitTorrent (BTT) on Binance is analyzed at one-hour intervals from Mar 16 to Mar 22.
The price reached a low of $0.000792 on Mar 18. Several completed market cycles have occurred since. As prices dipped, each low was lower than the preceding one. Tracing these lows gives us the descending support line.
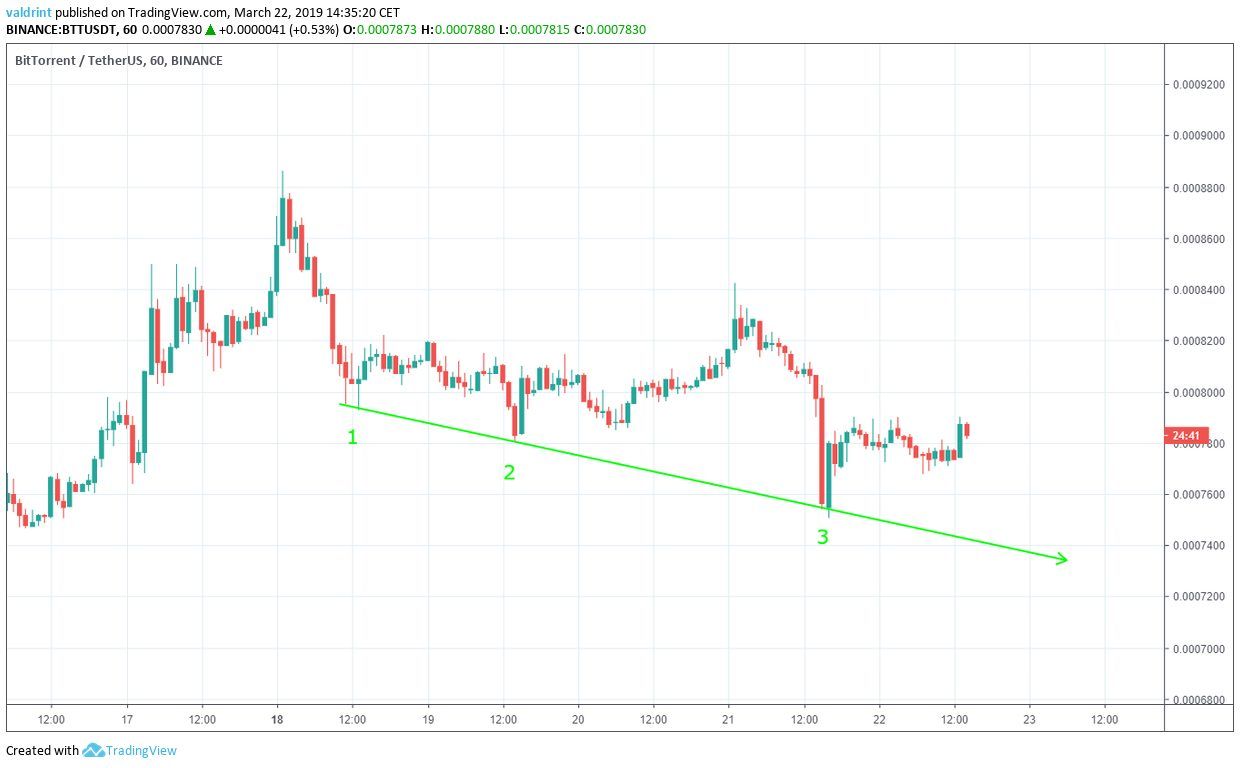
The support line can act as a floor to price. It predicts the lower limits of price over a period of time. It also predicts the general trend and projected rate of decline or growth for an asset.
BitTorrent’s price has decreased at the same rate as predicted by the descending support line.
When taken alone, this support line alone suggests continued price decreases; however, a more detailed analysis might point toward an alternative possibility.
Descending Channel
The price reached a high of $0.00088 on Mar 18. A sharp decrease ensued followed by a gradual increase. Price made another lower high of $0.000842 on Mar 21. Tracing these highs gives us a descending resistance line.
It is worth mentioning that the line has only been touched twice—which means that its validity may be questionable. If price reaches resistance again, a third point on the line might be added—increasing its overall validity.
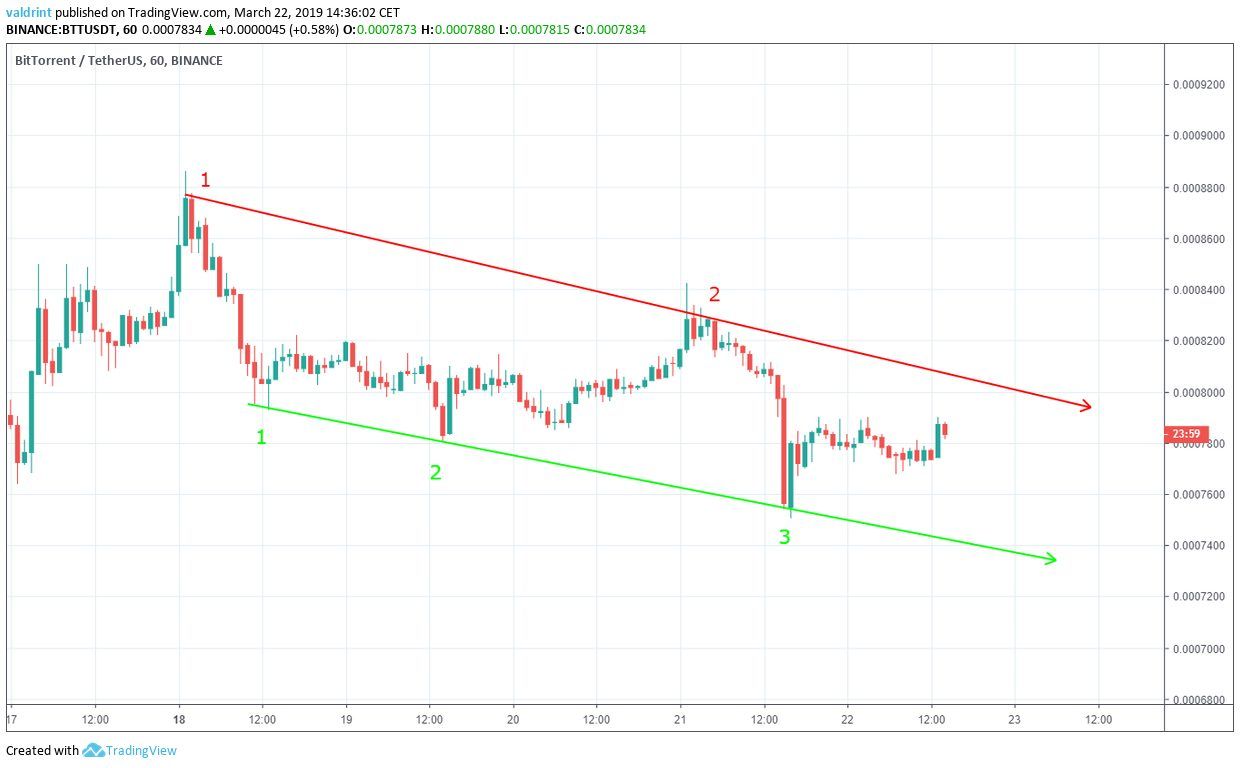
The resistance and support lines combine to create a descending channel, which is a neutral pattern, making price increases and decreases equally likely within the channel. However, the channel is downward facing which suggests continued price decreases.
This channel is more effective in predicting price fluctuations than resistance and support lines alone. It also offers confirmation that price may follow the downward trend of the support.
Based on this pattern, it is likely that the price keeps moving inside the confines of the channel until a decisive upward or downward move occurs.
Triggering The Signal
The moving average convergence divergence (MACD) is a trend indicator that shows the relationship between two moving averages (long and short-term) and the price. It is used to measure the strength of a move.
Combined with simple moving averages (SMA), MACD can be used as a trigger for buy and sell signals. Signals are triggered whenever the MACD line is above 0 and the price is above the 21 (red) and 50-period (green) SMAs.
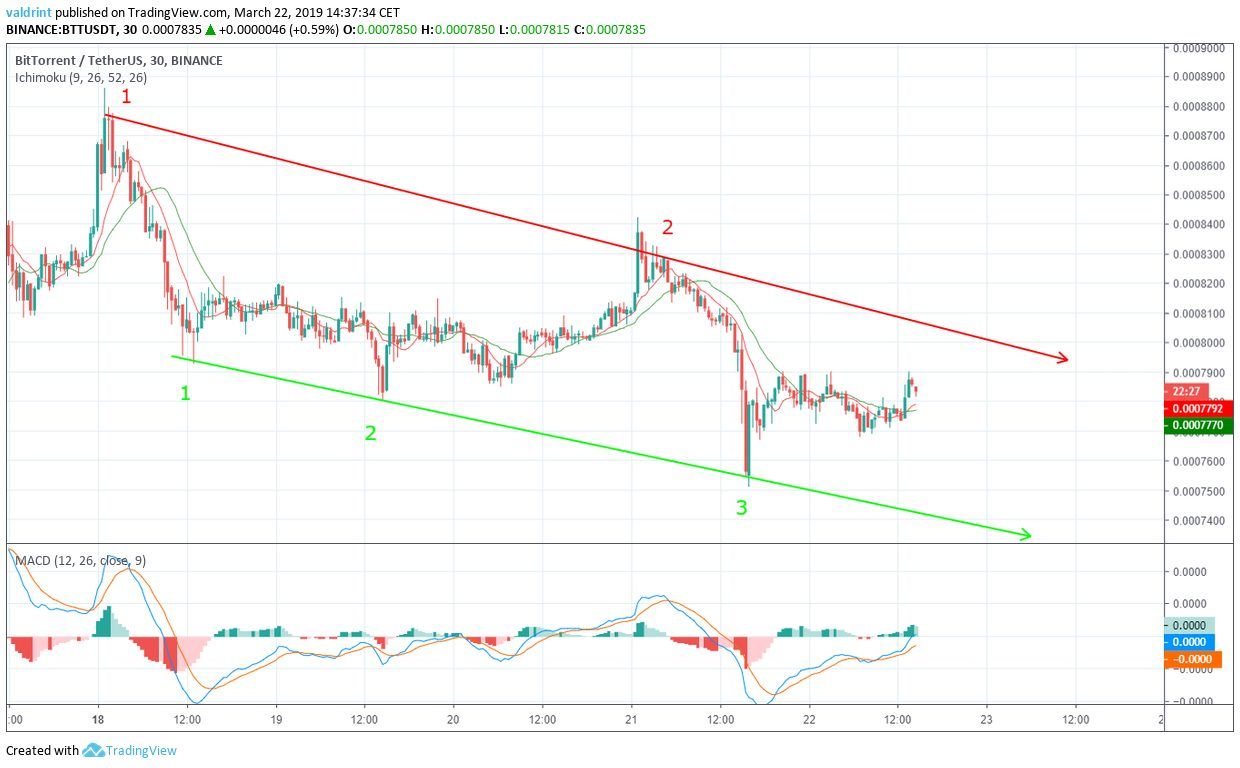
On Mar 21, the price validated the support line. Afterward, it started a gradual upward move which took it above the 20 and 40-period SMAs. During the same time, the MACD line crossed above 0.
This triggered a buy signal—indicating that the previous downtrend may be over. This further confirms the projected continued price increases into the near future. However, this projected upward movement would be invalidated by a price movement below the SMAs and the MACD line crossing below 0.
Using these indicators, it is likely that the price gradually increases toward the resistance line of the channel. It does not, however, signify an imminent breakout. Thus, while short-term prices might be experienced, gradual price decreases are still expected over a longer period.
Future Movement
In order to better visualize the possible reversal areas in case a breakout/breakdown occurs, the price of BTT on Binance is analyzed at two-hour intervals from Feb 18 to Mar 12.
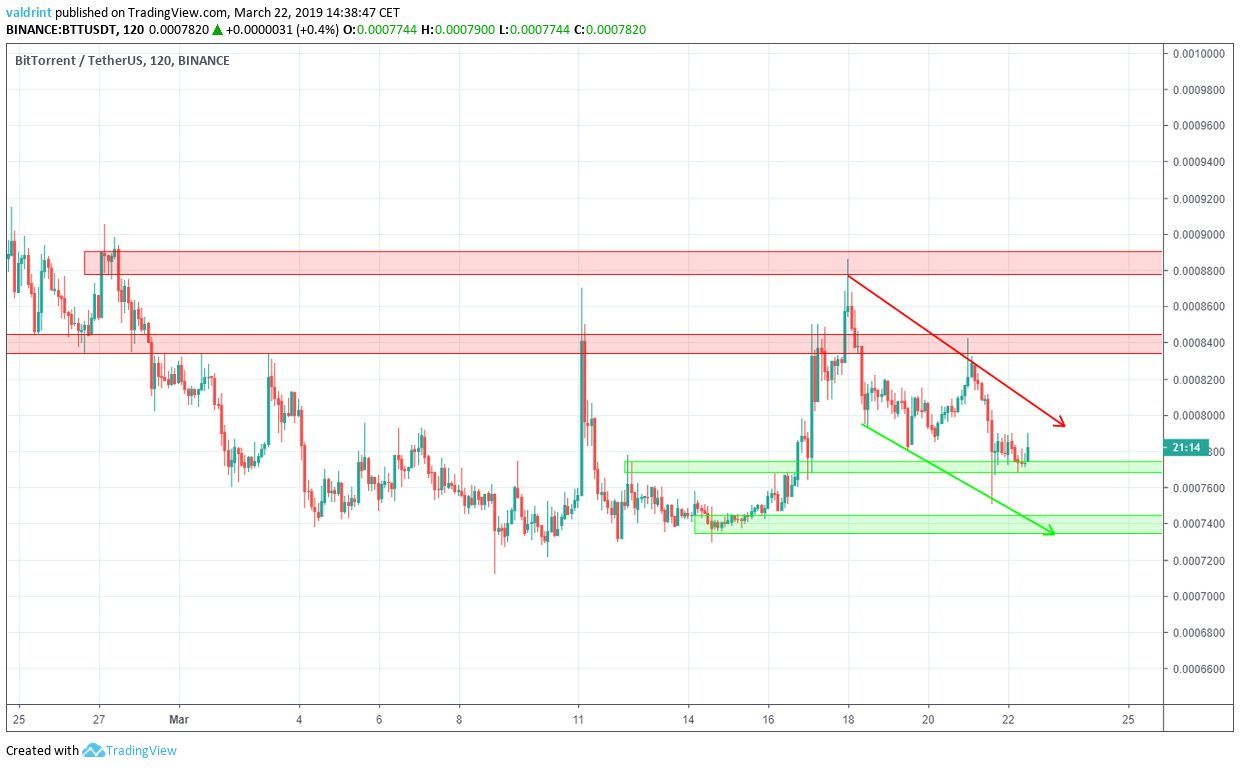
The closest support area is found near $0.00077, where the price is currently trading. The next support area is found near $0.00074, coinciding with the support line of the channel. Based on our analysis, it is not very likely that the price will reach the second support area.
The closest resistance areas are $0.00084 and $0.0009. If a breakout occurs, these would provide likely reversal areas. We believe that it is possible that the price will eventually reach these areas.
Summary of Analysis
Based on this analysis, it is likely that the price moves toward the resistance line of the channel. if the price touches the line, this prediction will be partially validated. If it breaks out and reaches the first resistance area, it will be fully validated. A breakdown below support would invalidate the pattern.
Do you think the price of BTT will eventually break out from the channel? Let us know your thoughts in the comments below.
Disclaimer: This article is not trading advice and should not be construed as such. Always consult a trained financial professional before investing in cryptocurrencies, as the market is particularly volatile.
