


The Bitcoin dominance rate (BTCD) is showing strong signs of a bullish trend reversal, but has yet to clear a crucial resistance area.
Until it is successful in doing so, it is not practical to consider the trend as bullish.
BTCD breaks out
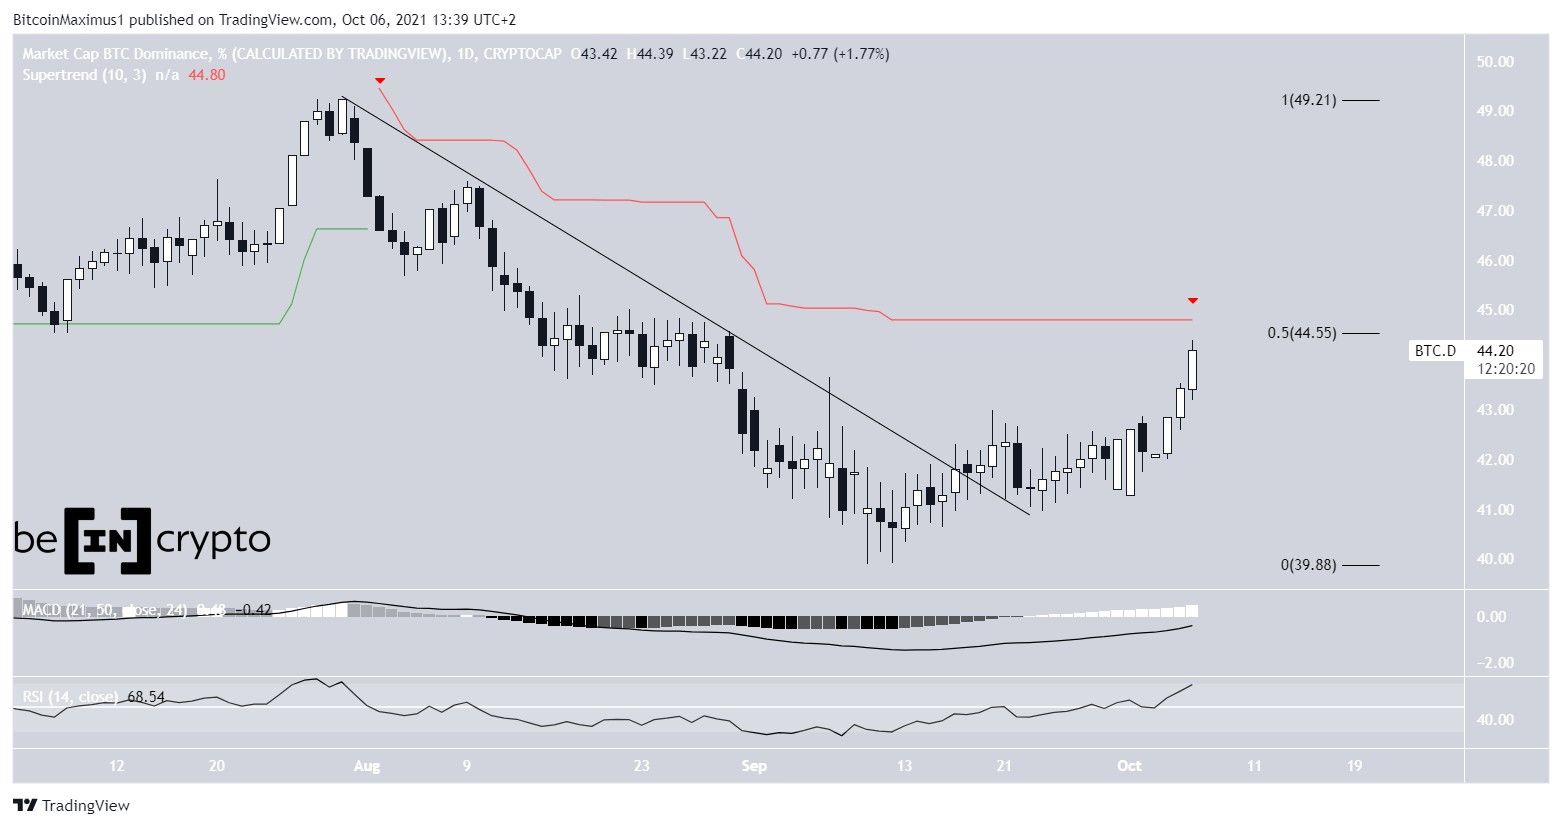
BTCD had been decreasing alongside a descending resistance line since July 30 (red icon).
On Sept 18, it managed to break out, indicating that the downward movement had now ended.
Both the price action and readings from technical indicators are bullish.
The MACD, which is created by a combination of short- and long-term moving averages (MA), has been moving upwards, and its histogram is positive. This means that the speed of the short-term trend has surpassed the long-term one. However, the fact that it is not yet positive means that the short-term MA has not moved above the long-term MA.
Similarly, the RSI, which is a momentum indicator, has moved above 50. This is often a sign that the trend is bullish, while the opposite is true when the RSI is below 50.
The previous time the RSI moved below 50 was on July 31, when the decrease alongside the descending resistance line began.
In order for the trend to be confirmed as bullish, BTCD has to move above the 44.50% area. This is the 0.5 Fib retracement resistance level and coincides with the Supertrend resistance line (red line). A movement above the line would go a long way in confirming that the trend is bullish.
Short-term movement
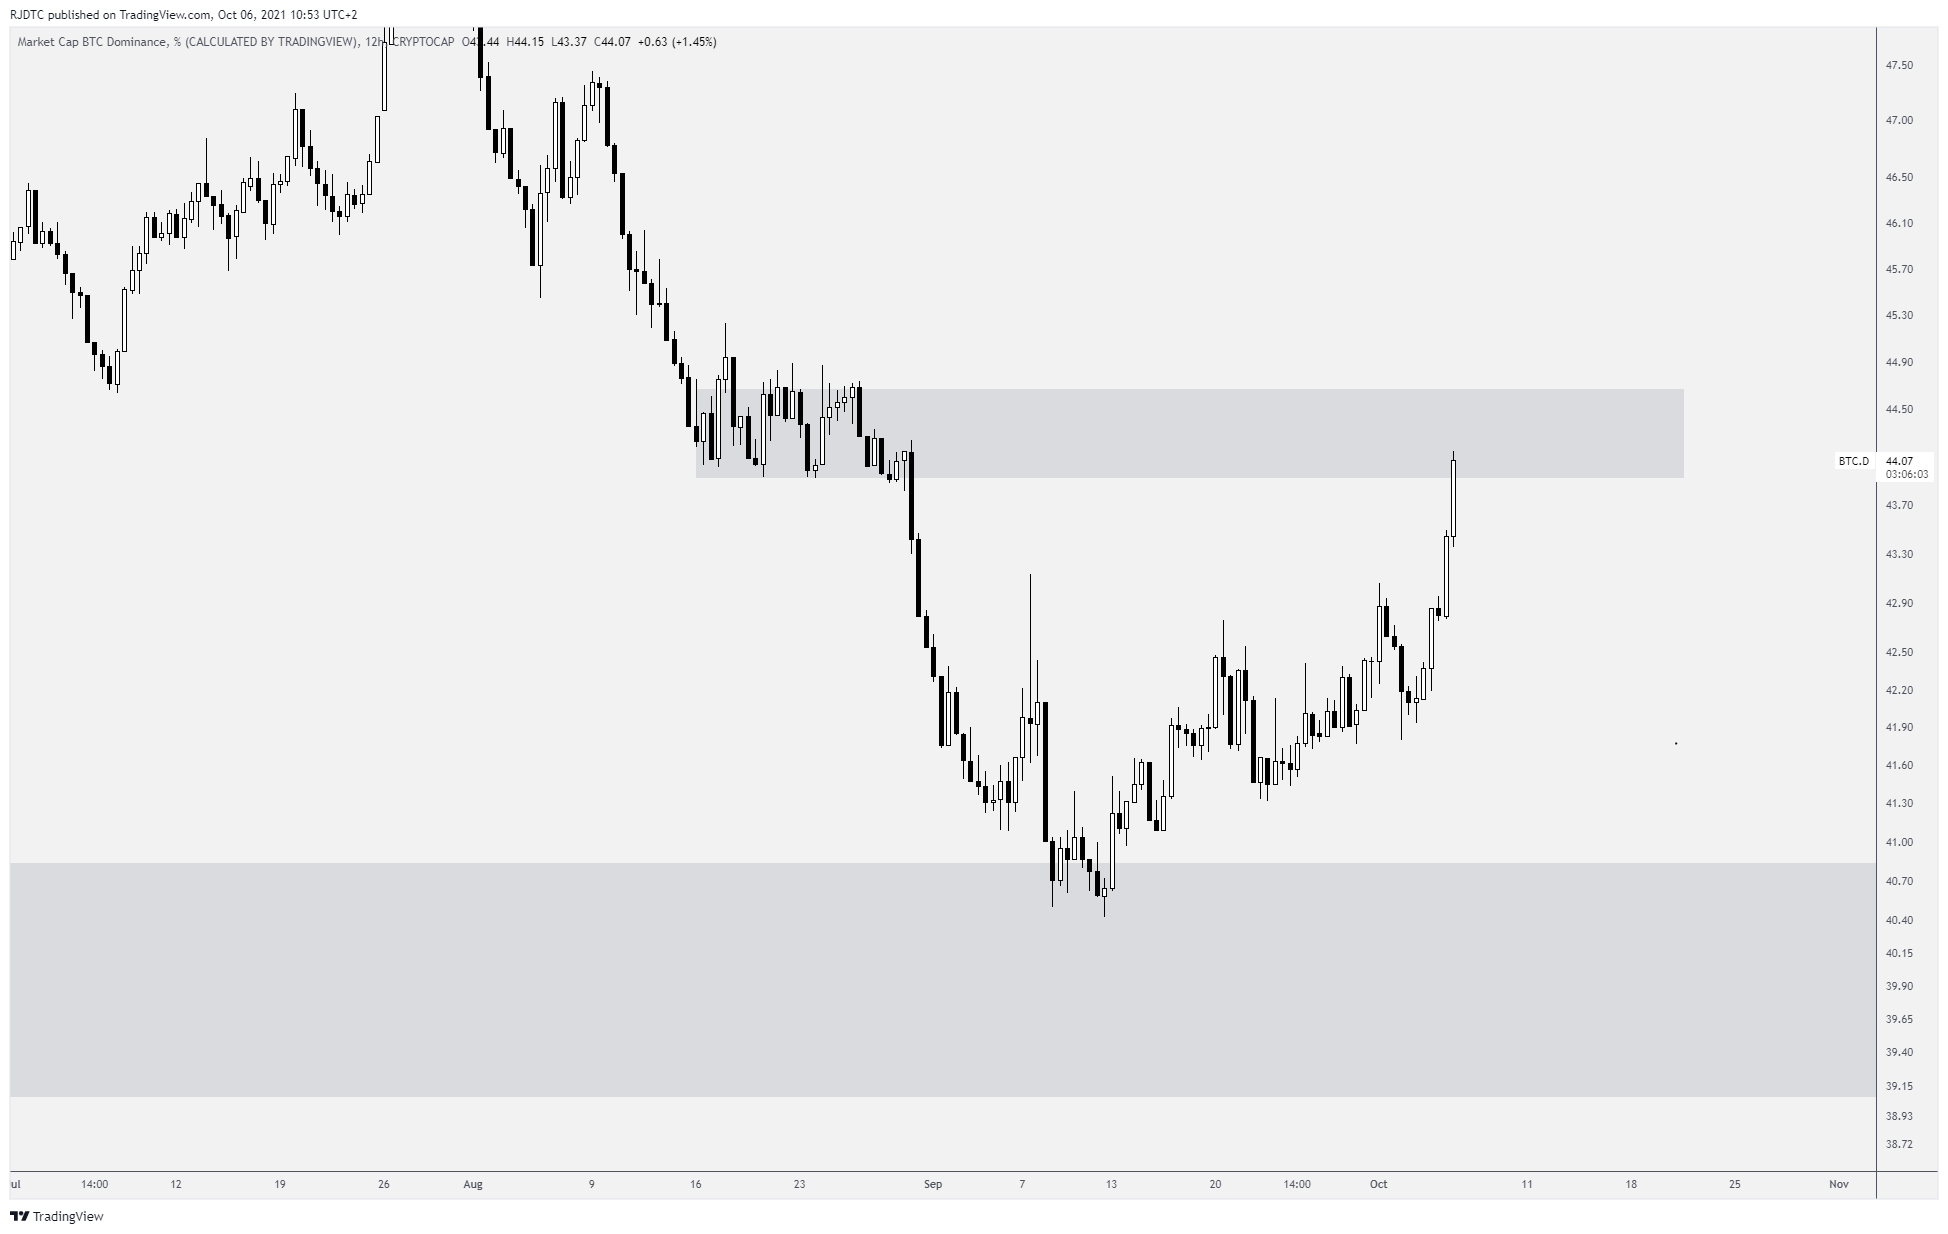
Cryptocurrency trader @DTCcryptotrades tweeted a BTCD chart, stating that the 44.50% resistance area has been reached.
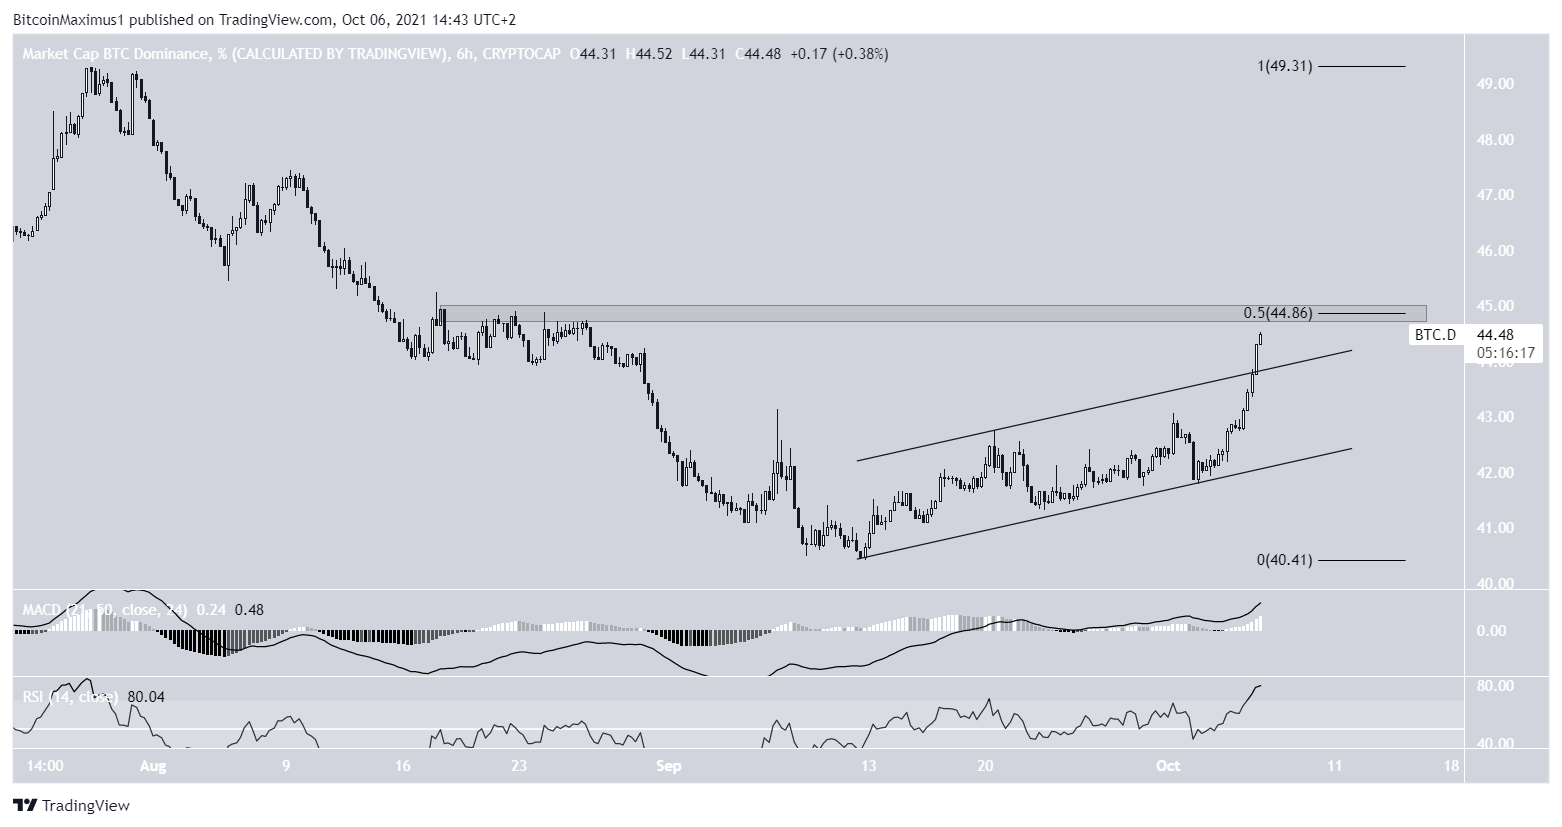
The shorter-term six-hour chart also provides bullish signs. It shows that BTCD has broken out from an ascending parallel channel. This is a sign of an impulsive movement, meaning that the current trend is bullish.
Also, the MACD and RSI provide a similar bullish reading like the daily time-frame, with the exception being that the MACD is positive, meaning that the bullish trend is more potent.
However, the 44.85% area is also the 0.5 Fib retracement resistance level, increasing its significance.
Therefore, whether BTCD breaks out or gets rejected from the 44.85% resistance area is crucial for determining the future trend.
For BeInCrypto’s previous Bitcoin (BTC) analysis, click here.
What do you think about this subject? Write to us and tell us!


