ETH and XRP are following descending resistance lines.
COMP and MKR have broken out from descending resistance lines.
promo
Bitcoin (BTC) has been increasing since rebounding from the $31,400 horizontal support area while Ethereum (ETH) has reclaimed the $2,000 support area and began an upward movement.XRP (XRP) is trading inside a descending channel and following a descending resistance line.
Zcash (ZEC) has created a double bottom pattern but is still following a descending resistance line.
Compound (COMP) and Maker (MKR) have broken out from descending resistance lines.
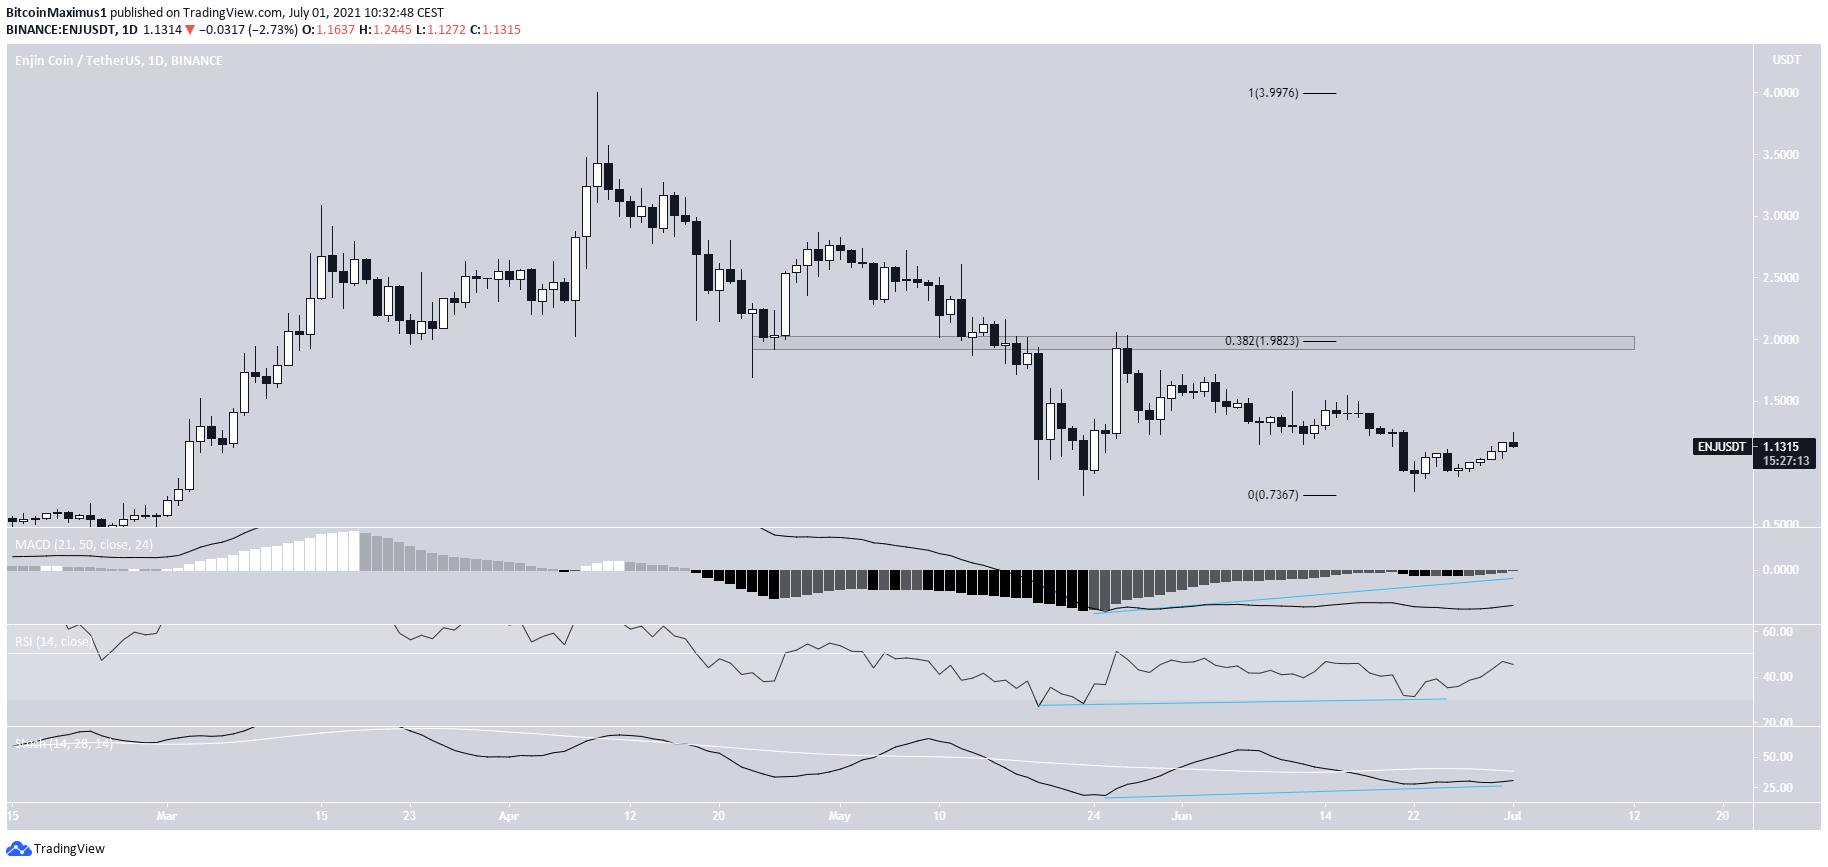
Enjin Coin (ENJ) has created a double bottom pattern and is aiming to increase towards the closest resistance at $1.98.
BTC
BTC has been increasing since reaching a low of $28,805 on June 22. The upward movement was preceded by a significant bullish divergence in the MACD, RSI, and Stochastic oscillator. However, none of these indicators have turned bullish.
BTC reached a local high of $36,600 on June 29 and began a downward movement.
The main support and resistance levels are at $31,400 and $40,500.
BTC Chart By TradingView
ETH
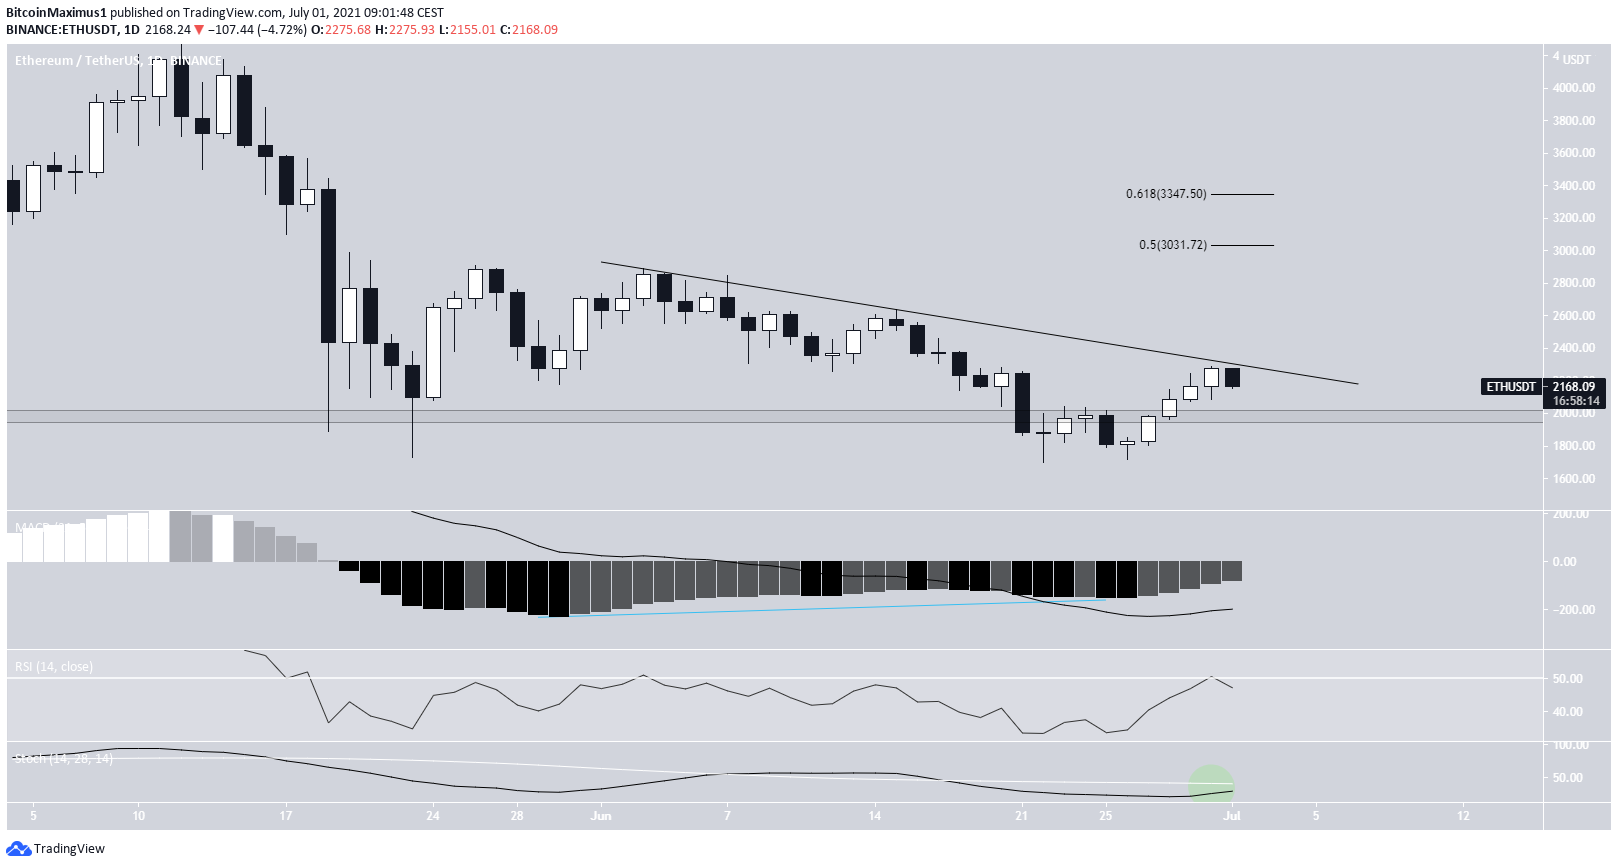
On June 22, ETH reached a low of $1,700, briefly falling below the $2,000 horizontal support area. However, it began an upward movement shortly afterwards and has reclaimed the level since.
The upward movement was preceded by bullish divergence in the MACD.
While indicators are showing bullish signs, they have yet to confirm a bullish reversal. The RSI is still below 50 and the Stochastic oscillator has not made a bullish cross, though it’s very close to doing so.
In addition to this, ETH is still following a descending resistance line. If it breaks out, the closest resistance levels would be between $3,031-$3,350, the 0.5-0.618 Fib retracement levels.
ETH Chart By TradingView
XRP
Since April 14, XRP has been trading inside a descending parallel channel. On June 22, it bounced after reaching the support line of the channel (green icon).
While it has been increasing since then, it’s still trading under a descending resistance line.
A breakout from the line and subsequent reclamation of the $0.80 resistance area is required in order for the trend to be considered bullish.
Similar to ETH, there are some bullish reversal signs in place, but not enough to confirm a bullish reversal. A bullish cross in the Stochastic oscillator (green icon) would go a long way in confirming the bullish trend reversal.
XRP Chart By TradingView
ZEC
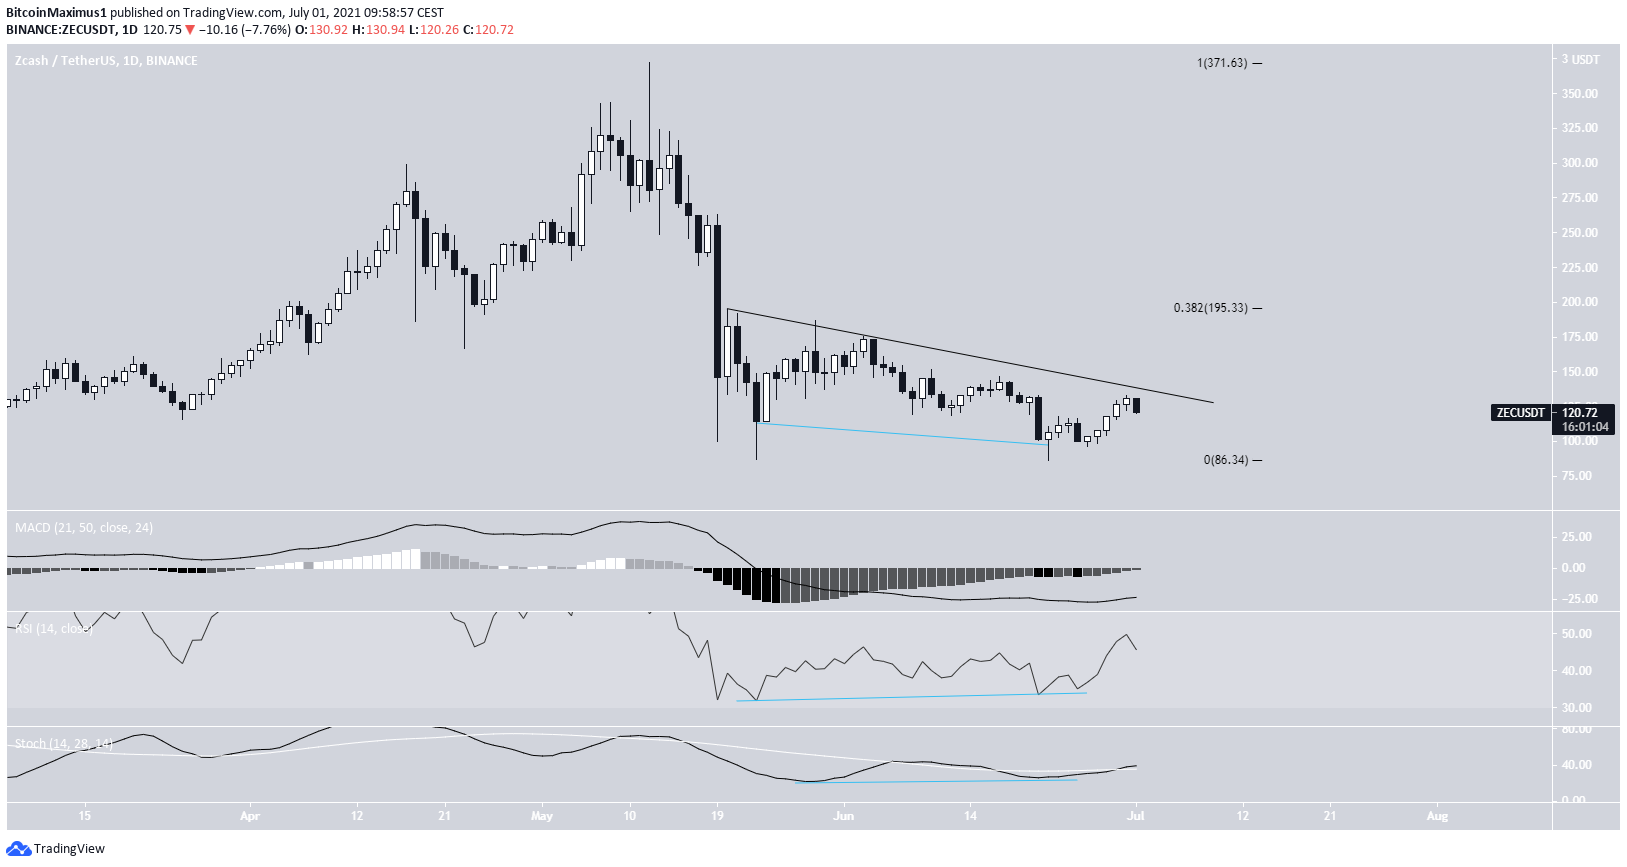
On May 23, ZEC reached a low of $87.08. After bouncing, it returned to the same level on June 22. This appears to have created a double bottom pattern.
The pattern was combined with bullish divergences in both the RSI and Stochastic oscillator. Since then, ZEC has been moving upwards. In addition, the MACD has nearly crossed into positive territory.
However, ZEC has yet to move above a descending resistance line that’s been in place since May 17.
If it breaks out, the closest resistance would be found at $195.
ZEC Chart By TradingView
COMP
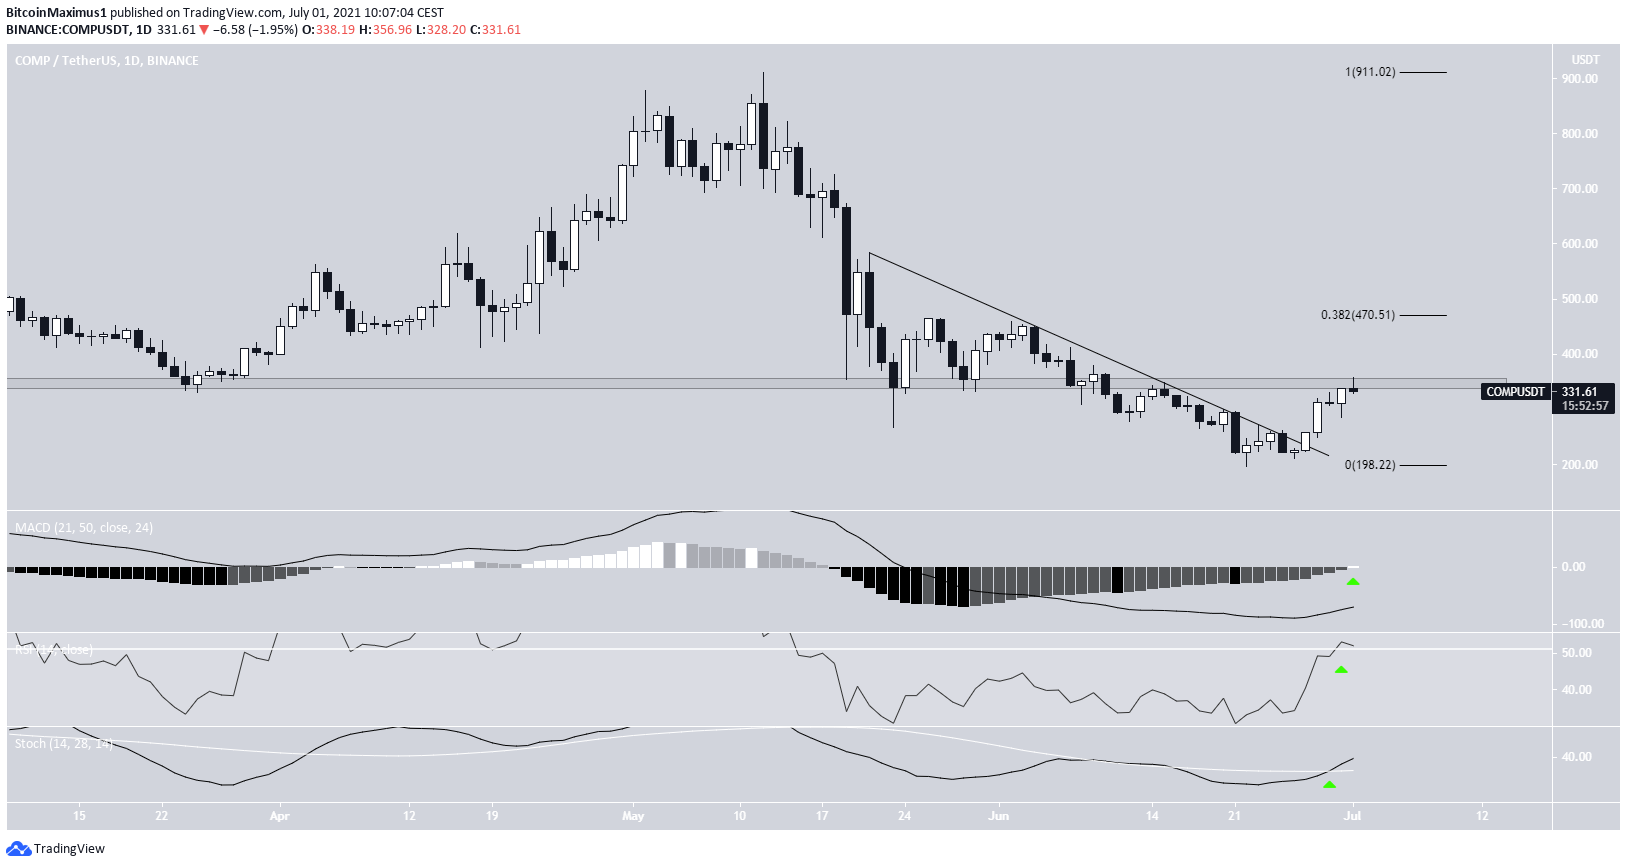
COMP has been following a descending resistance line since May 21. On June 27, it broke out from the line.
Technical indicators are showing several bullish signs. The Stochastic oscillator has made a bullish cross (green icon) and the MACD histogram has crossed into positive territory.
However, COMP is still facing strong resistance from the $350 horizontal area, which had previously acted as support. Until it reclaims this level, the trend cannot be considered bullish.
If it’s successful, the next resistance area would likely be found at $470.
COMP Chart By TradingView
MKR
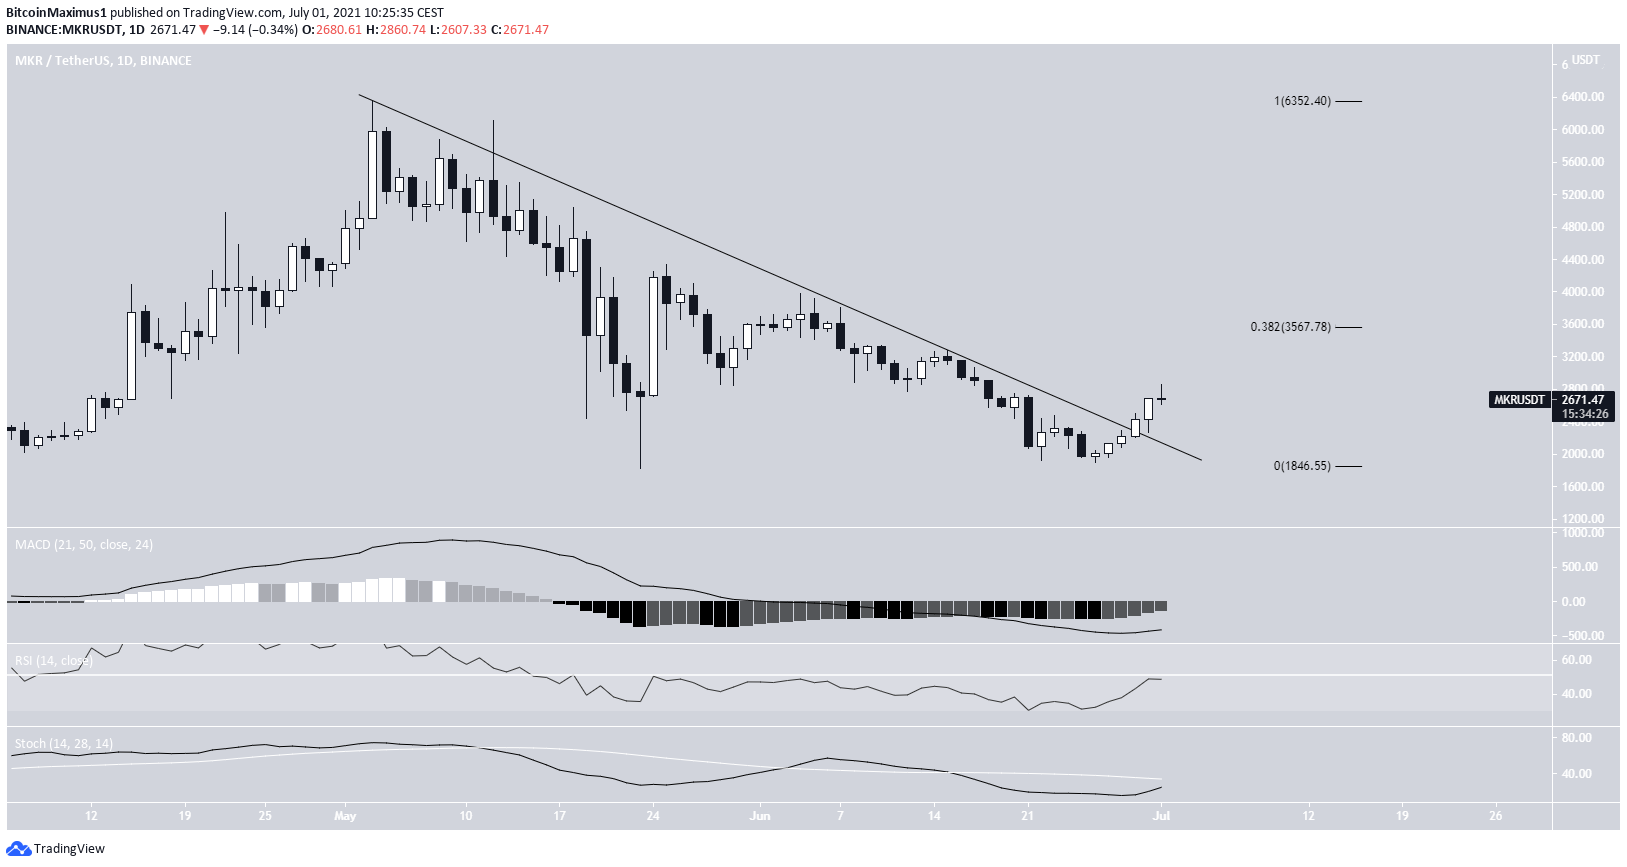
On May 23, MKR reached a low of $1,829. After a strong bounce, it returned to the same level on June 22, creating a double bottom pattern.
It has been moving upwards since, and broke out from a descending resistance line on June 29.
Technical indicators are showing some bullish signs but have yet to confirm a bullish trend.
The closest resistance is at $3,567, the 0.382 Fib retracement resistance level.
MKR Chart By TradingView
ENJ
On May 23 and June 22, ENJ created a double bottom pattern near $0.75. The pattern was combined with bullish divergences in the RSI, MACD, and Stochastic oscillator.
ENJ has been moving upwards since.
The closest resistance area is found at $1.98. This is a horizontal resistance and also the 0.382 Fib retracement resistance level.
ENJ Chart By TradingViewFor BeInCrypto’s latest bitcoin (BTC) analysis, click here.
In line with the Trust Project guidelines, this price analysis article is for informational purposes only and should not be considered financial or investment advice. BeInCrypto is committed to accurate, unbiased reporting, but market conditions are subject to change without notice. Always conduct your own research and consult with a professional before making any financial decisions. Please note that our Terms and Conditions, Privacy Policy, and Disclaimers have been updated.
Valdrin discovered cryptocurrencies while he was getting his MSc in Financial Markets from the Barcelona School of Economics. Shortly after graduating, he began writing for several different cryptocurrency related websites as a freelancer before eventually taking on the role of BeInCrypto's Senior Analyst.
(I do not have a discord and will not contact you first there. Beware of scammers)