Bitcoin (BTC) has created a higher low after bouncing at the $30,000 support area. Ethereum (ETH) is approaching the 0.5-0.618 Fib retracement resistance area.
XRP (XRP) is trading inside a long-term descending parallel channel.
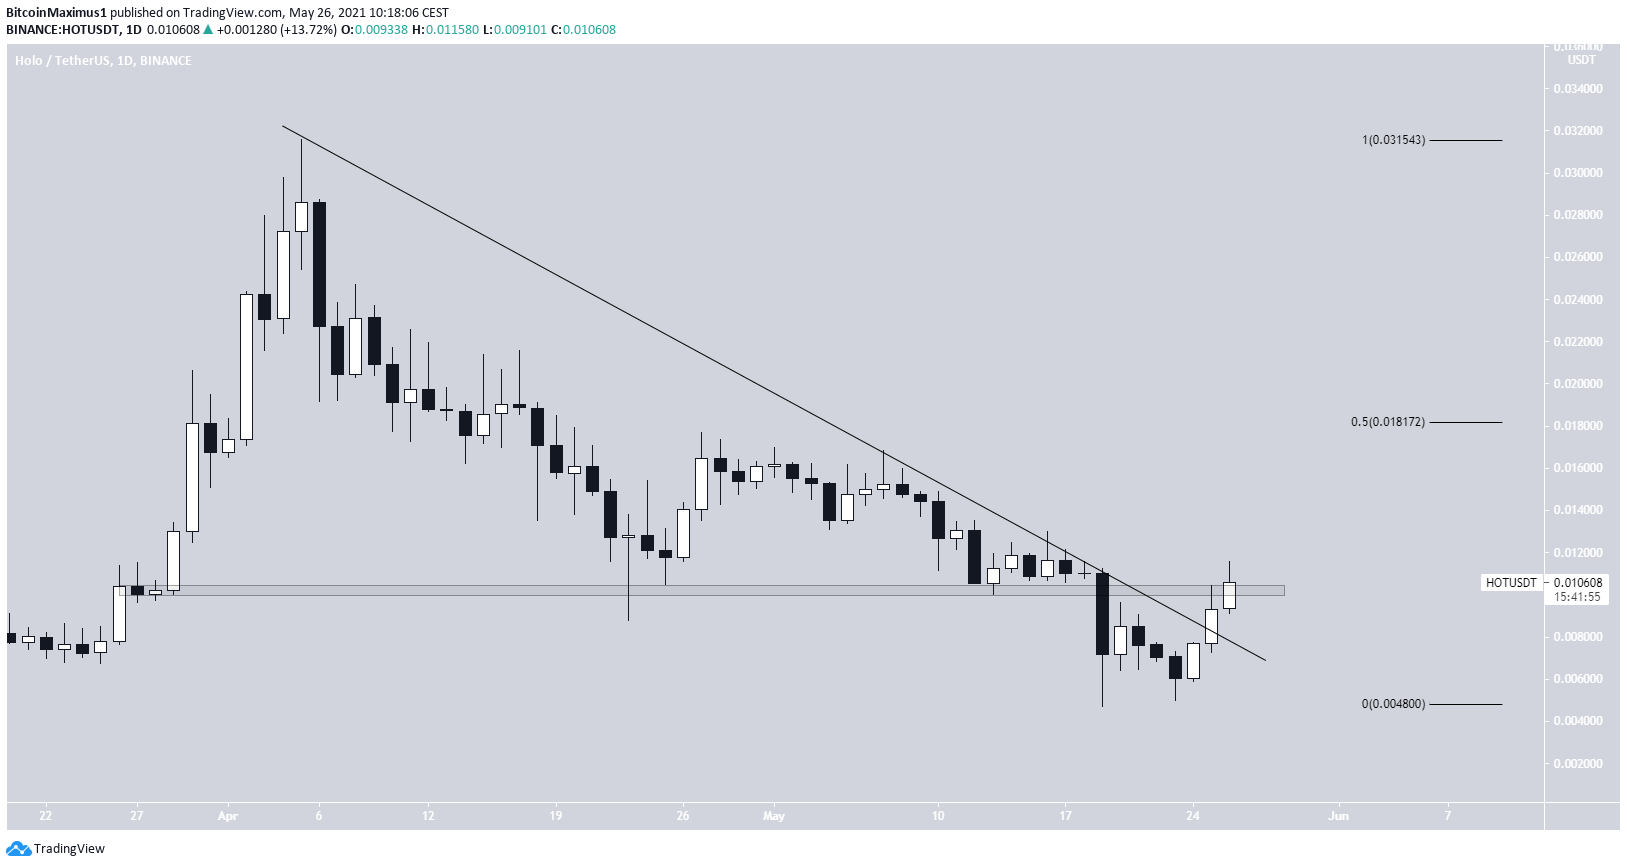
Monero (XMR) is following a descending resistance line while Holo (HOT) has just broken out from one.
Aave (AAVE) has bounced at the $300 support area.
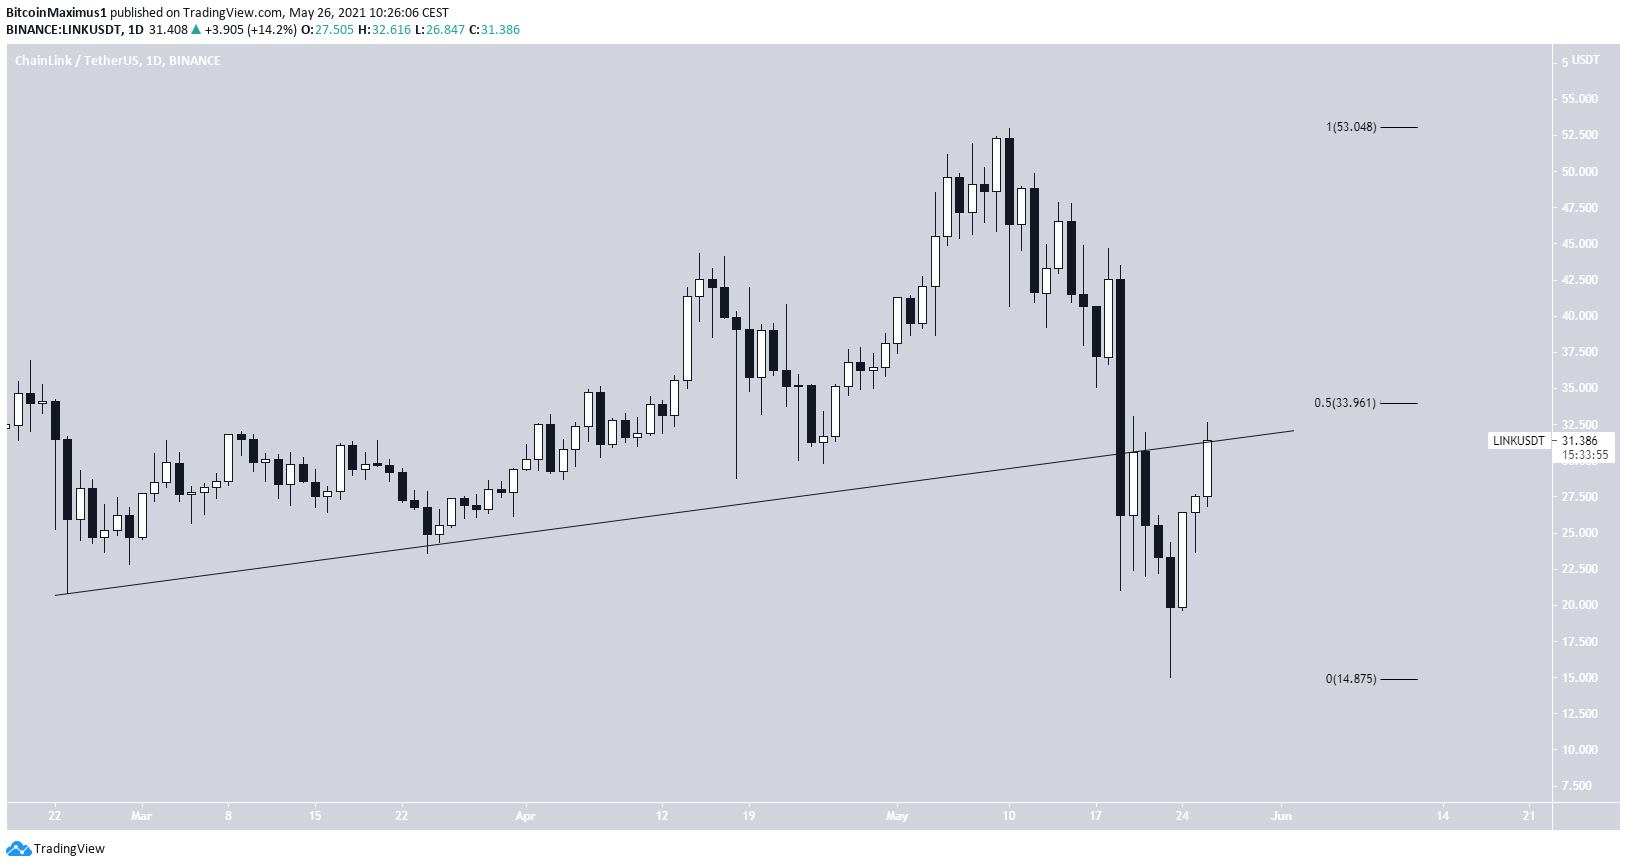
Chainlink (LINK) has broken down from an ascending support line.
BTC
BTC bounced on May 19, after reaching a local low of $30,000. It created a higher low on May 23, and a bullish engulfing candlestick the next day.
Technical indicators are showing some bullish signs. The MACD has generated two successive higher momentum bars and is in the process of creating a third. A bullish candlestick close would be a further bullish reversal signal.
The RSI has crossed above 30 after generating a bullish divergence.
Finally, the Stochastic oscillator is moving upwards but has yet to make a bullish cross.
The closest resistance levels are found at $41,200 and $48,170. These targets are the 0.382 and 0.618 Fib retracement resistance levels.
BTC Chart By TradingView
ETH
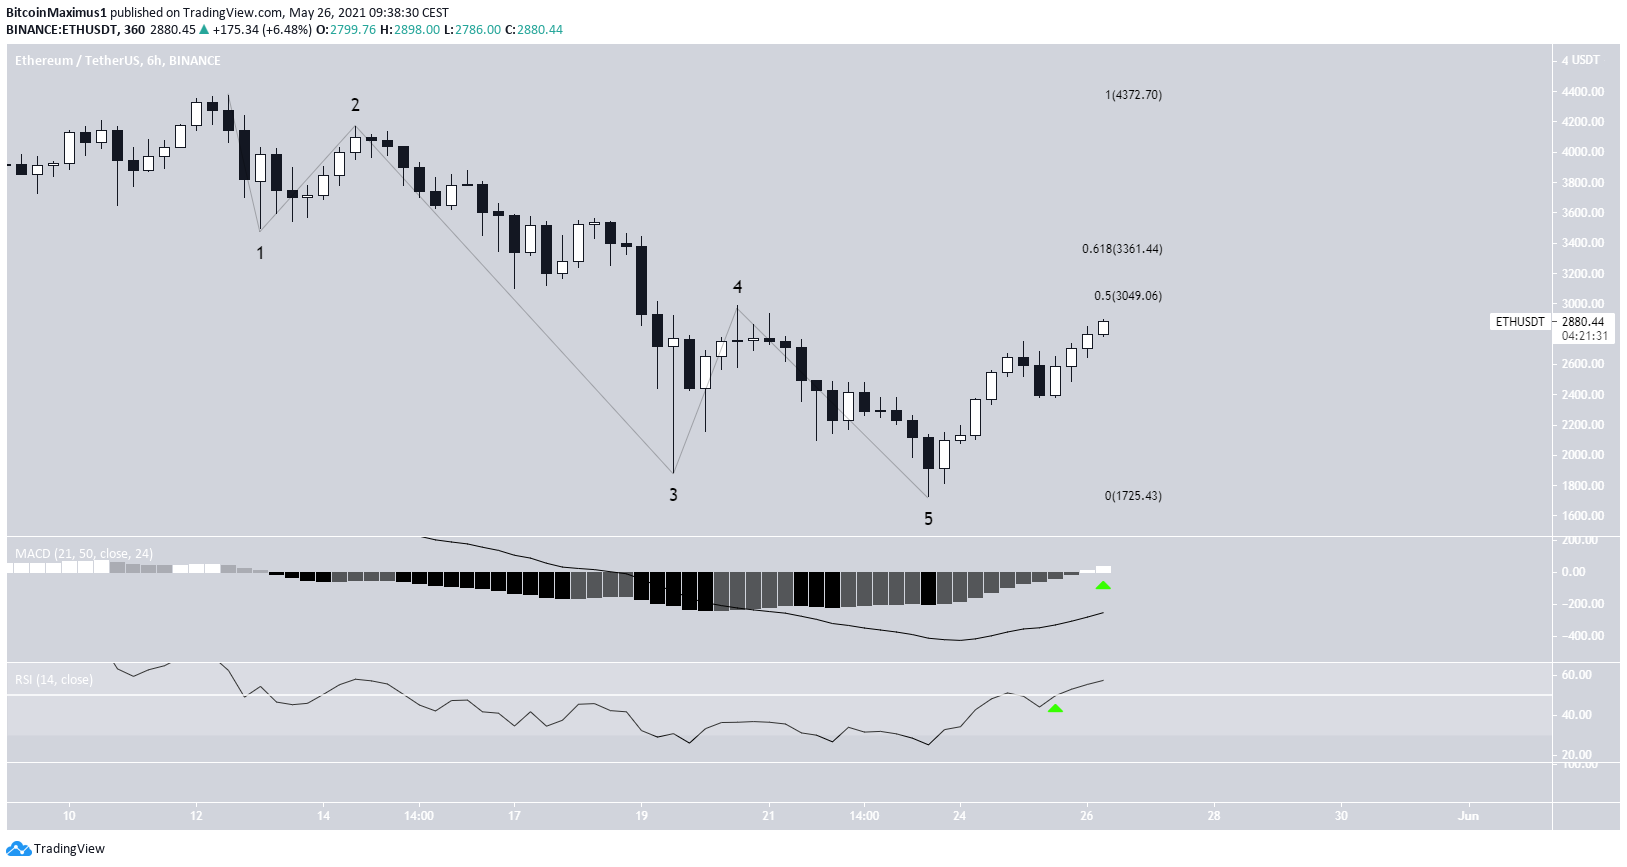
ETH reached an all-time high price of $4,372 on May 12 but decreased sharply after. It culminated with a low of $1,728 on May 23. The downward movement looks to a completed bearish impulse.
So, there is a possibility that the current upward movement is the A wave of an A-B-C corrective structure.
The closest resistance levels are found between $3,050 and $3,360 — the 0.5-0.618 Fib retracement support levels.
Both the short-term MACD and RSI have turned bullish. The latter has just crossed above 50 (green icon).
ETH Chart By TradingView
XRP
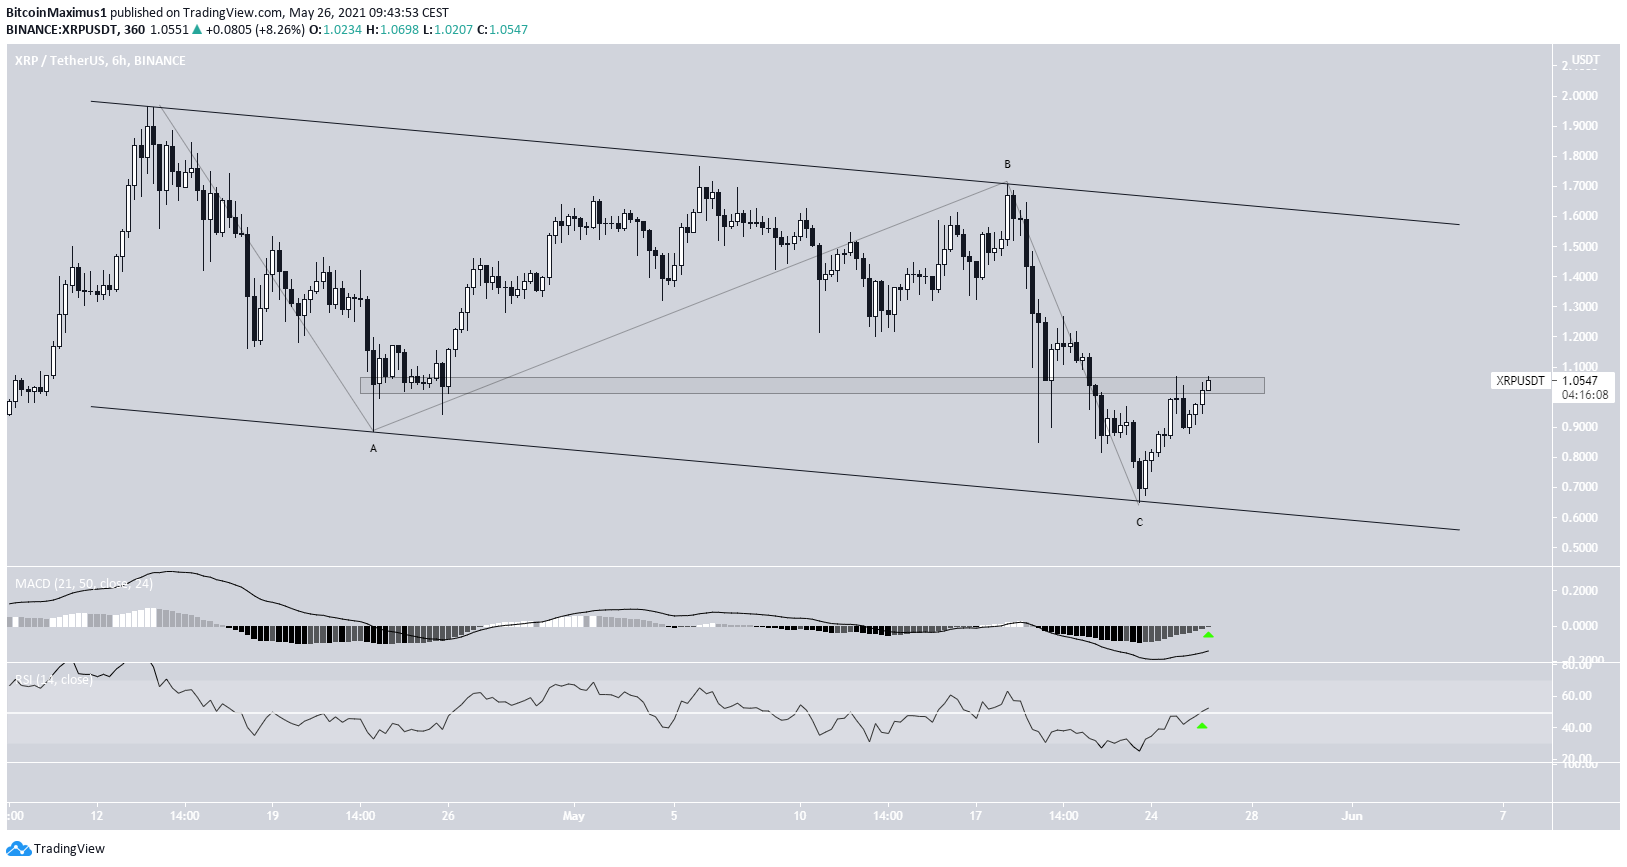
XRP has been trading inside a large descending parallel channel since April 14. Such channels usually contain corrective structures. XRP bounced at the support line of the channel on May 23 and has been increasing since.
The length of the movements inside the channel is another factor that indicates that this is a corrective structure. Waves A:C have an exact 1:1 ratio, very common in A-B-C corrections.
The MACD and RSI are turning bullish and the latter has just crossed above 50.
However, it’s crucial that XRP reclaims the $1.06 area in order to consider the trend bullish.
The area previously acted as support and is now expected to act as resistance.
XRP Chart By TradingView
XMR
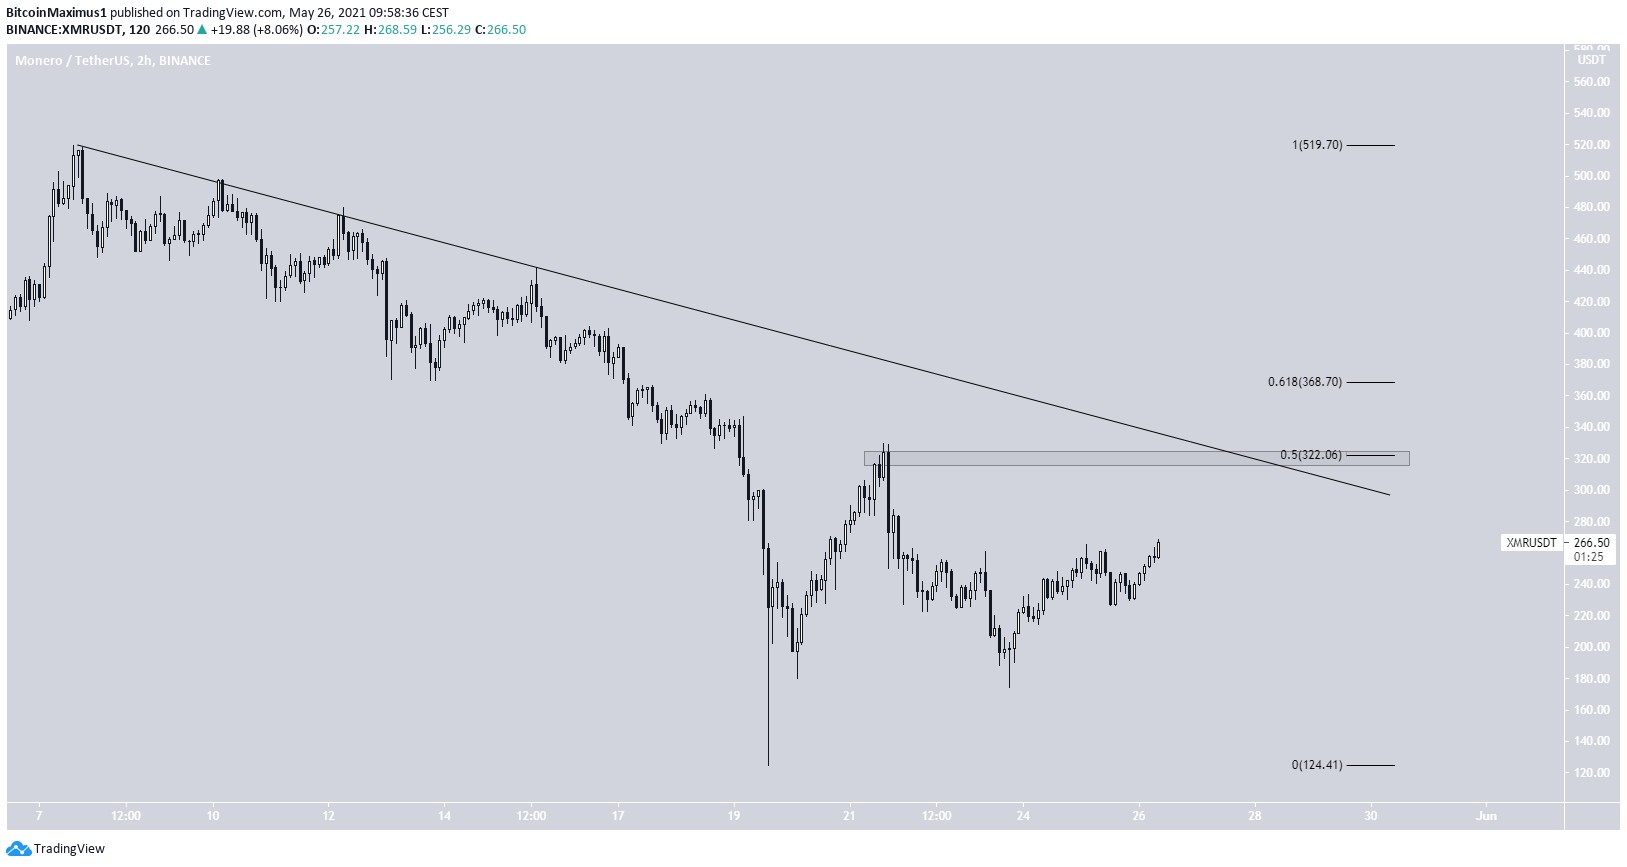
XMR has been decreasing since May 7 after reaching an all-time high price of $518. The decrease has been sharp, looking similar to that of ETH. It culminated with a low of $124.69 on May 19.
XMR has been moving upwards since its fall but was rejected by the 0.5 Fib retracement resistance level at $322. Currently, the level also coincides with a descending resistance line drawn from the aforementioned all-time high.
The next resistance is found at $368.
XMR Chart By TradingView
AAVE
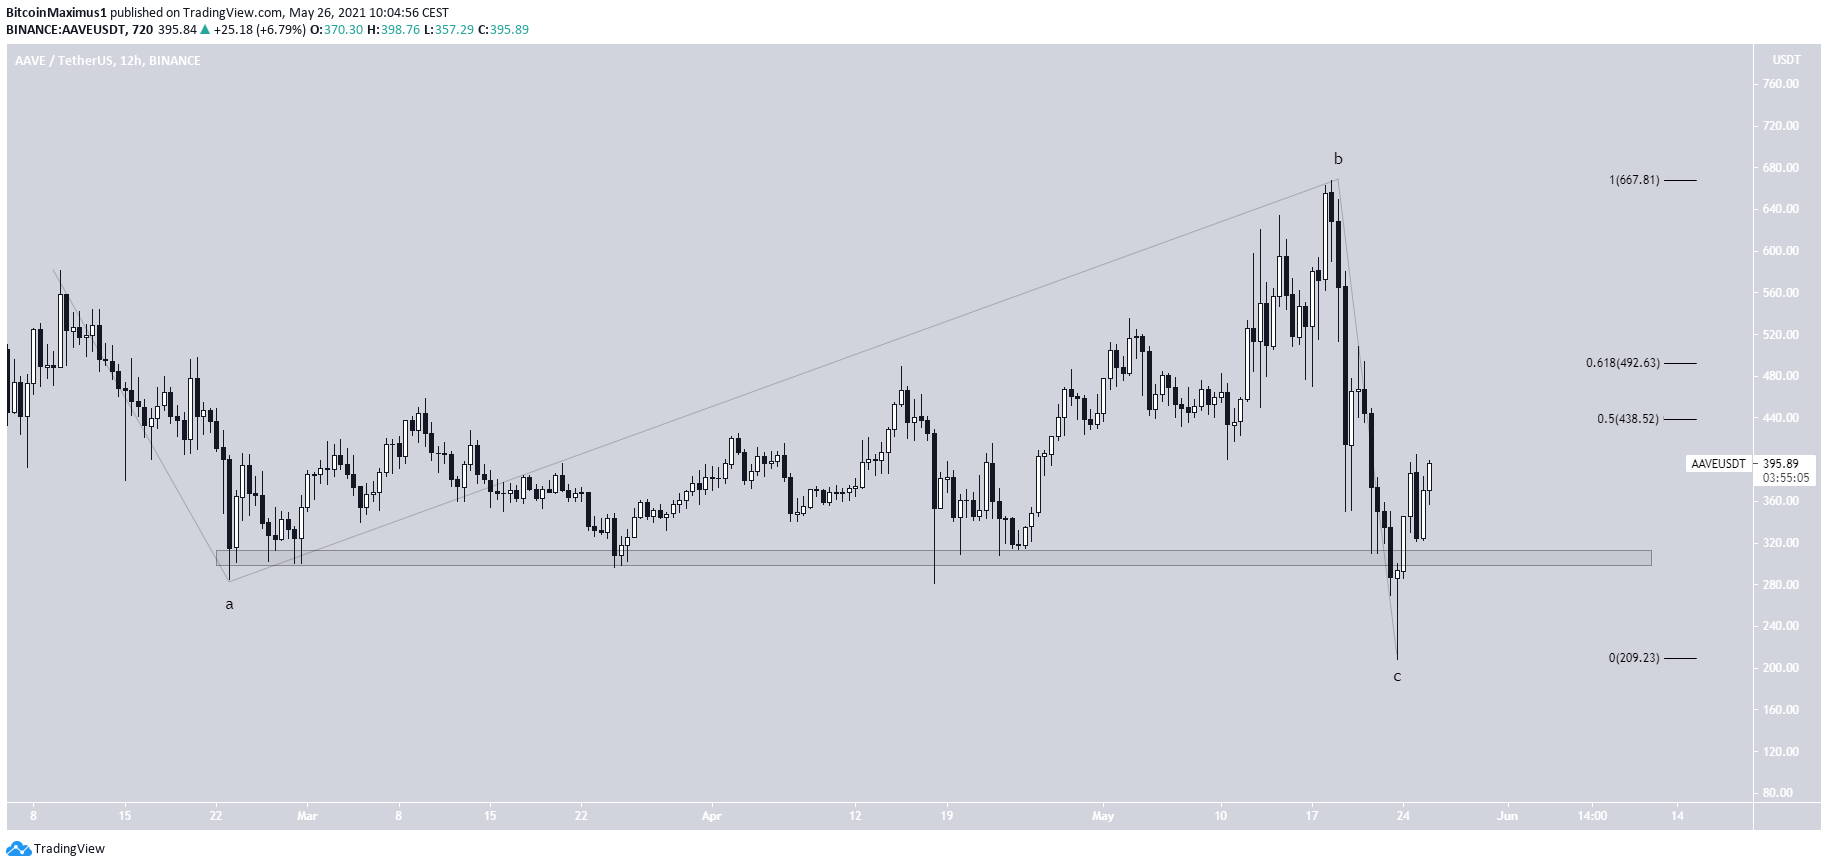
AAVE has been decreasing since May 18, when it reached an all-time high price of $668. The decrease has been sharp, culminating with a low of $208 on May 23. This amounted to a decrease of 69% relative to the all-time high.
Nevertheless, the entire movement since the beginning of February looks like an irregular flat correction. This is because the upward movement from Feb. 16 (highlighted) looks corrective instead of impulsive.
If this is true, then AAVE has likely begun a new bullish impulse.
The main resistance levels are found at $438 and $492 (0.5 and 0.618 Fib retracement resistance levels).
AAVE Chart By TradingView
HOT
HOT had been following a descending resistance line after April 5, when it reached an all-time high price of $0.0316.
It managed to break out on May 25 and is currently in the process of reclaiming the $0.01 area.
If it manages to do so, the next resistance would be found at $0.0181. This target is the 0.5 Fib retracement level of the entire downward movement.
HOT Chart By TradingView
LINK
LINK had been following an ascending support line since Feb. 23. While doing so, it proceeded to reach a new all-time high price of $53 on May 10.
However, a sharp decrease followed, leading to a low of $15 on May 23. Since then, LINK has been moving upwards.
It’s reached a confluence of resistance levels created by the previous ascending support line and the 0.5 Fib resistance level at $33.96. The support line is now expected to act as resistance.
Until LINK is successful in reclaiming both of these levels, we cannot consider the trend bullish.
LINK Chart By TradingViewFor BeInCrypto’s latest bitcoin (BTC) analysis, click here.
In line with the Trust Project guidelines, this price analysis article is for informational purposes only and should not be considered financial or investment advice. BeInCrypto is committed to accurate, unbiased reporting, but market conditions are subject to change without notice. Always conduct your own research and consult with a professional before making any financial decisions. Please note that our Terms and Conditions, Privacy Policy, and Disclaimers have been updated.
Valdrin discovered cryptocurrencies while he was getting his MSc in Financial Markets from the Barcelona School of Economics. Shortly after graduating, he began writing for several different cryptocurrency related websites as a freelancer before eventually taking on the role of BeInCrypto's Senior Analyst.
(I do not have a discord and will not contact you first there. Beware of scammers)