


Bitcoin (BTC) has been moving upwards since bouncing at the $30,000 support area on May 19.
On May 24, it broke out from a short-term descending resistance line. It’s currently approaching the first important resistance area found at $41,200.
BTC bounces back
BTC has been increasing since May 19, when it reached a local low of $30,000. On May 23, it created a higher low and followed it up with a bullish engulfing candlestick.
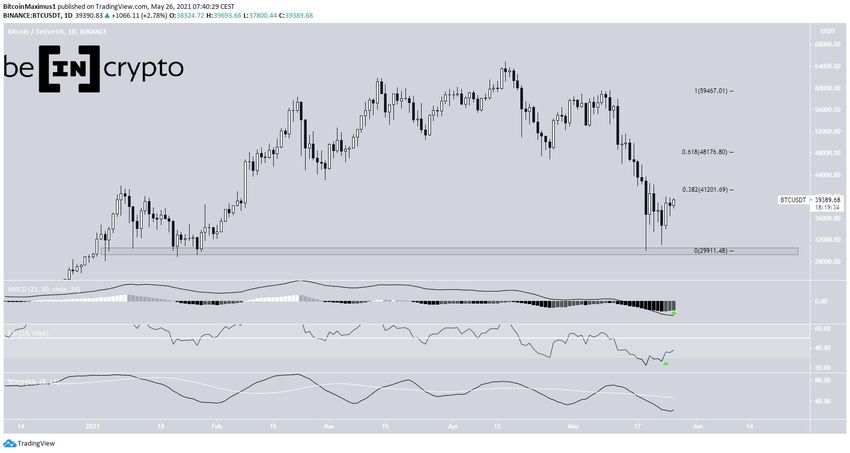
Since then, it’s managed to reach a daily high close of $40,600. The main resistance levels are found at $41,200 and $48,175. These are the 0.382 and 0.618 Fib retracement levels from the most recent drop.
Technical indicators provide some bullish signs. The MACD has generated three higher momentum bars. However, due to the bearish candlestick close yesterday, it did not generate a bullish reversal signal.
The RSI has crossed above 30 after generating a bullish divergence. While the Stochastic oscillator has yet to make a bullish cross, it has begun to move upwards.
Therefore, while the reversal is not confirmed, there are several bullish signs developing.
Short-term movement
The six-hour chart also supports this assessment.
First, it shows that BTC broke out from a descending resistance line and its subsequent validation as support.
Furthermore, both the RSI and MACD have turned bullish. The former has crossed above 50 while the latter is moving upwards.
The significance of the $41,200 area is heightened since it’s also a horizontal resistance area.

Wave count
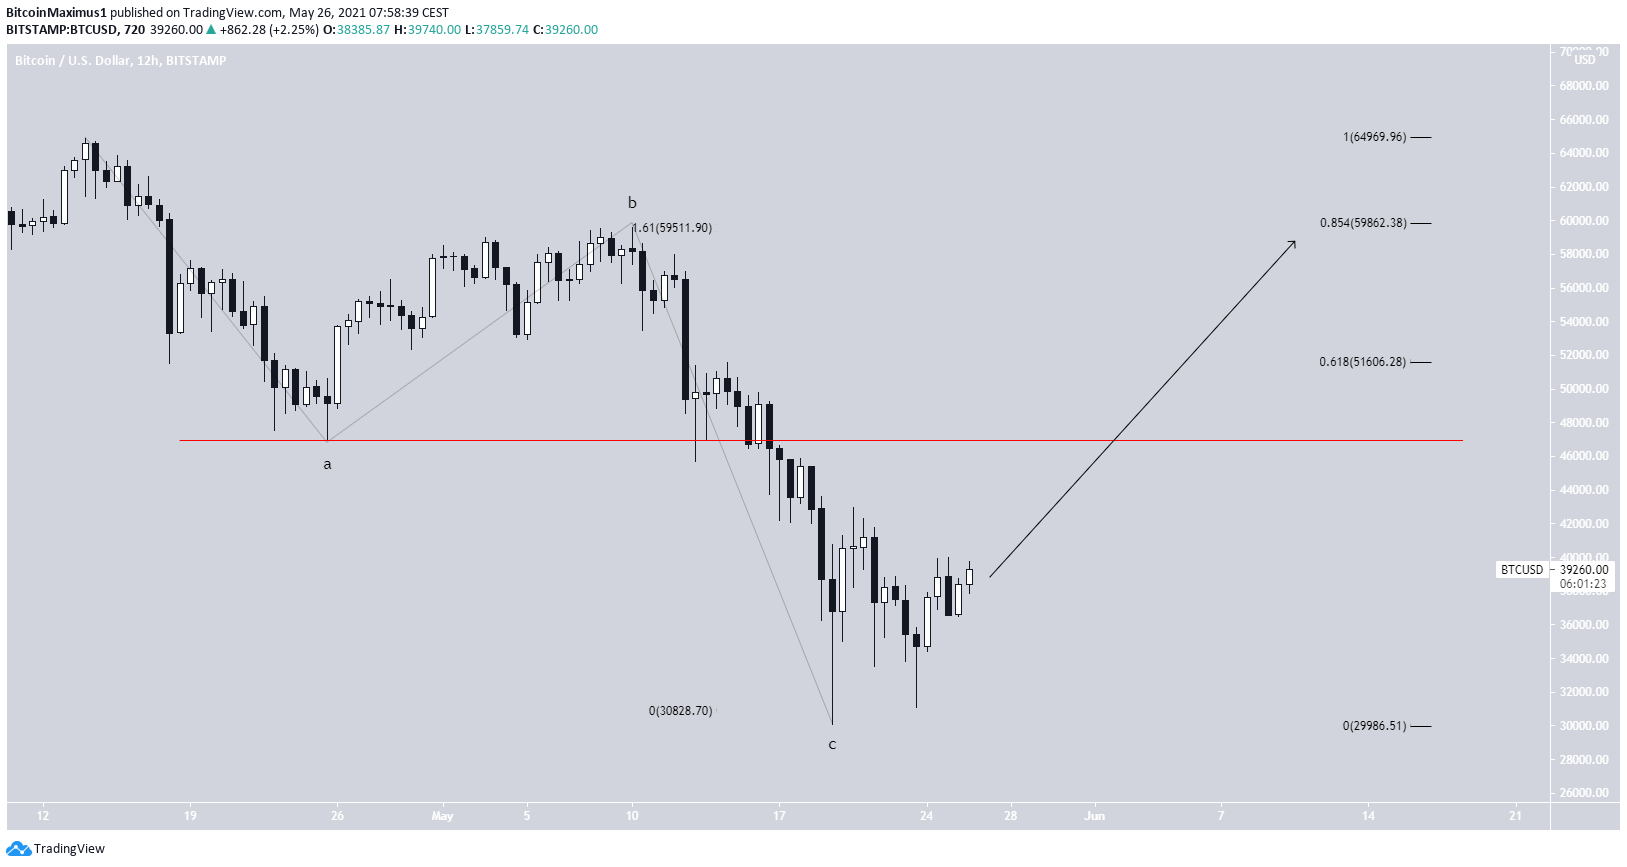
The wave count indicates that the decrease was an A-B-C corrective structure, in which waves A:C had a 1:1.61 ratio.
This is likely the first portion of a flat or triangle correction.
Therefore, we would expect the upward movement to continue at least until the 0.618 Fib retracement resistance level at $51,606 and possibly to the 0.854 Fib at $59,862.
An increase above the wave A low at $47,004 (red line) would confirm that this is not a bearish impulse.
For BeInCrypto’s latest bitcoin (BTC) analysis, click here.


