


Bitcoin (BTC) is trading inside an ascending channel.
Ethereum (ETH) has broken out from a short-term descending resistance line, while Swipe (SXP) is following an ascending support line.
XRP (XRP) is potentially nearing the end of its correction.
Uniswap (UNI), ChainLink (LINK), and Zcash (ZEC) have reclaimed horizontal levels.
BTC
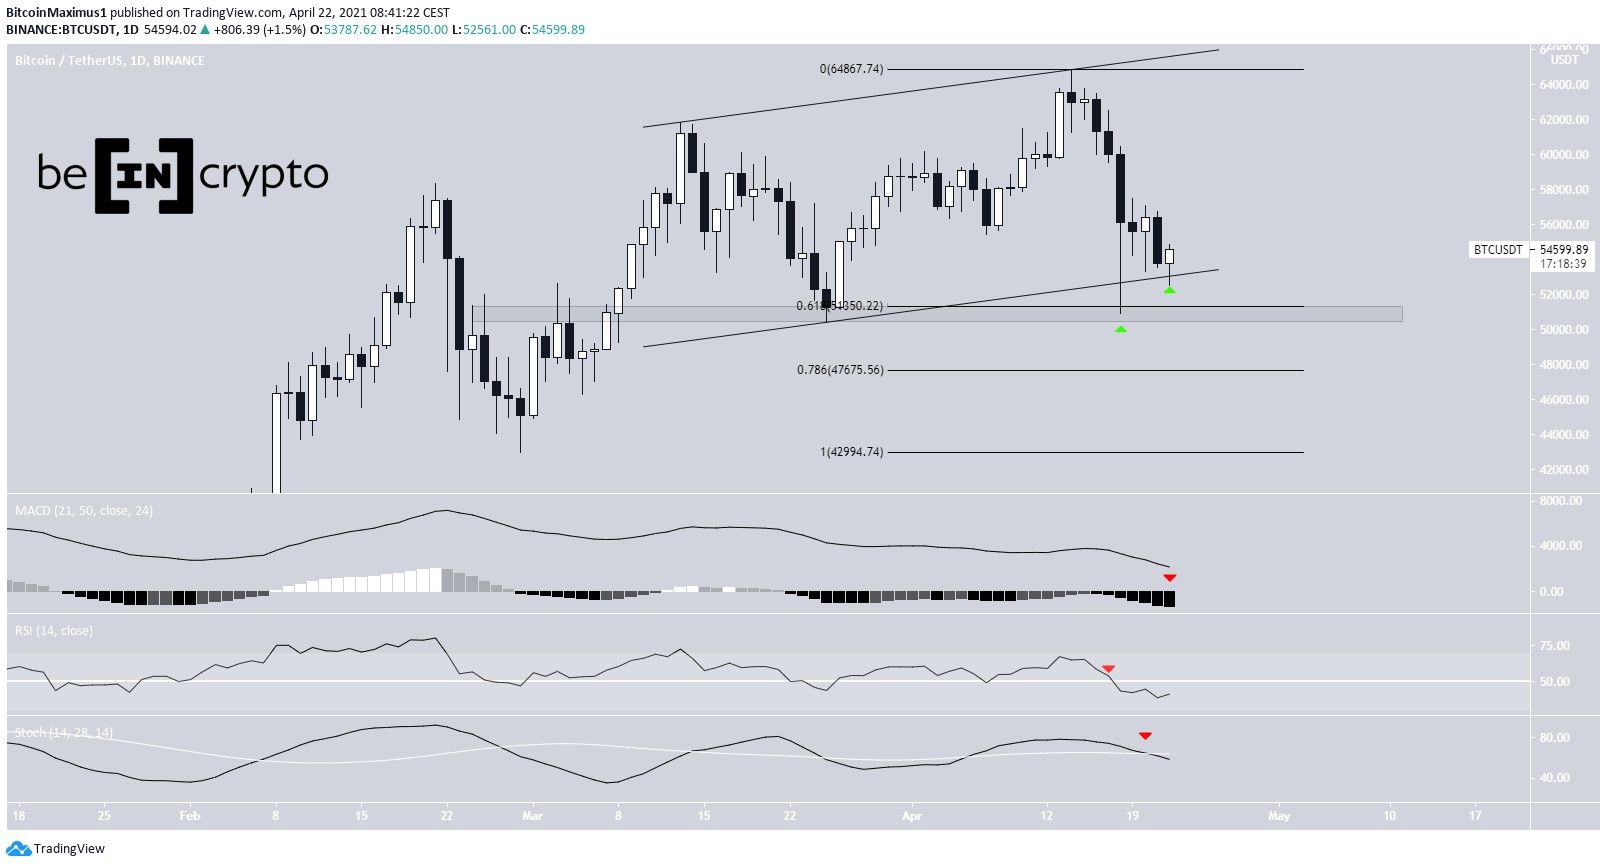
BTC is trading inside an ascending parallel channel. This is often a corrective movement. Therefore, a breakdown would be the most likely scenario.
The MACD & RSI are both bearish. The former is negative while the latter has crossed below 50. Furthermore, the Stochastic oscillator has made a bearish cross.
The closest support area is found at $51,000. It is created by the 0.618 Fib retracement level and is also a horizontal support area. Below it, the next support is found at the 0.786 Fib level at $47,675.
ETH
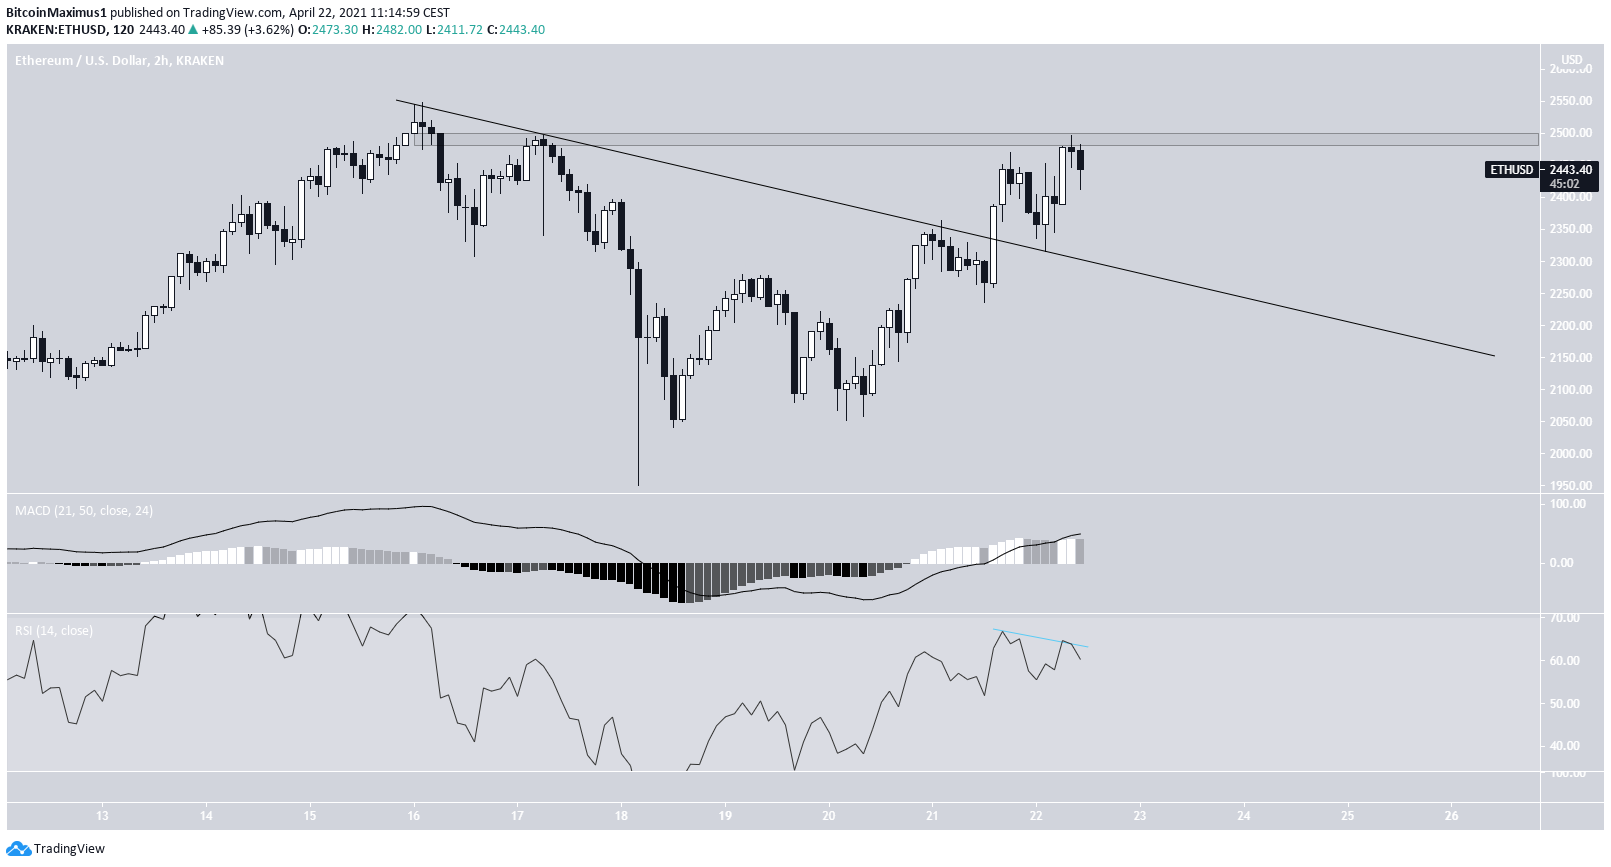
ETH had been following a descending resistance line since reaching an all-time high price on April 16. On April 21, it managed to break out from the line.
Currently, it is trading inside the $2,500 resistance area. The short-term chart is showing some weakness in the form of bearish divergence in both the RSI & MACD.
Therefore, it is possible that ETH decreases and validated the resistance line from which it broke out from.
Despite the possibility of this short-term drop, ETH is expected to continue increasing in the long term.
XRP
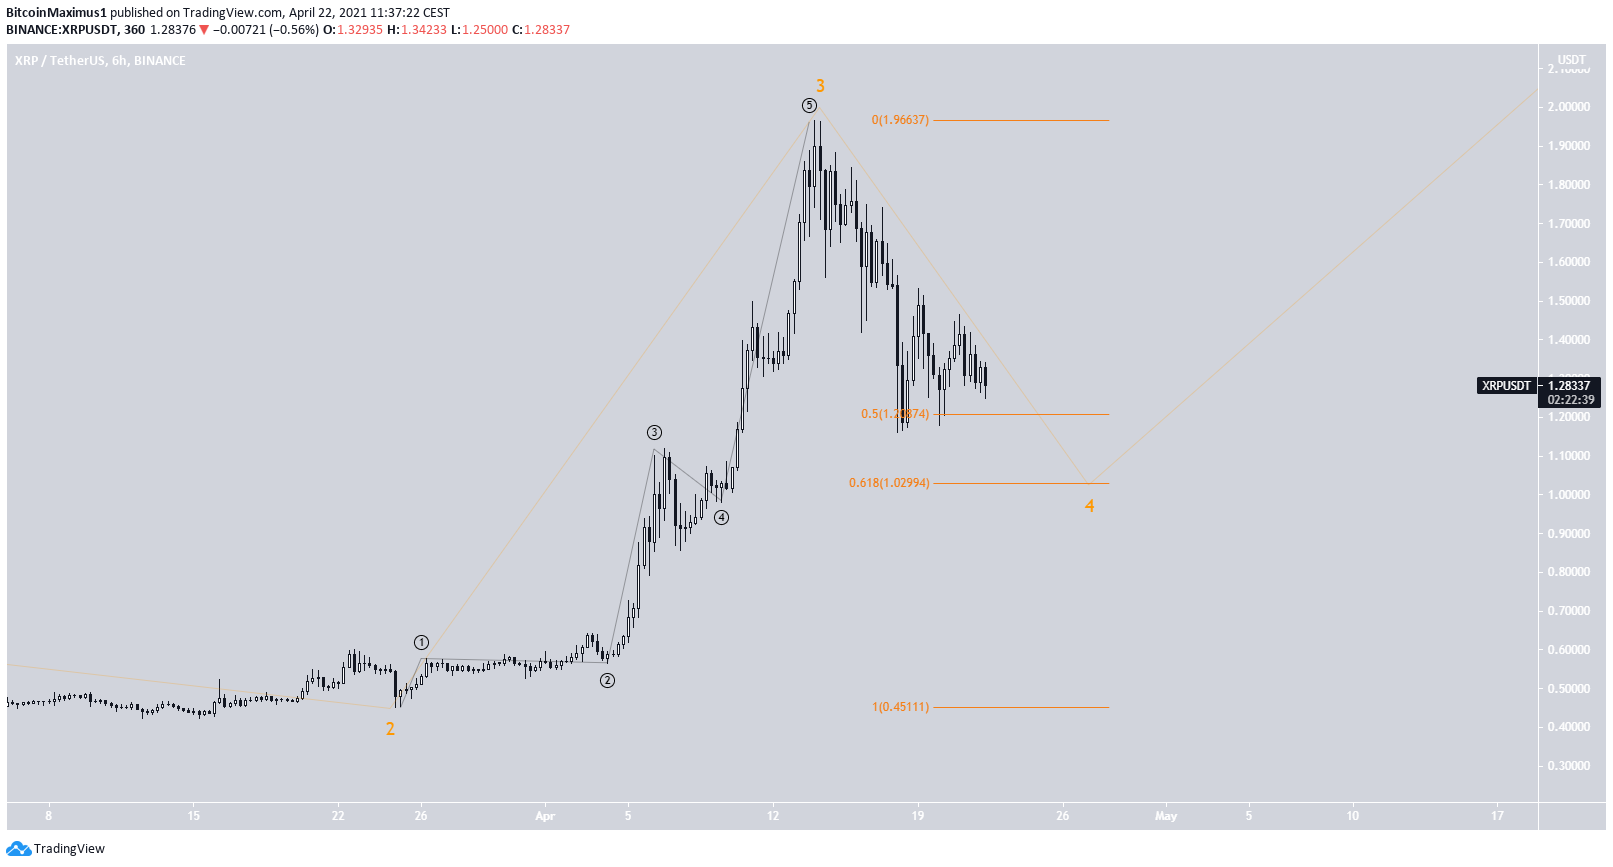
XRP has been decreasing since April 14, when it reached a high of $1.96. This could have been the top of a short-term wave three (orange).
XRP is currently correcting and has reached the 0.5 Fib retracement level at $1.21. However, the bounce has been weak.
Therefore, it is possible that XRP drops to the 0.618 level at $1.029 before beginning to move upwards once more.
SXP
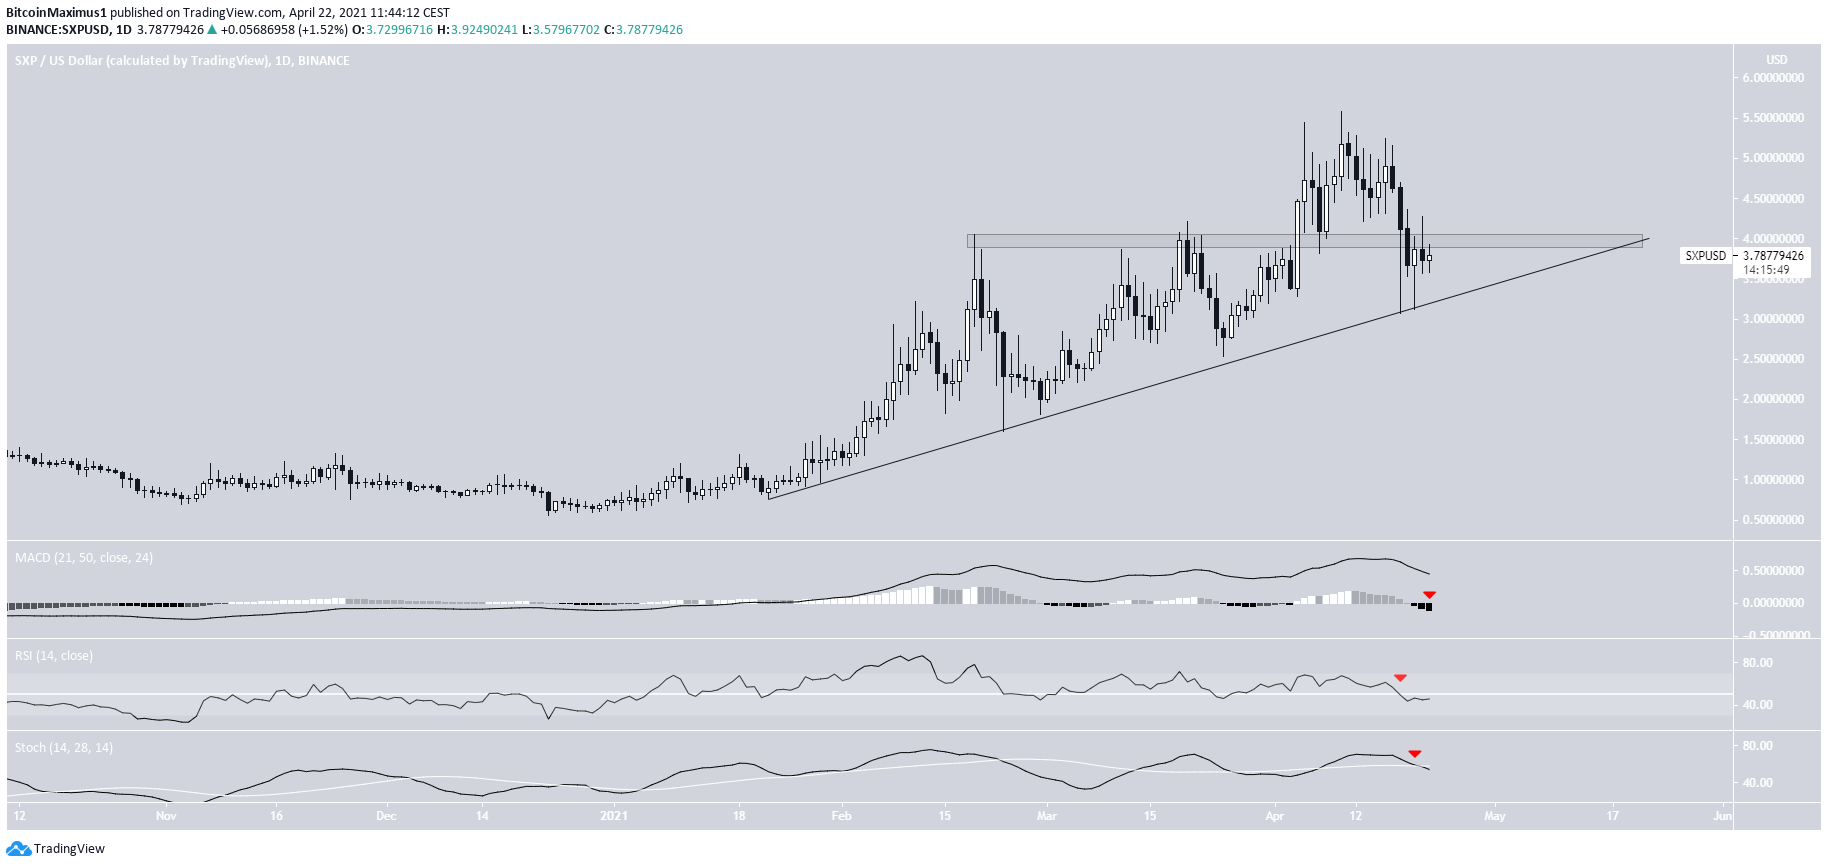
SXP has been following an ascending support line since January 22. In addition, it had been facing resistance at $4.
After breaking out on April 4, SXP proceeded to reach a new all-time high price of $5.57 on April 10. However, it has been decreasing since.
The token fell below the $4 area which was supposed to act as support.
However, the ascending support line is still intact.
Nevertheless, technical indicators are bearish. Therefore, it is possible that SXP drops to this line once more before eventually bouncing upwards.
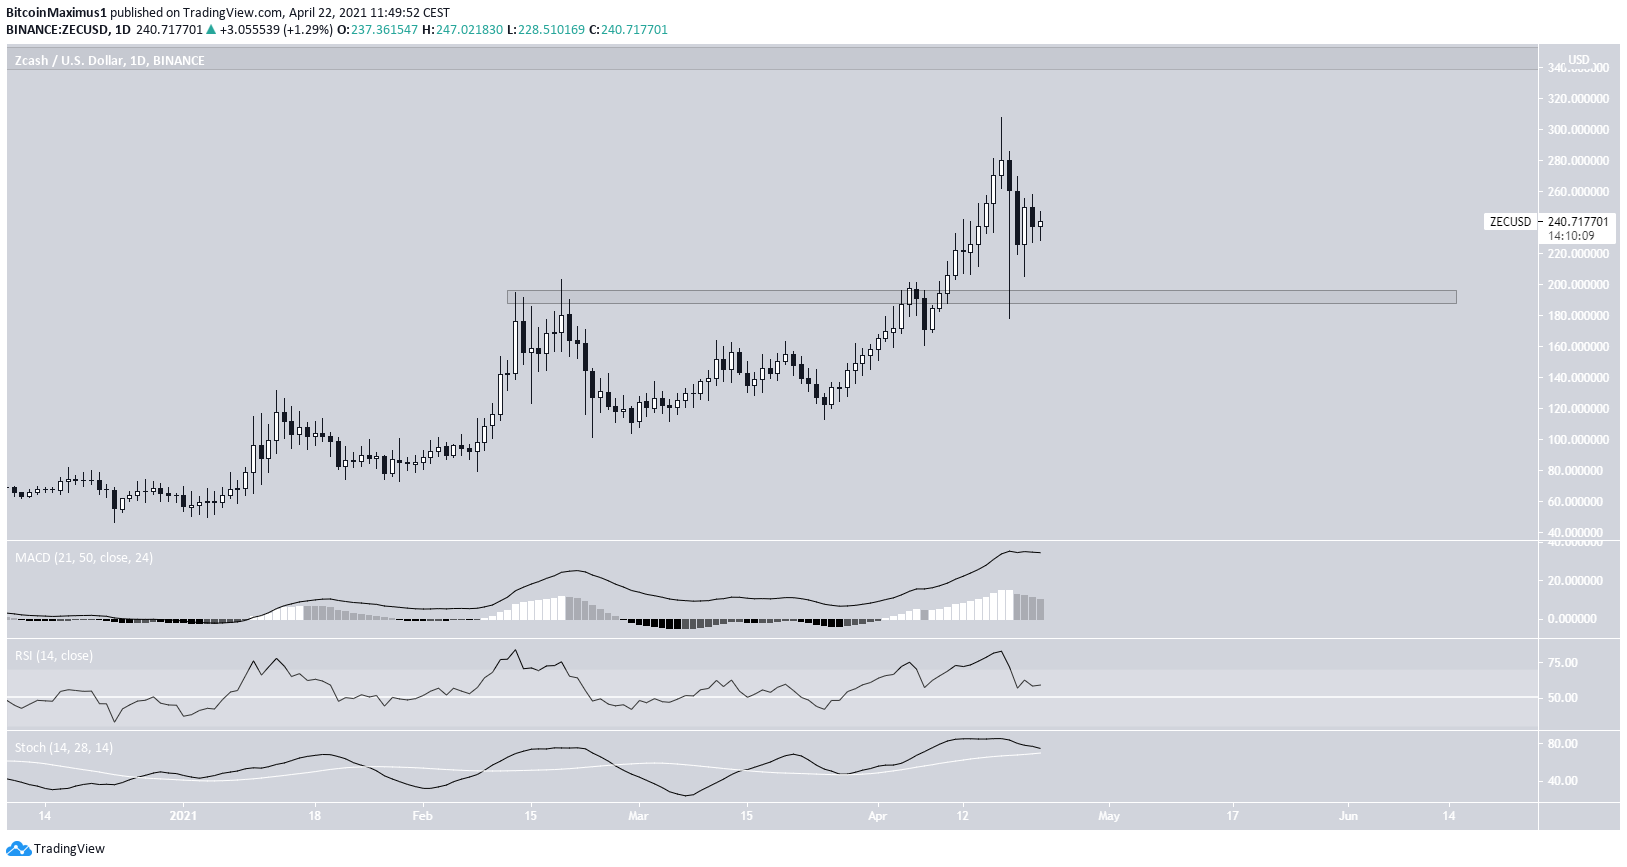
ZEC
On April 17, ZEC reached a high of $308.22. It dropped sharply the next day, reaching a low of $178.3.
However, the decrease left a very long lower wick in place, a sign of buying pressure. The wick also validated the previous breakout level at $190 as support.
Despite the drop, technical indicators are still bullish.
Therefore, while the possibility of another re-test of the $190 area remains, the trend remains bullish as long as ZEC does not close below the $190 area.
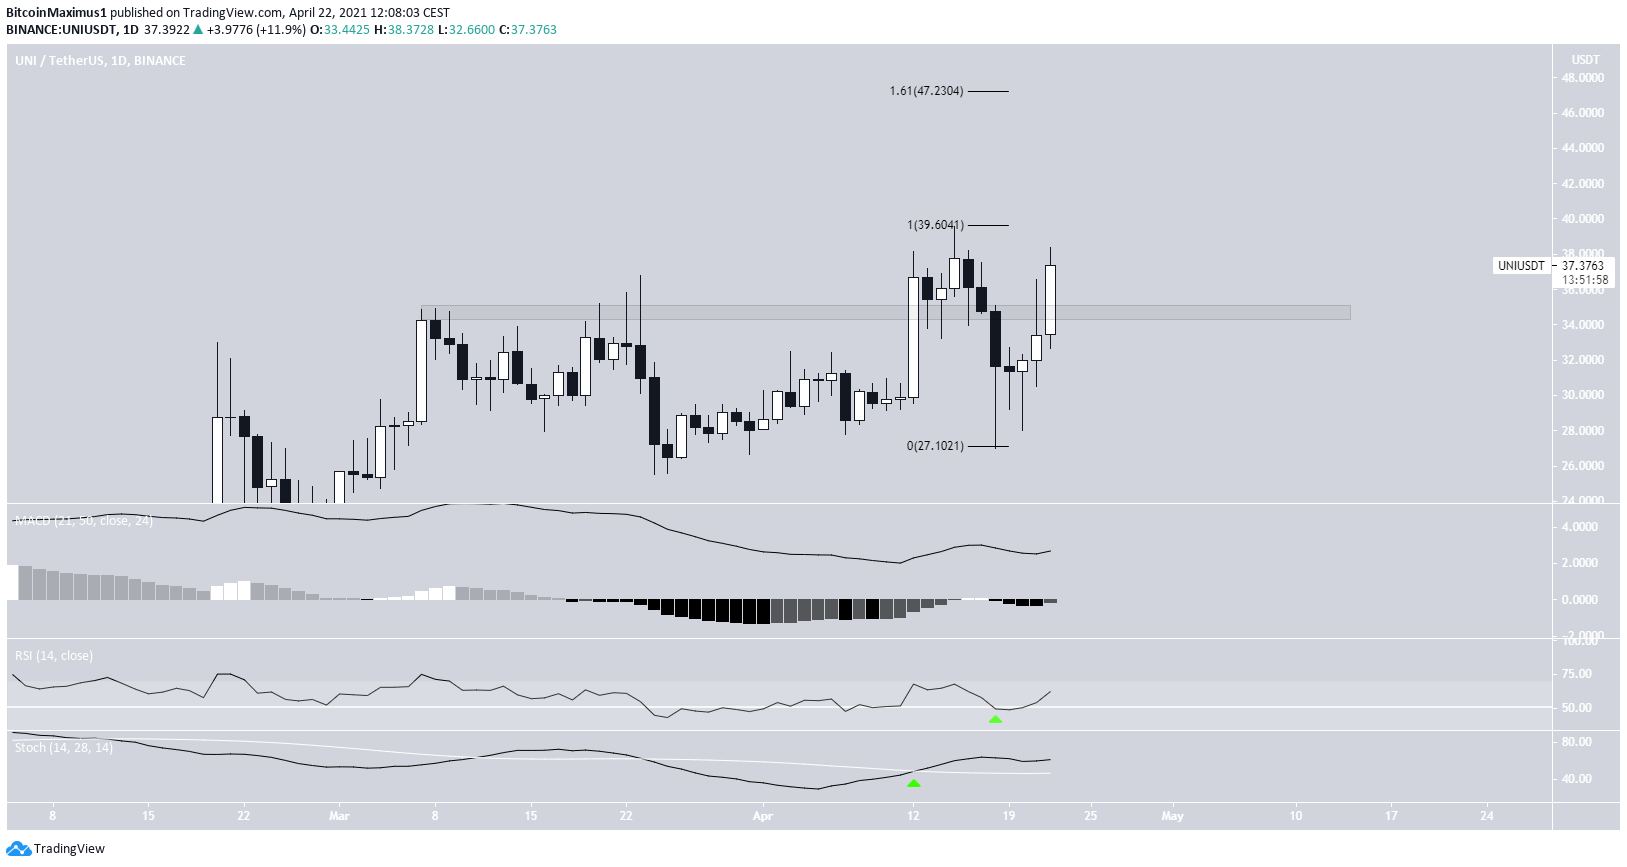
UNI
On April 15, UNI reached an all-time high price of $39.60. However, it dropped sharply almost immediately afterward.
Despite the drop, it has now reclaimed the $34.50 area, which is now likely to act as support.
Furthermore, technical indicators have turned bullish. This is especially evident by the bullish cross in the Stochastic RSI and the RSI movement above 50.
The next closest resistance area is located at $47.2. It is found by the 1.61 external Fib retracement on the most recent drop.
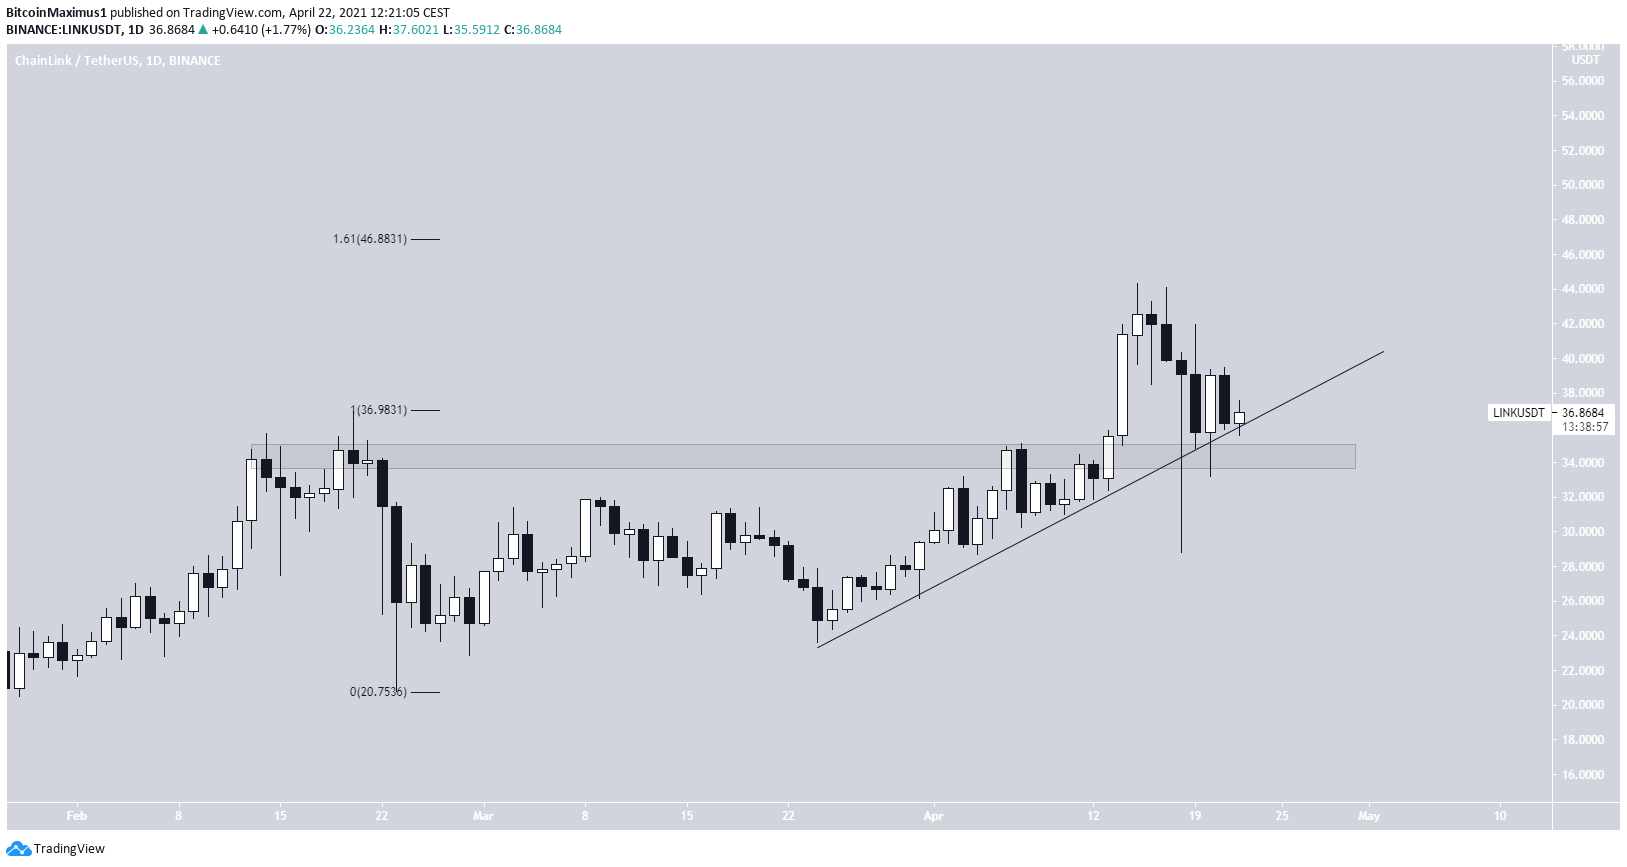
LINK
LINK has been decreasing since April 15, when it reached an all-time high price of $44.33.
The ensuing drop took it back to the $34 area, which it validated as support. Besides that, the token is also following a resistance line.
The trend is considered bullish as long as LINK is trading above these two support levels.
The next closest resistance area is found at $46.88.
For BeInCrypto’s latest bitcoin (BTC) analysis, click here.


