


Bitcoin (BTC) bounced on April 18 but has since dropped and returned near the same level.
The BTC bounce so far has been weak, and the price is showing bearish signs. A breakdown from the current channel could occur.
BTC drops to channel support
BTC has been moving downwards since it reached an all-time high on April 14. The decrease accelerated on April 18, taking it to a low of $50,931.
The drop validated both the $51,000 area as support and touched the support line of an ascending parallel channel.
Ascending parallel channels are usually corrective.
Furthermore, technical indicators are bearish. The RSI is trading below 50. The Stochastic Oscillator has just made a bearish cross and the MACD has crossed negative.
If BTC breaks down from the channel, the next support level would be found at $47,675. It is created by the 0.786 Fib retracement level.
BTC Triangle Breakdown
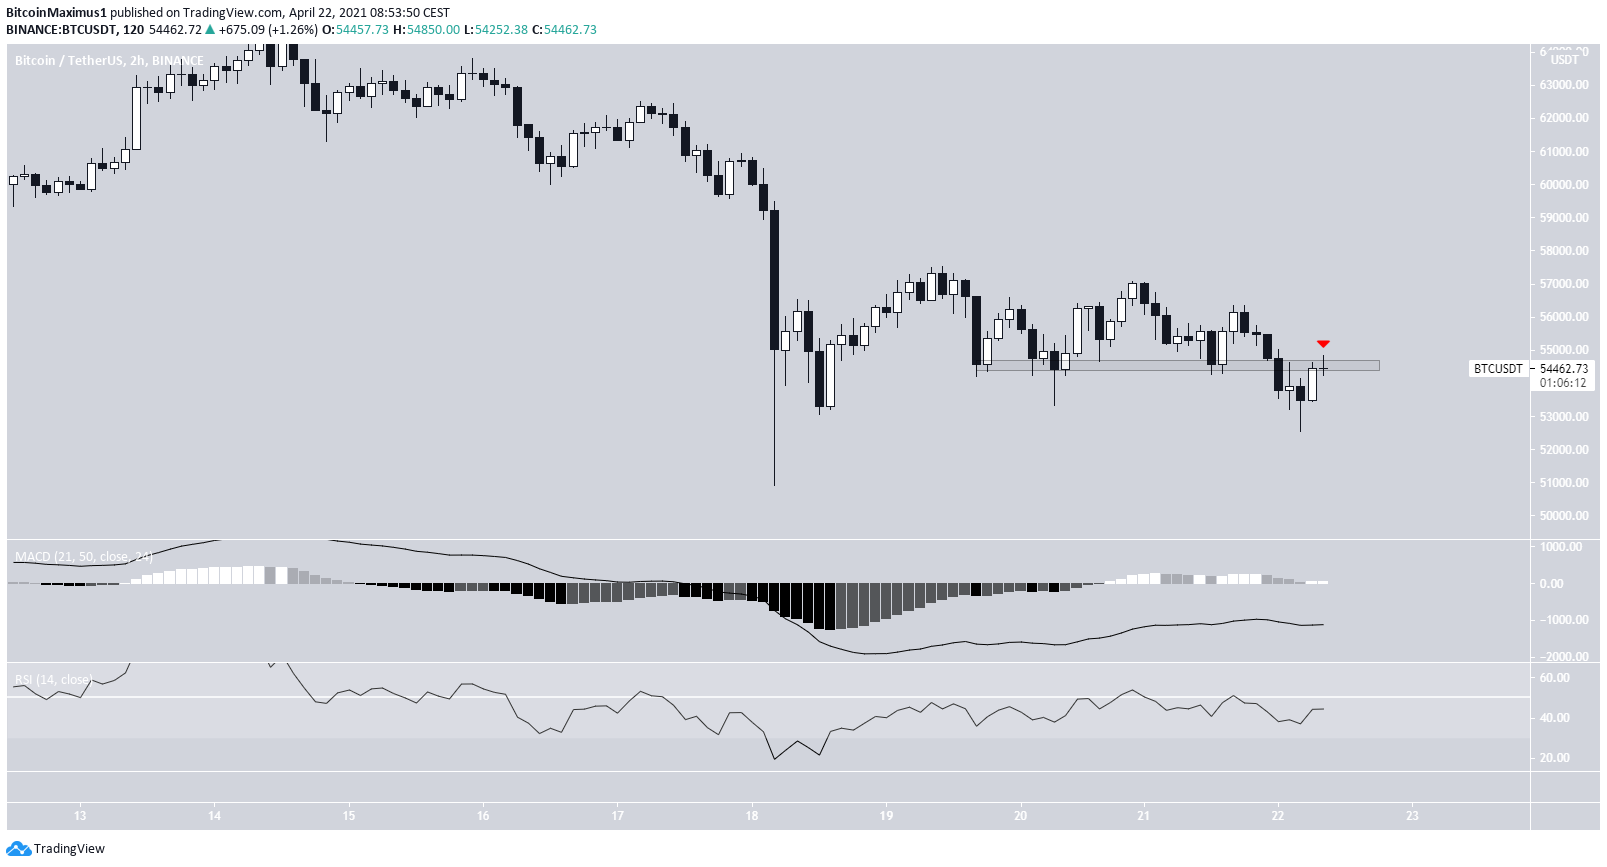
The shorter-term two-hour chart provides more bearish signs. The price has fallen below the $54,500 area, which previously acted as support.
Currently, it is in the process of validating it as resistance (red arrow).
Technical indicators have also turned bearish. The MACD is decreasing, nearly crossing into negative territory. The RSI is also decreasing and is below 50.
Therefore, the reading from the two-hour time frame align with those from the daily one.
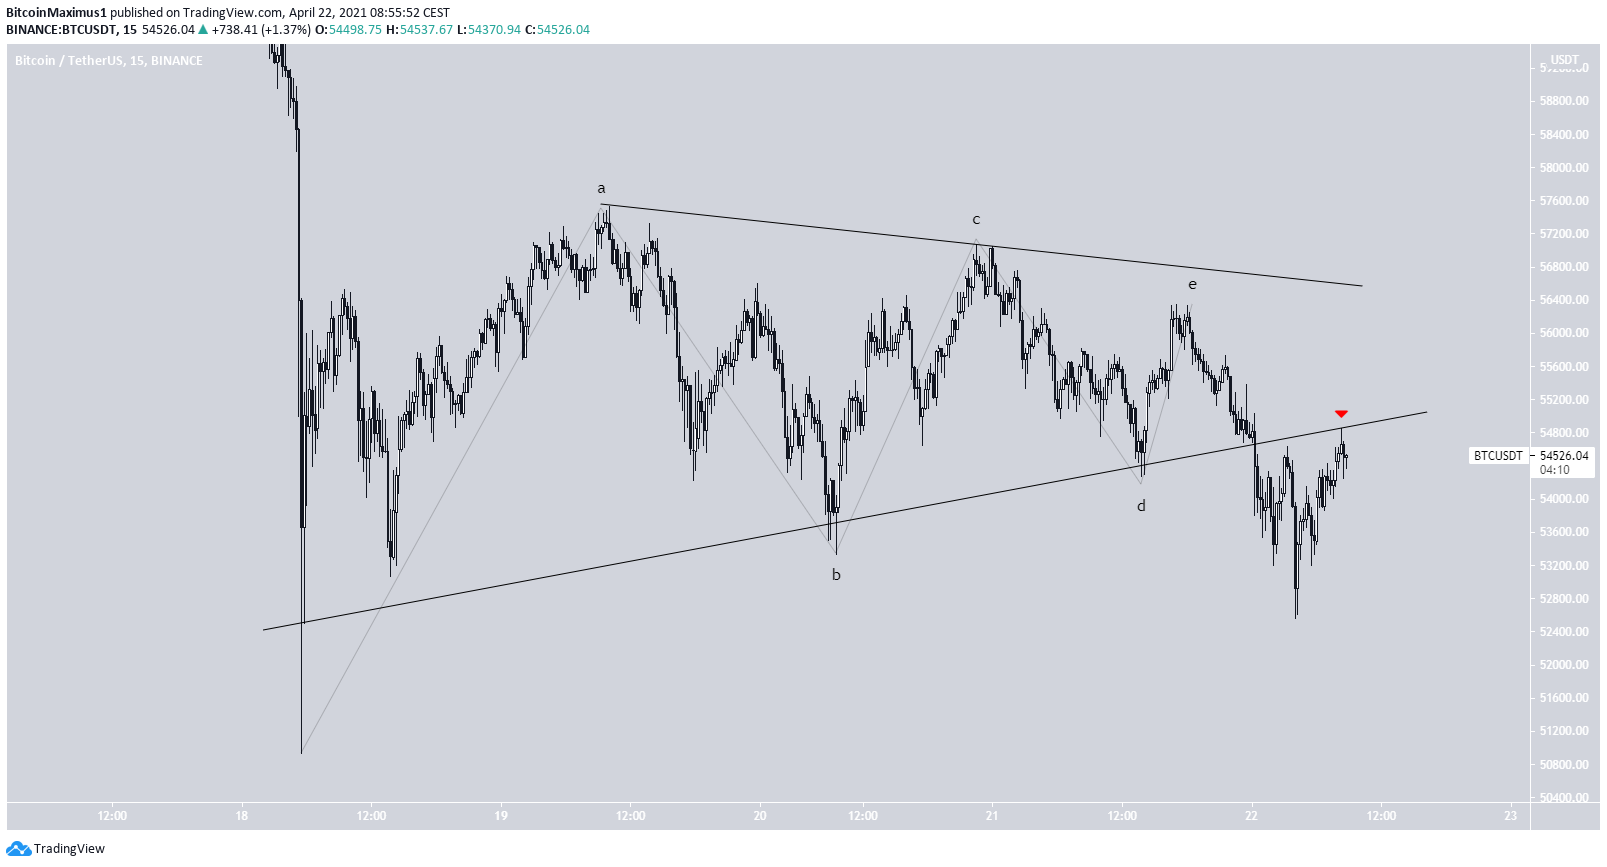
Furthermore, a closer look shows a breakdown from a symmetrical triangle. This could have been wave four of a bearish impulse.
Currently, BTC is in the process of re-testing the support line and validating it as resistance.
Unless the line is reclaimed, which seems unlikely, another low is expected.
Conclusion
To conclude, BTC is showing bearish signs on both the daily and two-hour time-frames. The bearish pattern alongside the short-term breakdown suggests that another low is likely.
For BeInCrypto’s previous bitcoin (BTC) analysis, click here.



