


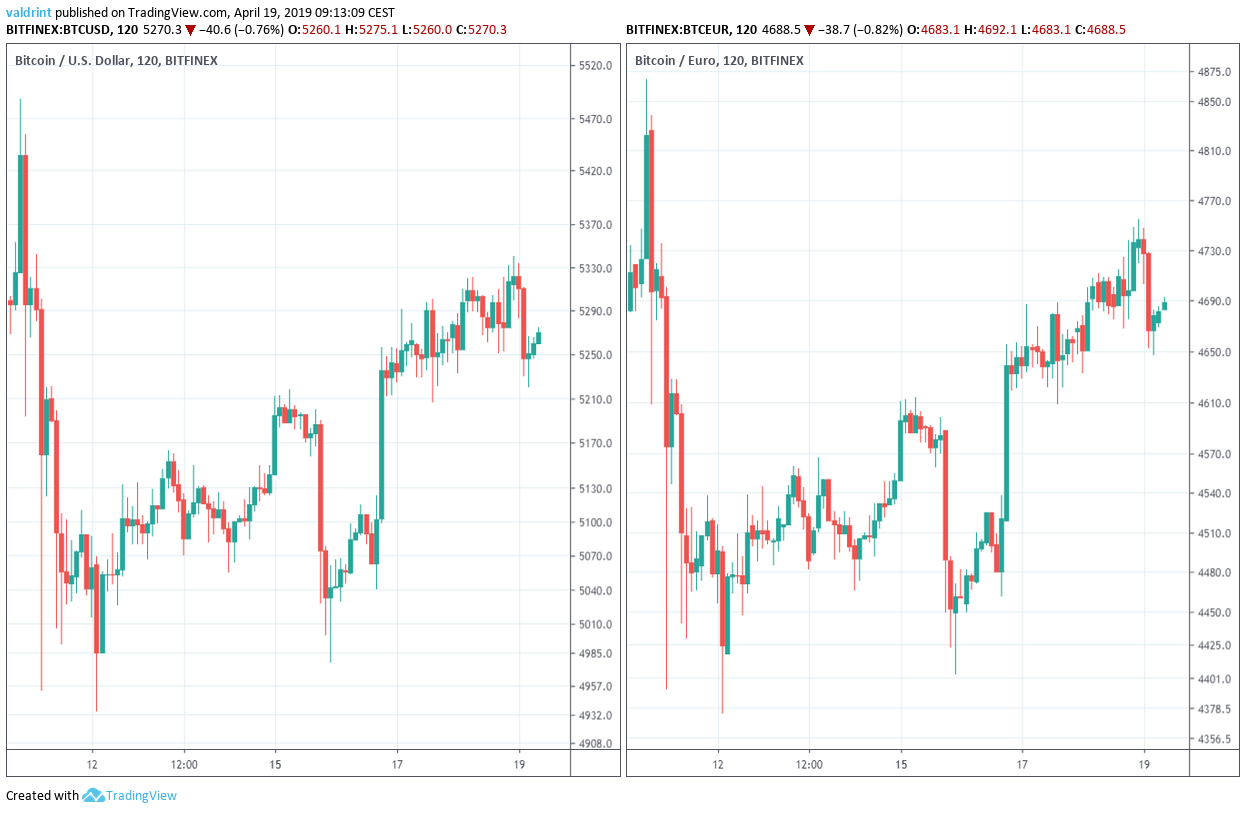
On Apr 10, the price of BTC reached a high of $5488 and €4868. A sharp decrease ensued. Bitcoin reached a low of $4934 and €4374 two days later.
Bitcoin has since been on an uptrend with highs near $5340 and €4754 reached at the time of writing on Apr 19:
Are prices going to continue along this uptrend trend or will Bitcoin drop again?
Let’s find out:
Bitcoin (BTC): Trends and Highlights For April 19, 2019
- The price of BTC reached a high on Apr 10.
- It has been trading inside an ascending channel since Apr 11.
- Bitcoin is trading very close to the resistance line of the channel.
- Bearish divergence is developing in the RSI and the MACD.
- There is resistance near $5330/€4740 and support near $5000/€4400.
A Look at the Current Trading Pattern
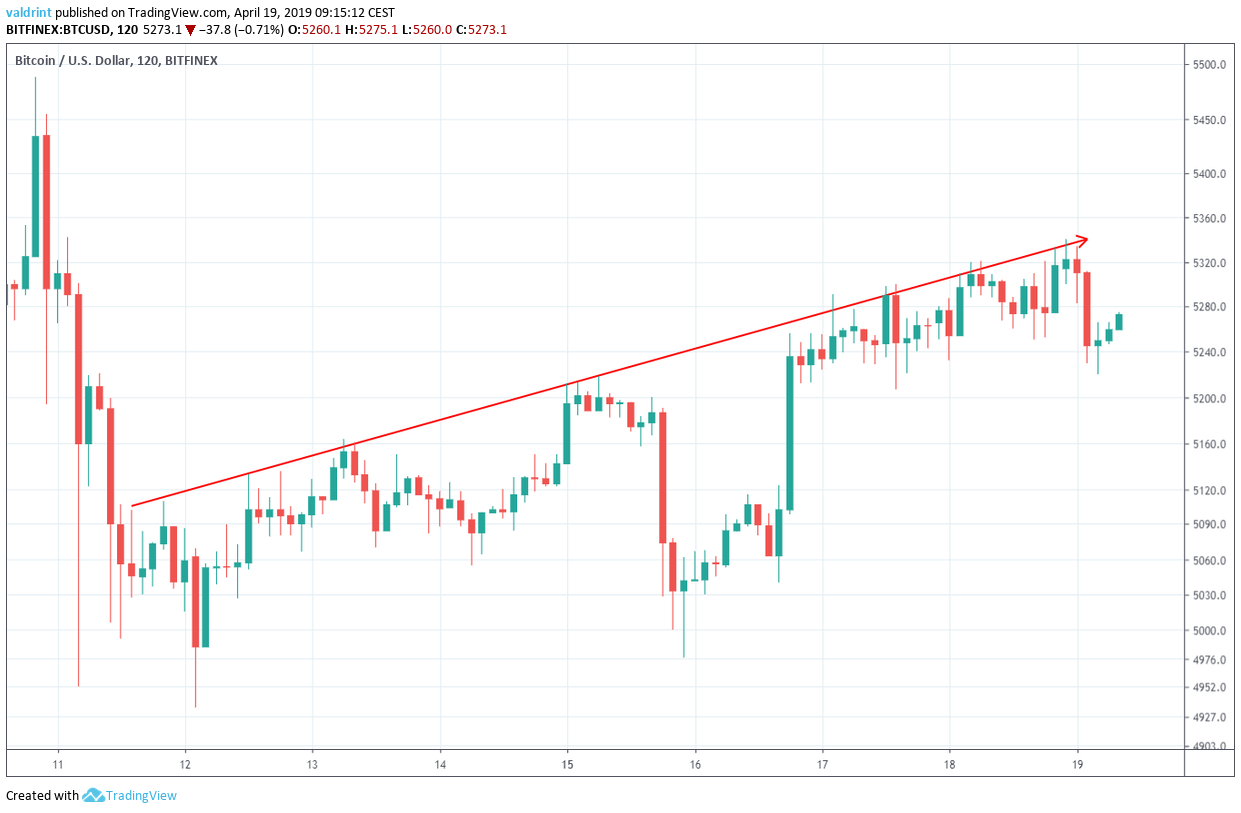
On Apr 11, the price made an hourly high of $5088.11. A gradual decrease was followed by a gradual increase. The price has made several higher highs during this period.
Tracing these highs gives us an ascending resistance line:
On Apr 12, Bitcoin made a low of $4912. Several market cycles have been completed. The price has made successively higher lows.
Tracing these lows gives us an ascending support line.
The resistance and support lines combine to create an ascending channel:
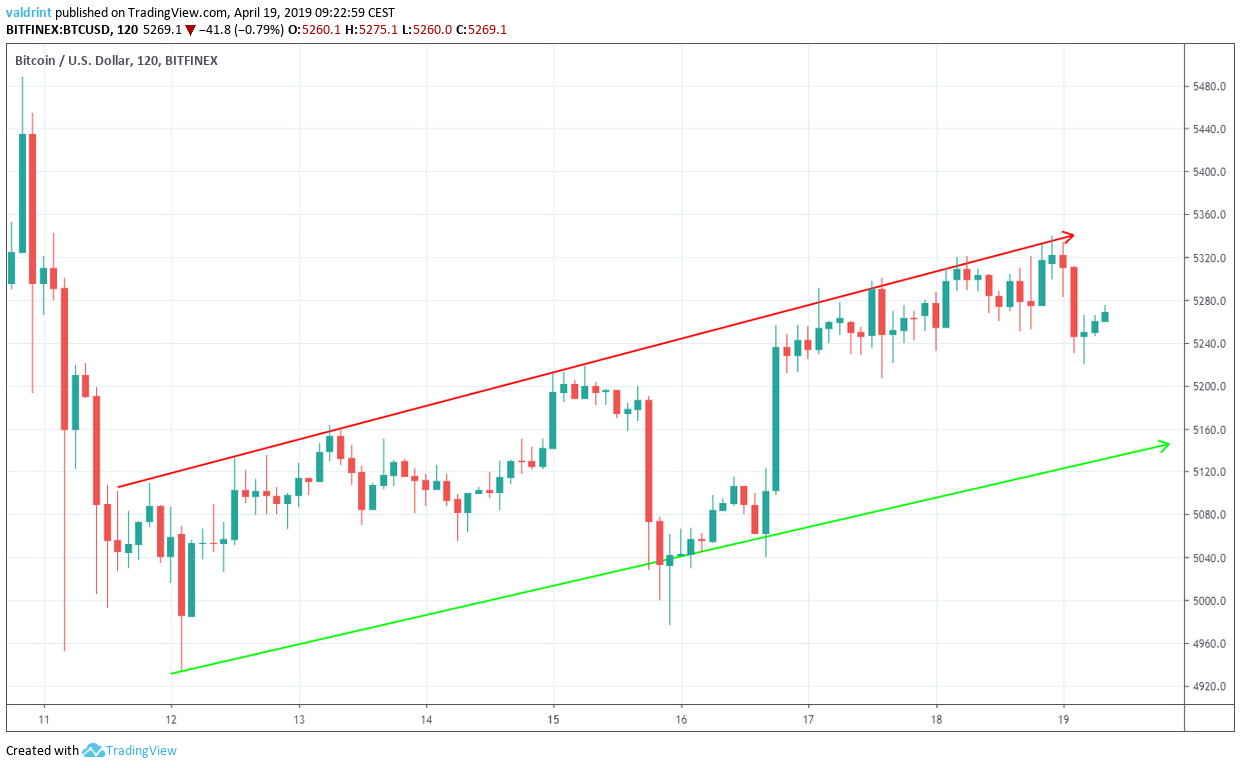
It is likely that the price will increase at the rate predicted by the channel until a decisive move occurs.
In order to predict the direction of the movement, a look at technical indicators is required.
APRIL BITCOIN PREDICTIONS!
Technical Indicators
To better assess future price fluctuations, we incorporate technical indicators into the analysis. We begin with the relative strength index and the moving average convergence divergence.
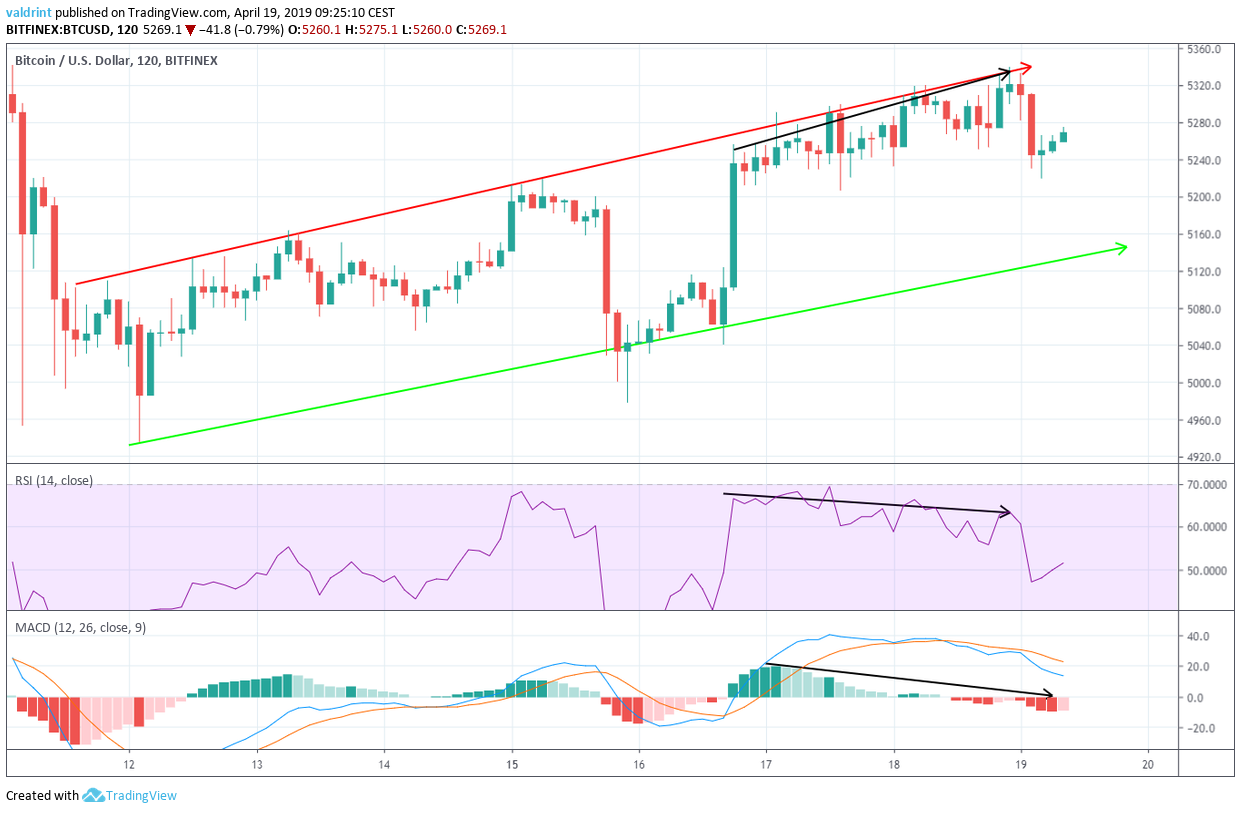
On Apr 16, Bitcoin reached a high of $5256.5. It continued to increase and reached a high of $5340.0 on Apr 19.
Similarly, the RSI and the MACD made the first high on Apr 16. However, they have proceeded to generate lower values.
This is known as bearish divergence and often precedes price decreases.
Using these indicators, it is likely that the price will drop to the support line of the channel.
Reversal Areas
We now incorporate support and resistance areas to determine the actual possible future price levels. In this section, we analyze both BTC/USD and BTC/EUR trading pairs.
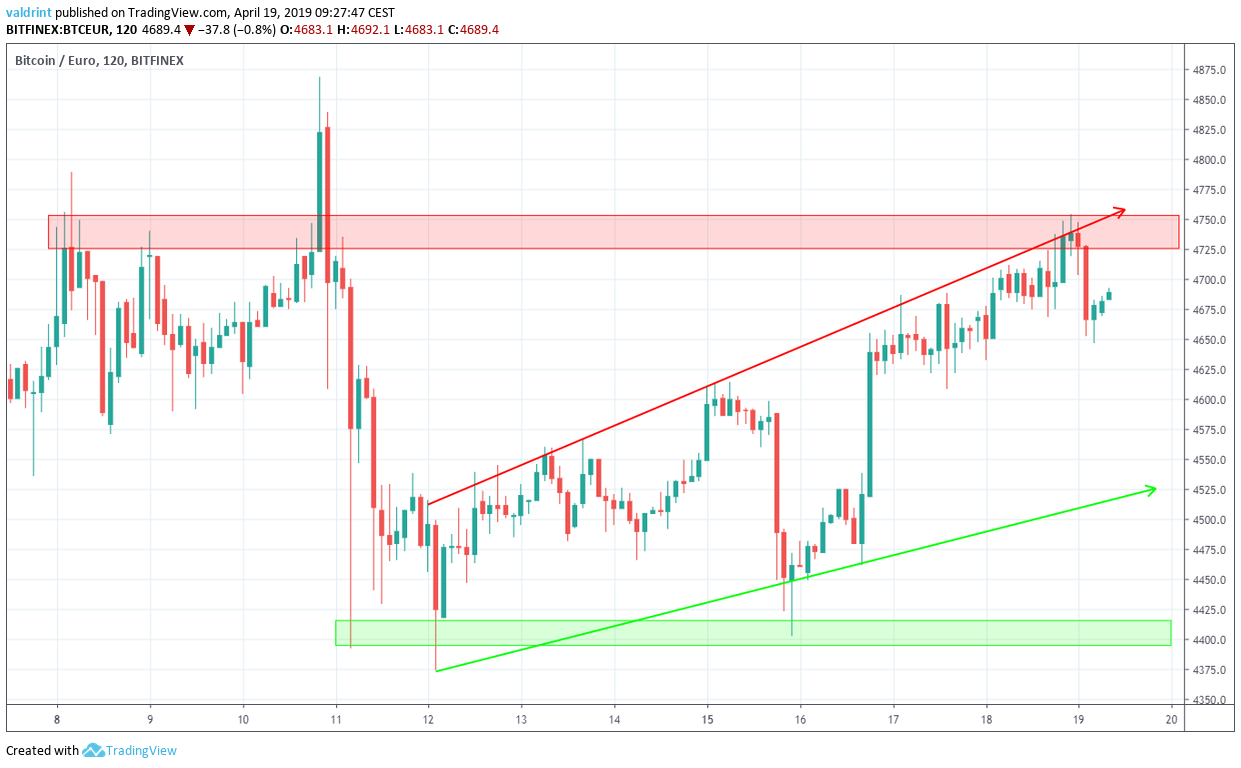
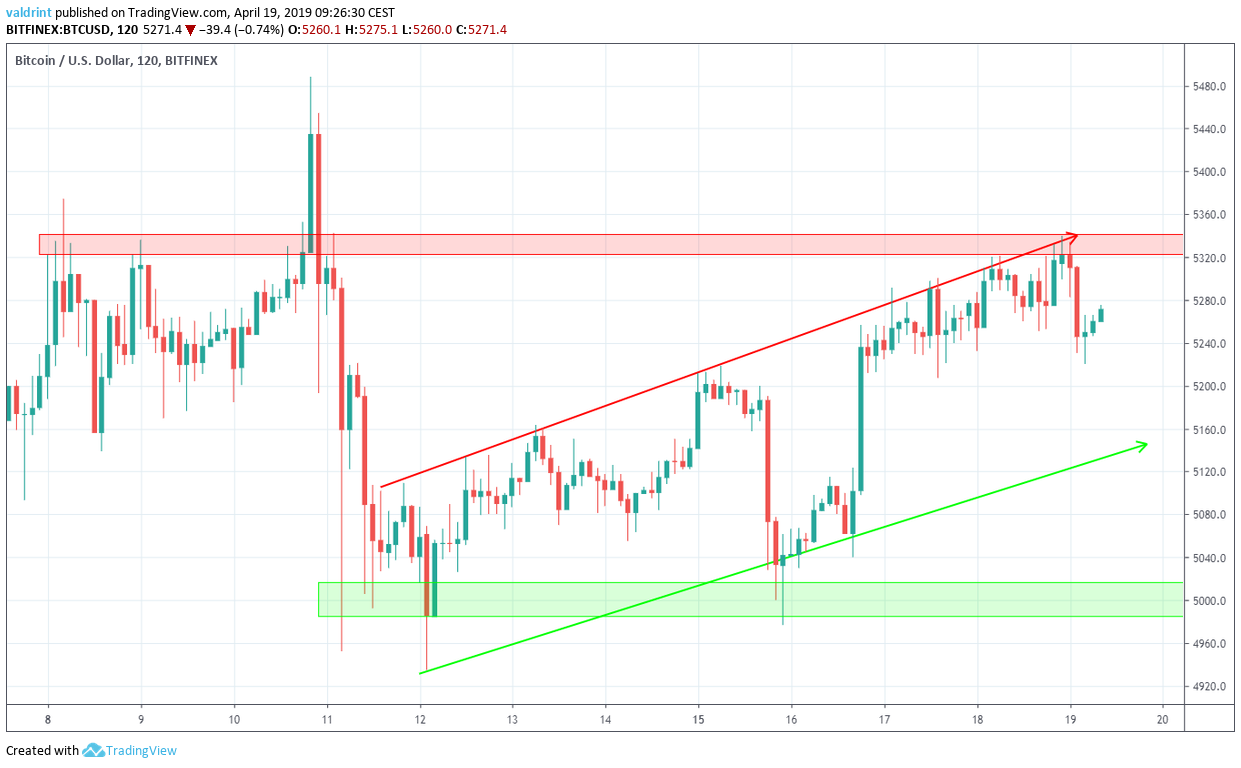
The closest support area is found near $5000 and €4400. If the price breaks down from the channel, it is likely to reach this area.
The closest resistance area is found near $5330 and €4740. The price recently reached this area and was rejected. We do not believe the price will move above this area.
Conclusion and Summary
Based on this analysis, the price of BTC is likely to drop to the support line of the channel. This means that prices may fall to $5150 and €4525. We cannot yet confidently predict whether a breakdown below the channel is likely to occur.
Interested in 2019, 2020, and 5 year Bitcoin price predictions? Click on the green button below:
Do you think BTC will keep trading inside the channel? Let us know your thoughts in the comments below!
Disclaimer: This article is not trading advice and should not be construed as such. Always consult a trained financial professional before investing in cryptocurrencies, as the market is particularly volatile.


