


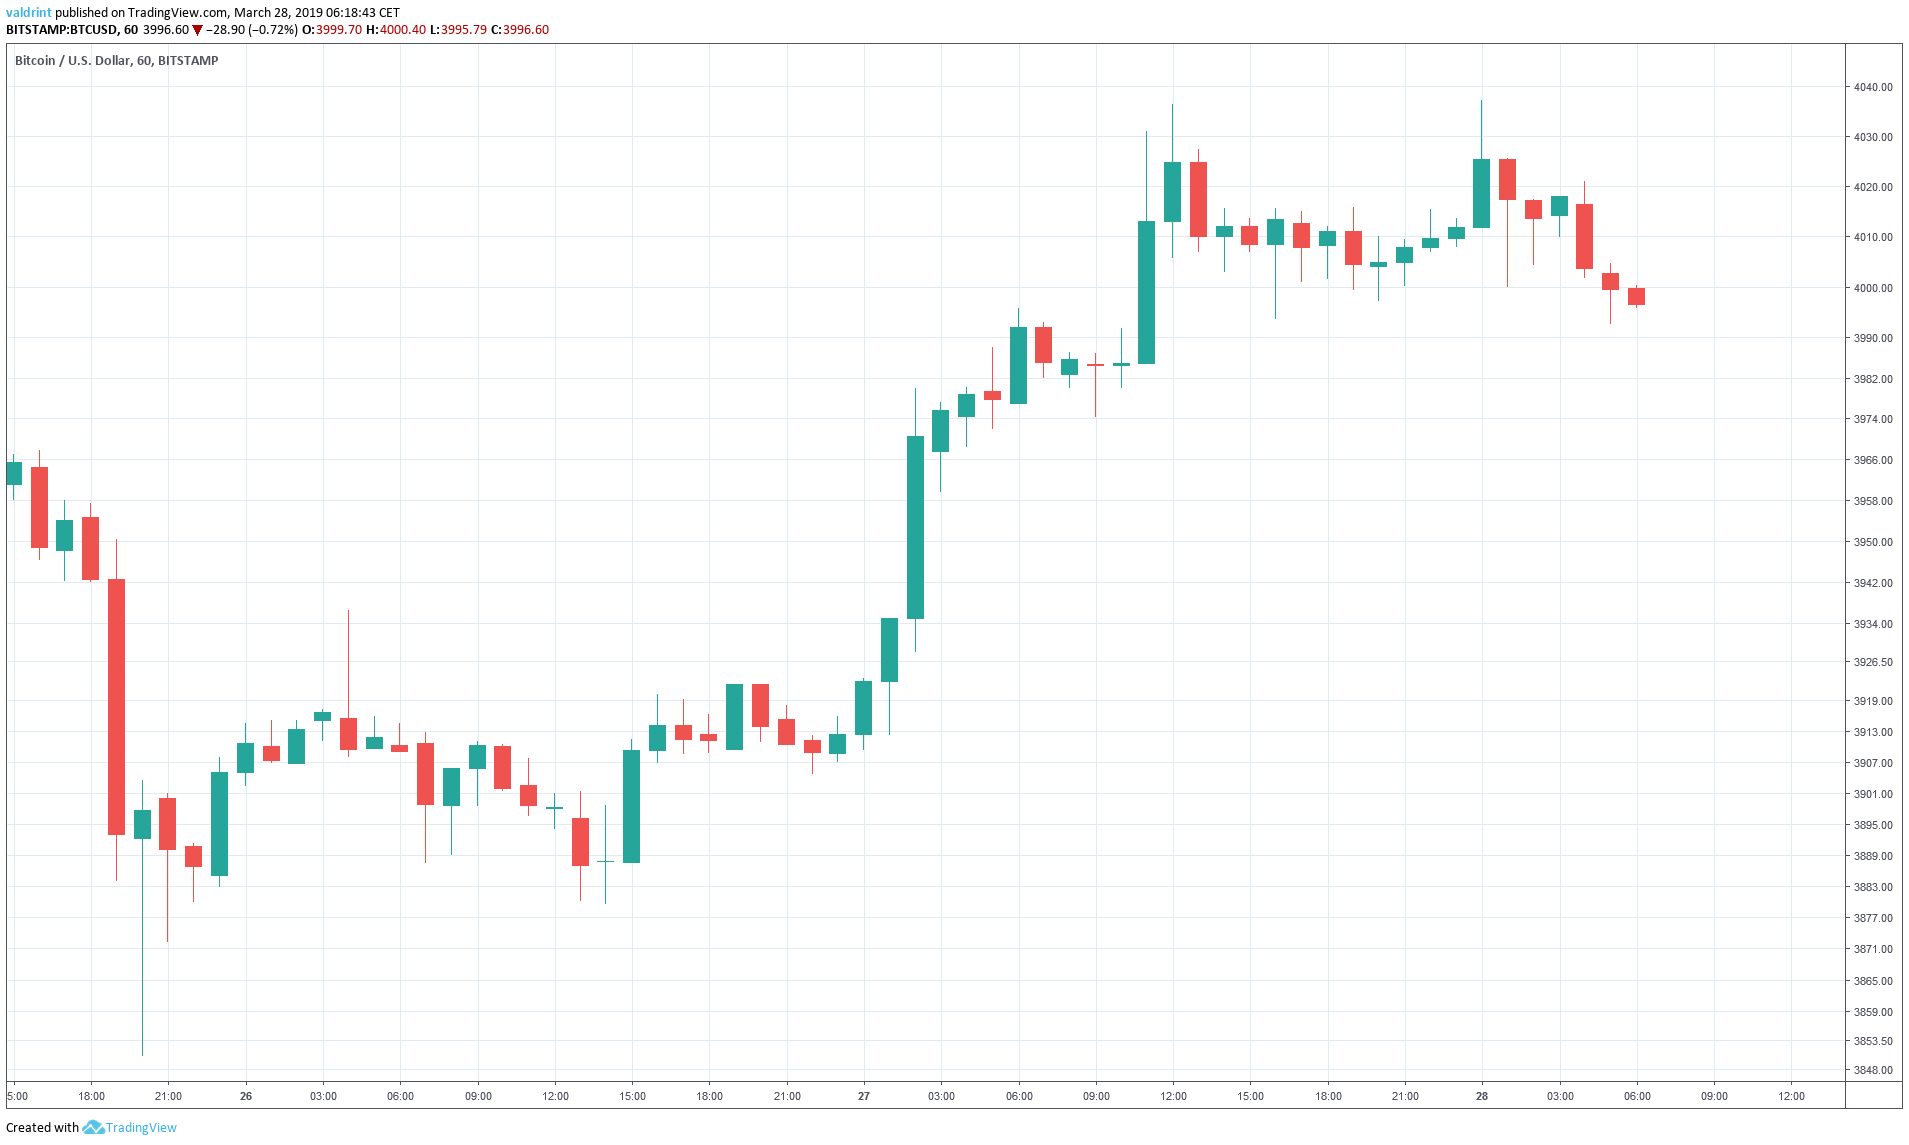
On March 25, 2019, Bitcoin (BTC) made a low of $3850. It revisited a similar level on Mar 26. A gradual increase ensued.
A high of $4036 was reached on Mar 27. This high was the following day. At the time of writing on Mar 28, Bitcoin was trading around $4000.
Will Bitcoin break out of the $4000 barrier for good or will prices drop down to $3850 lows again?
Based on today’s analysis, we believe that Bitcoin will continue trading inside the confines of the channel defined below. Short-term decreases remain likely while long-term grwoth continues.
Bitcoin (BTC): Trends and Highlights For March 28, 2019
- The price of Bitcoin has been on a short-term uptrend since Mar 25.
- Rapid price spikes on Mar 27 may have brought the downtrend to an end.
- BTC is trading inside a longer term ascending channel.
- There is bearish divergence developing in the RSI and the MACD.
- There is support near $3900.
- There is resistance near $4140 and $4030.
Ascending Support
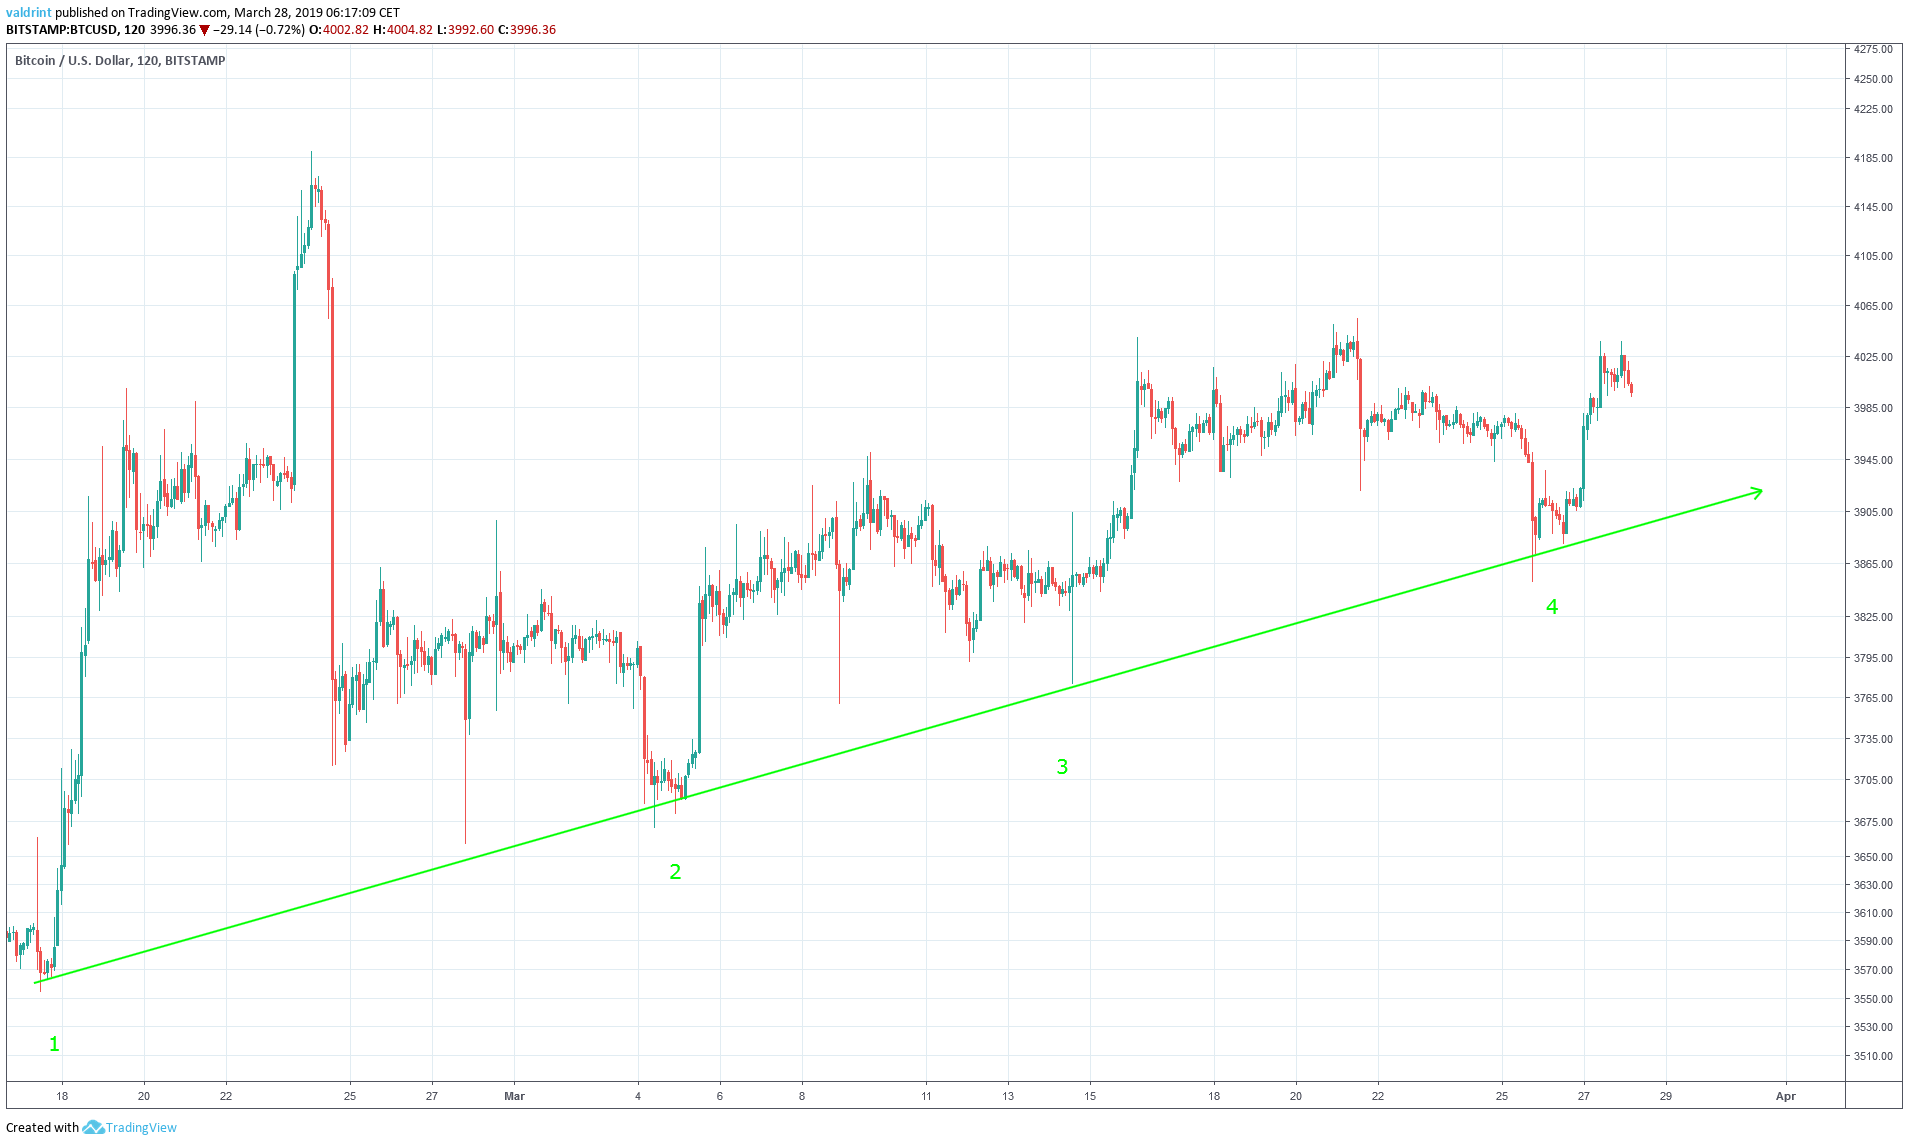
The price of BTC on BitStamp is analyzed at two-hour intervals from Feb 17 to Mar 28.
On Feb 17, the price made a low of $3553.80. A sharp upward move began. This was followed by a sharp correction. The price has been on a gradual uptrend since, with each low being higher than the previous one.
Tracing these lows gives us an ascending support line:
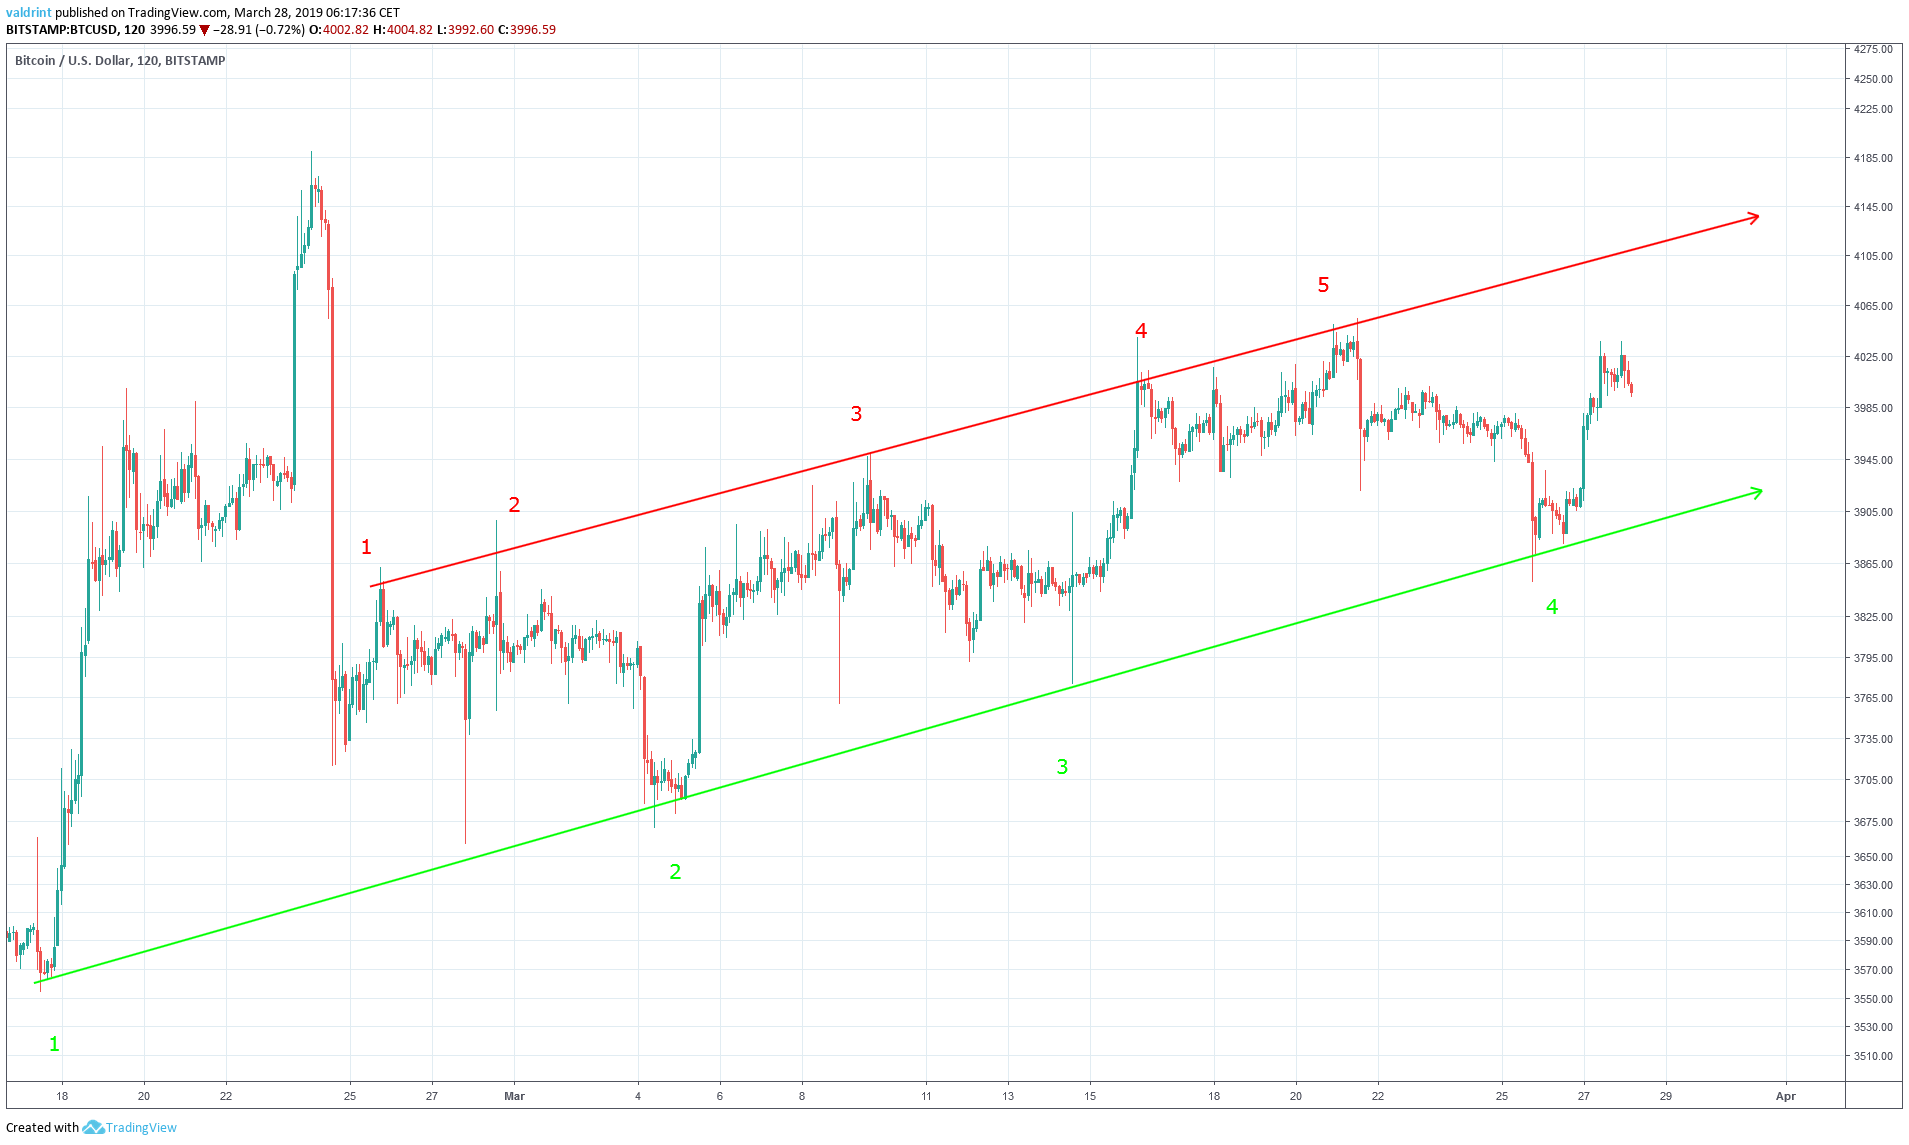
On Feb 25, the price made a high of $3861.80. Since then, several market cycles have been completed with each high being higher than the preceding one.
Tracing these highs gives us an ascending resistance line. Furthermore, the resistance and support lines combine to create an ascending channel:
Bearish Divergence
To better asses future price fluctuations, we examine the price of BTC on BitStamp is analyzed at one-hour intervals from Mar 25 to Mar 28 alongside technical indicators.
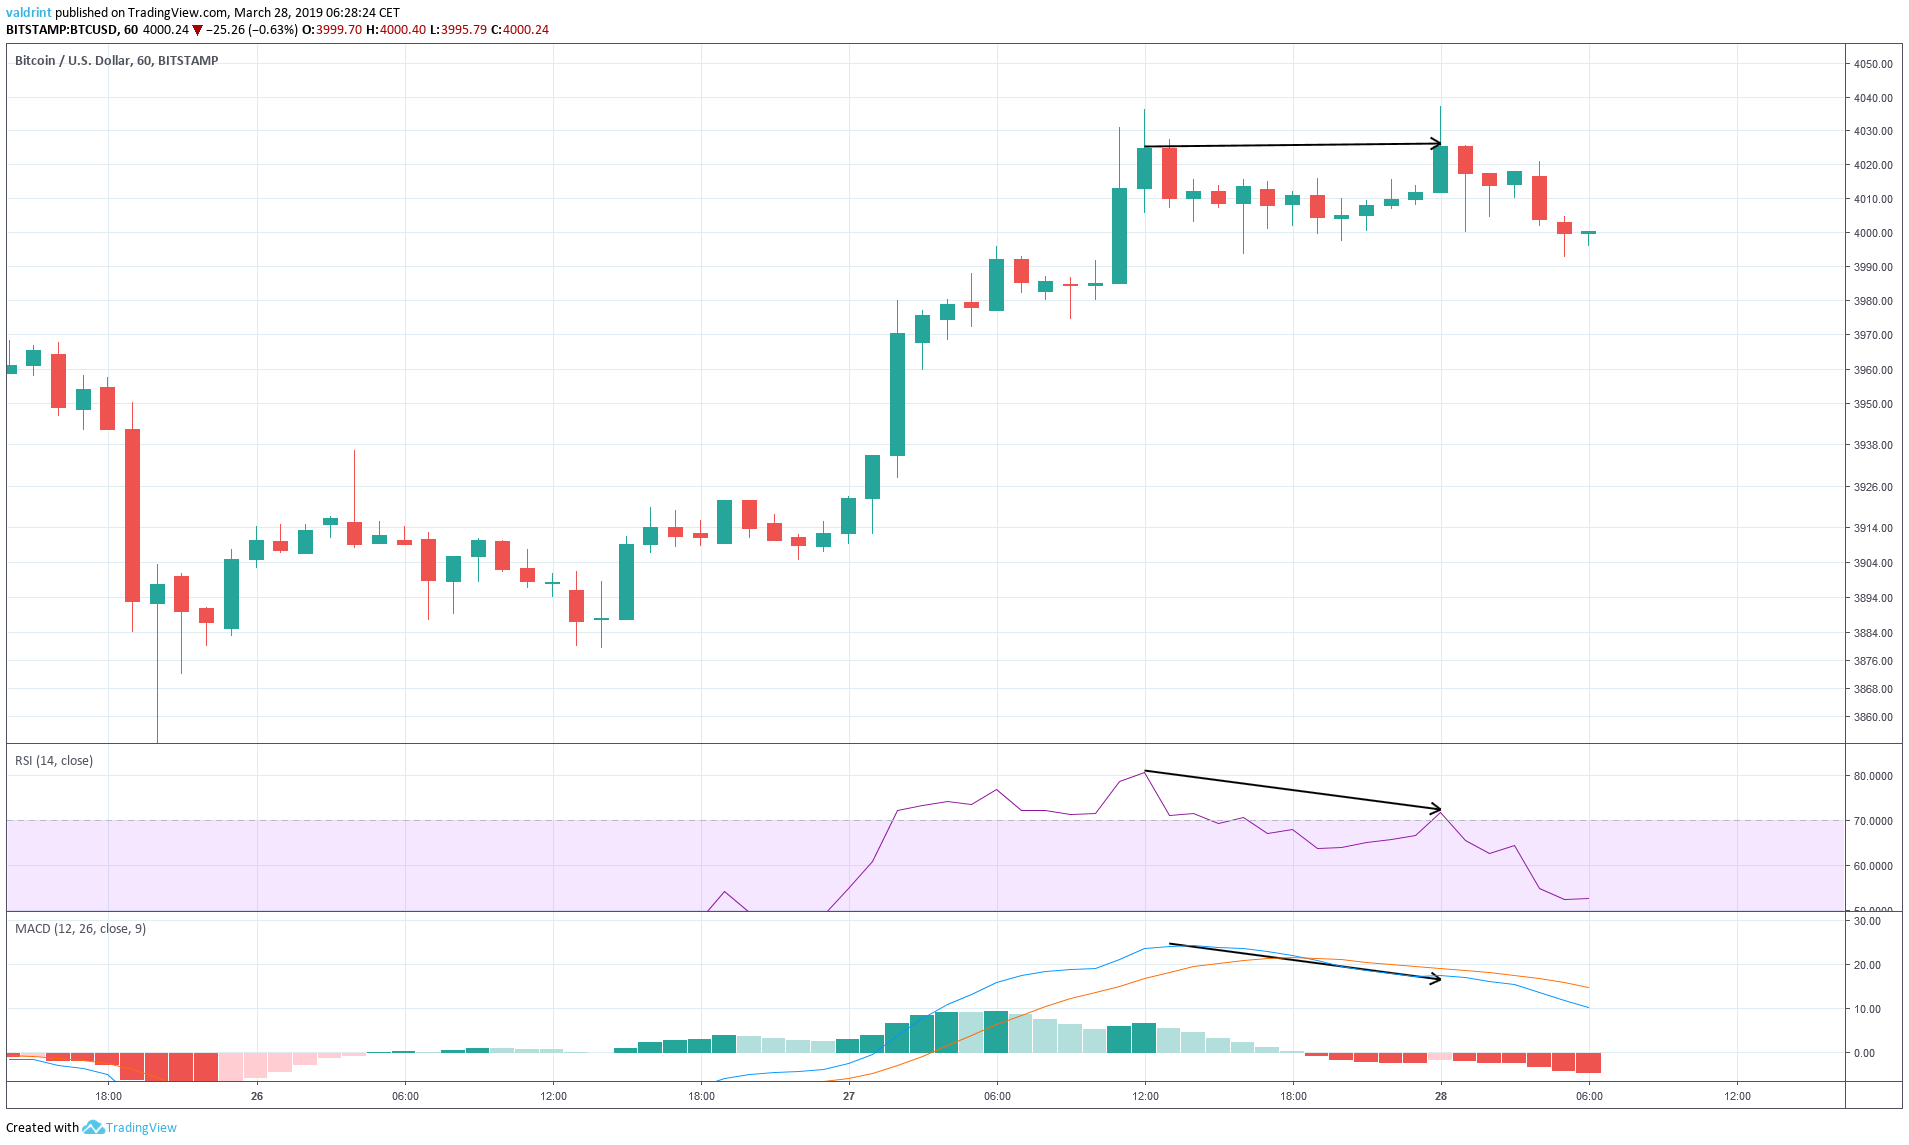
On Mar 27, the price made a high of $4035, before closing at $4025. It acted in an identical manner on Mar 28.
Similarly, the RSI and the MACD made the first high on Mar 27. However, they have proceeded to generate lower values since. This is known as bearish divergence and often precedes price decreases.
In yesterday’s analysis, a similar divergence was observed in the lows of Mar 25 and 26, preceding the price increase.
Based on these indicators and the current position of BTC within the channel, we believe the price of Bitcoin will continue moving closer towards the support line. However, it is possible that Bitcoin will touch and validate the resistance line for the sixth time before dropping.
Reversal Areas
In order to better determine possible future levels of resistance and support, the price of BTC on BitStamp is analyzed at two-hour intervals from Feb 17 to Mar 28.
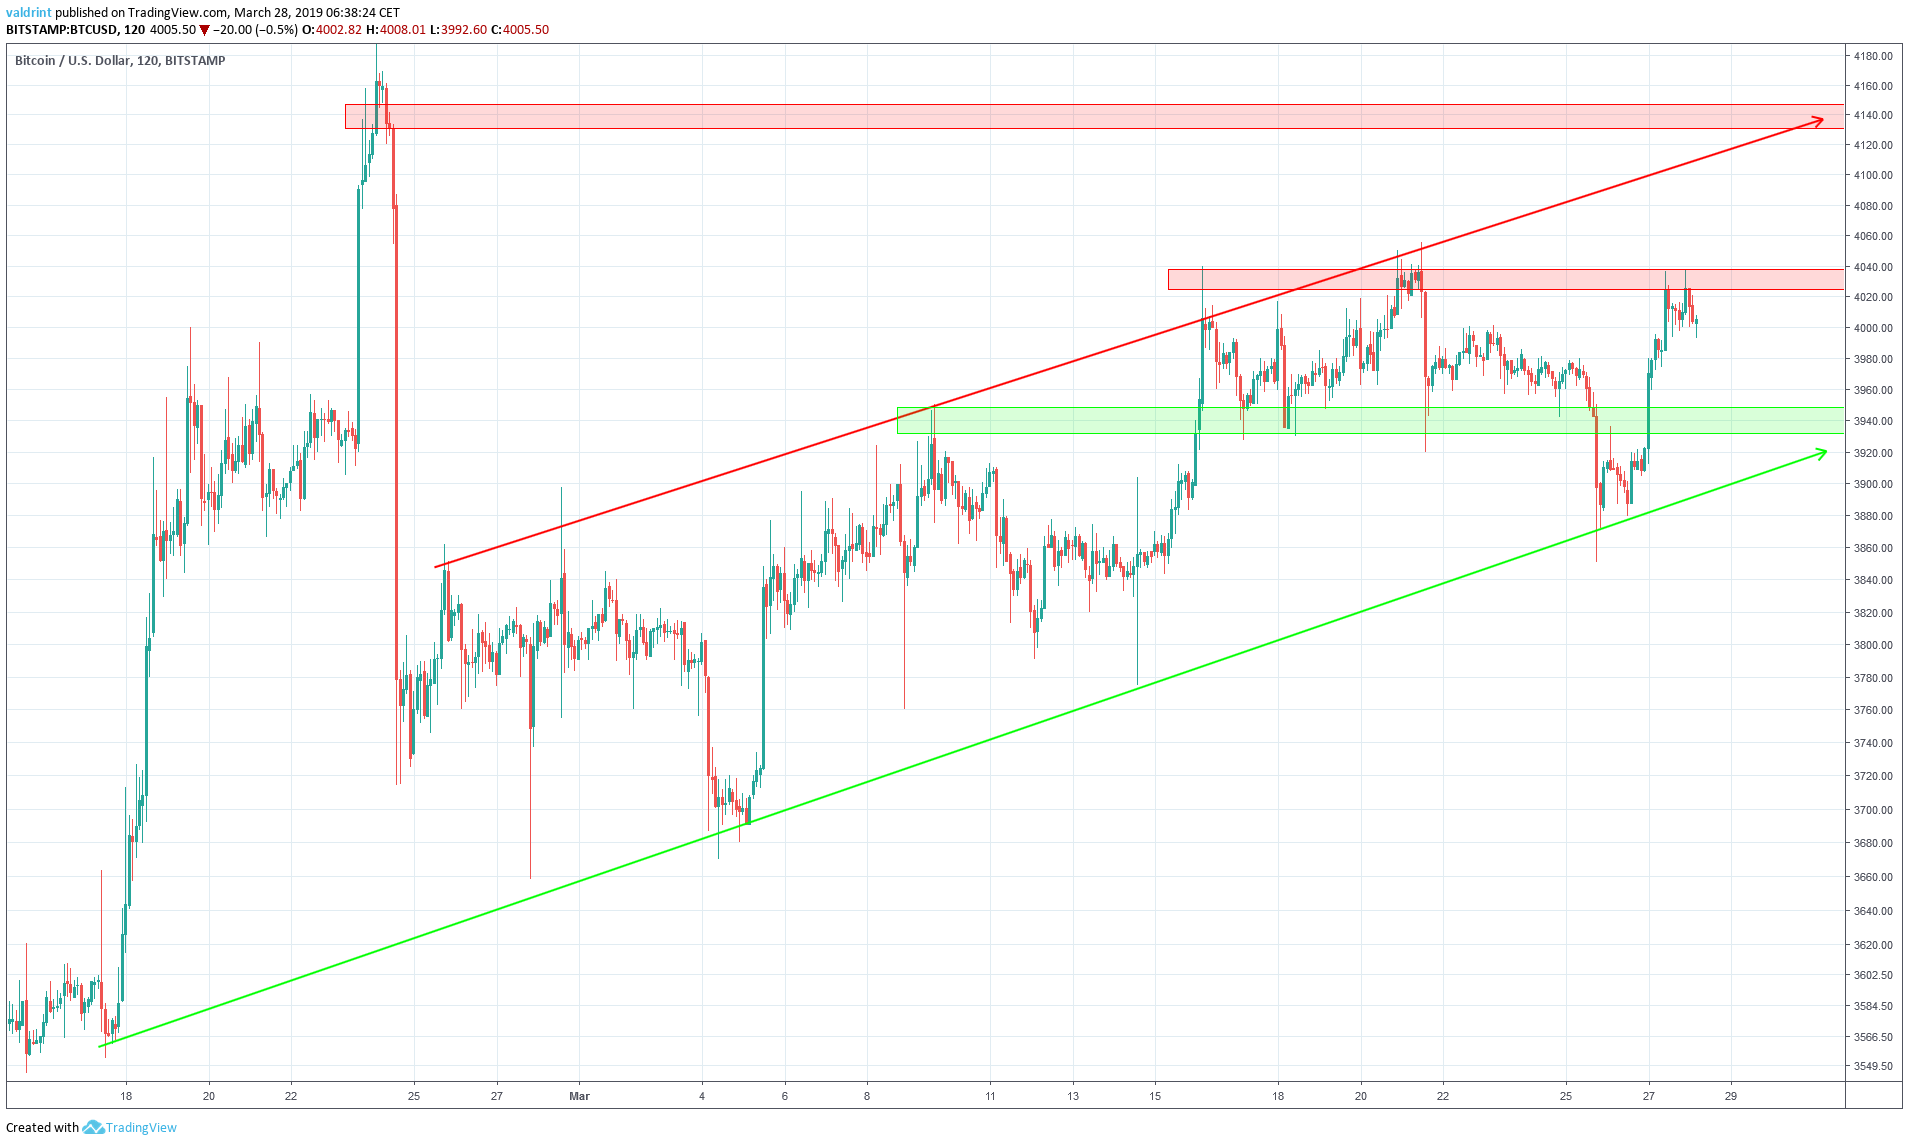
Resistance and support areas are created when the price visits the same level several times. The first resistance area is found near $4030, slightly above where price is currently trading. The next resistance area is found near $4140, coinciding with the top of the channel. According to this analysis, it is possible but not likely that the price reaches the second resistance area.
Bitcoin is currently trading above the first support area at $3940. Continued price drops to this level seem likely.
Summary of Analysis
Based on this analysis, the price of BTC is likely to keep moving inside the confines of the ascending channel with steady, gradual price decreases. It is likely that a drop towards support will follow in the future. However, it is possible that the price touches the resistance line before dropping to support.
Do you think BTC will drop towards the support line of the channel?
Disclaimer: This article is not trading advice and should not be construed as such. Always consult a trained financial professional before investing in cryptocurrencies, as the market is particularly volatile.


