


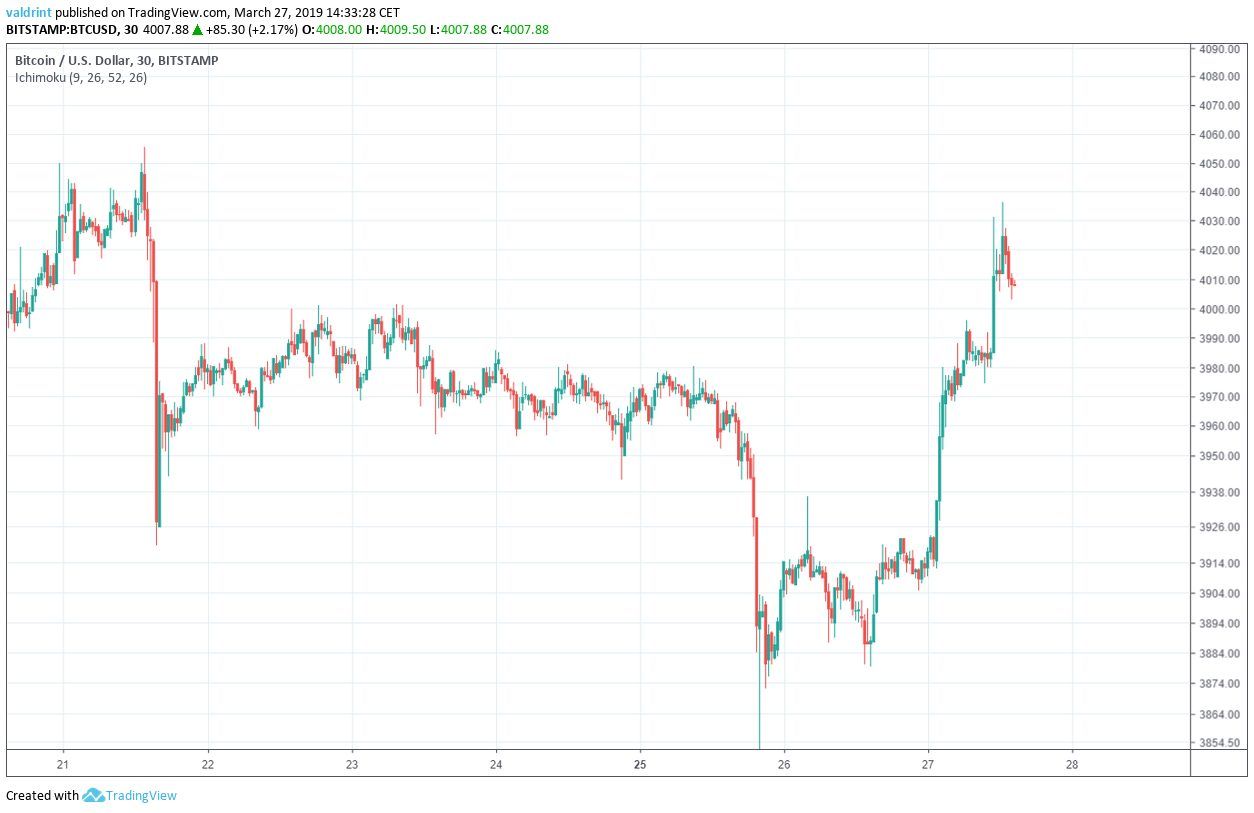
On March 21, 2019, Bitcoin (BTC) made a high of $4055. A sharp drop brought prices to under $3920 hours later.
Prices rebounded with highs over $4000 experienced on Mar 23 and 24. A gradual drop brought prices back down to around $3940 on Mar 26. Within a couple of hours, Bitcoin’s price then plummeted to around $3850.
However, price initiated an upward move on Mar 27 and is currently trading above $4000 but below the March 21 high of $4055.
Is this increase the beginning of a new upward trend? Read below to find out.
Based on today’s analysis, that the price will keep increasing at the rate specified by the upward facing channel defined below. This means that Bitcoin should experience continued volatitlity. Highs and lows, however, should grow successively larger as price gradually increases.
While Bitcoin may drop below $4000 again as it returns to support, eventually prices should stabilize above $4000. Highs and lows above $4000 may become common before the end of the month; however, this point may not be reached until sometime in early or mid-April.
Bitcoin (BTC): Trends and Highlights For March 27, 2019
- The price of Bitcoin has been on a short-term downtrend since Mar 21.
- Rapid price spikes on Mar 27 may have brought the downtrend to an end.
- BTC is trading inside a longer term ascending channel.
- There is bullish divergence developing in the RSI.
- There are support areas near $3840 and $3680 and $3340.
- There is resistance near $4120.
Ascending Support
The price of BTC on BitStamp is analyzed at two-hour intervals from Mar 17 to Mar 27.
On Feb 17, the price made a low of $3553.80. A sharp upward move began. This was followed by a sharp correction. The price has been on a gradual uptrend since, with each low being higher than the previous one.
Tracing these lows gives us an ascending support line:
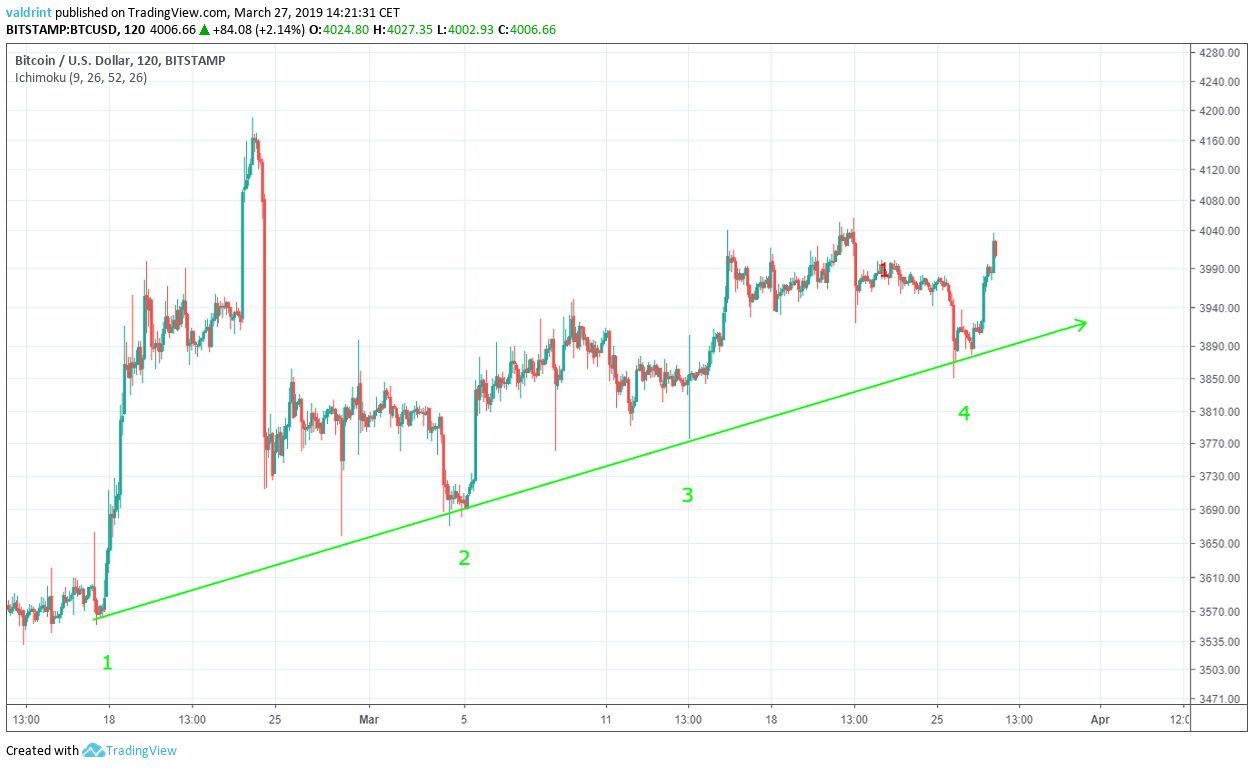
The support line acts as a floor to price, preventing further downward movement. It also measures the rate of increase.
Price has been increasing at the same rate as predicted by the support line.
It is likely that the price keeps increasing at the rate predicted by the support line.
Ascending Channel
On Feb 25, the price made a high of $3861.80. Since then, several market cycles have been completed with each high being higher than the preceding one. Tracing these highs gives us an ascending resistance line.
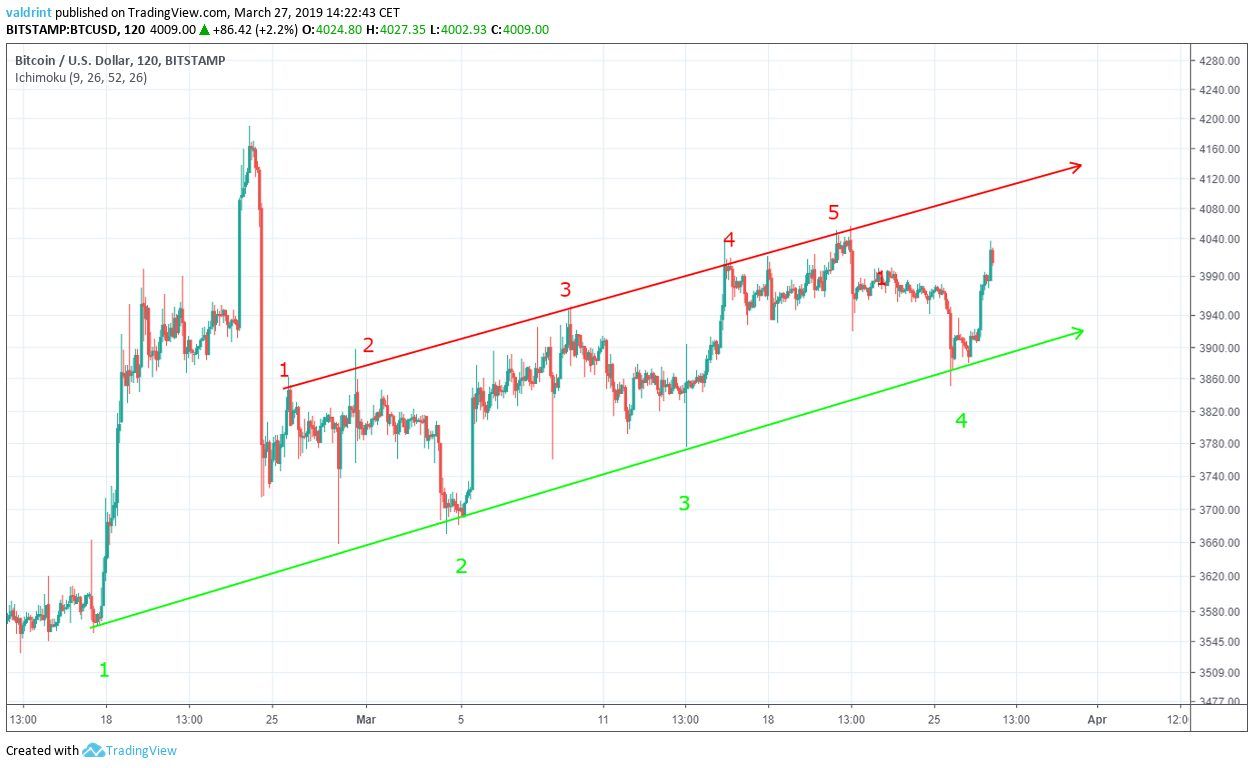
The resistance and support lines combine to create an ascending channel, which is a neutral pattern, making price increases and decreases equally likely within the channel.
Movements above the line such as the wick breakout of $4005 on March 16 can be considered insignificant since they were not supported by continuous movement above the line.
The channel is a better predictor of price fluctuations than support or resistance alone.
It is likely that the price will trade inside the confines of this channel. A breakdown below support or breakout above resistance might cause the trading pattern to alter. This channel cannot predict when or if either of these situations might occur.
Bullish Divergence
The price of BTC on BitStamp is analyzed at two-hour intervals from Mar 21 to Mar 27 with the help of technical indicators.
The relative strength index (RSI) is an indicator which calculates the size of the changes in price in order to determine oversold or overbought conditions in the market.
Combining RSI bullish/bearish divergence with support/resistance essentially predicts price fluctuations.
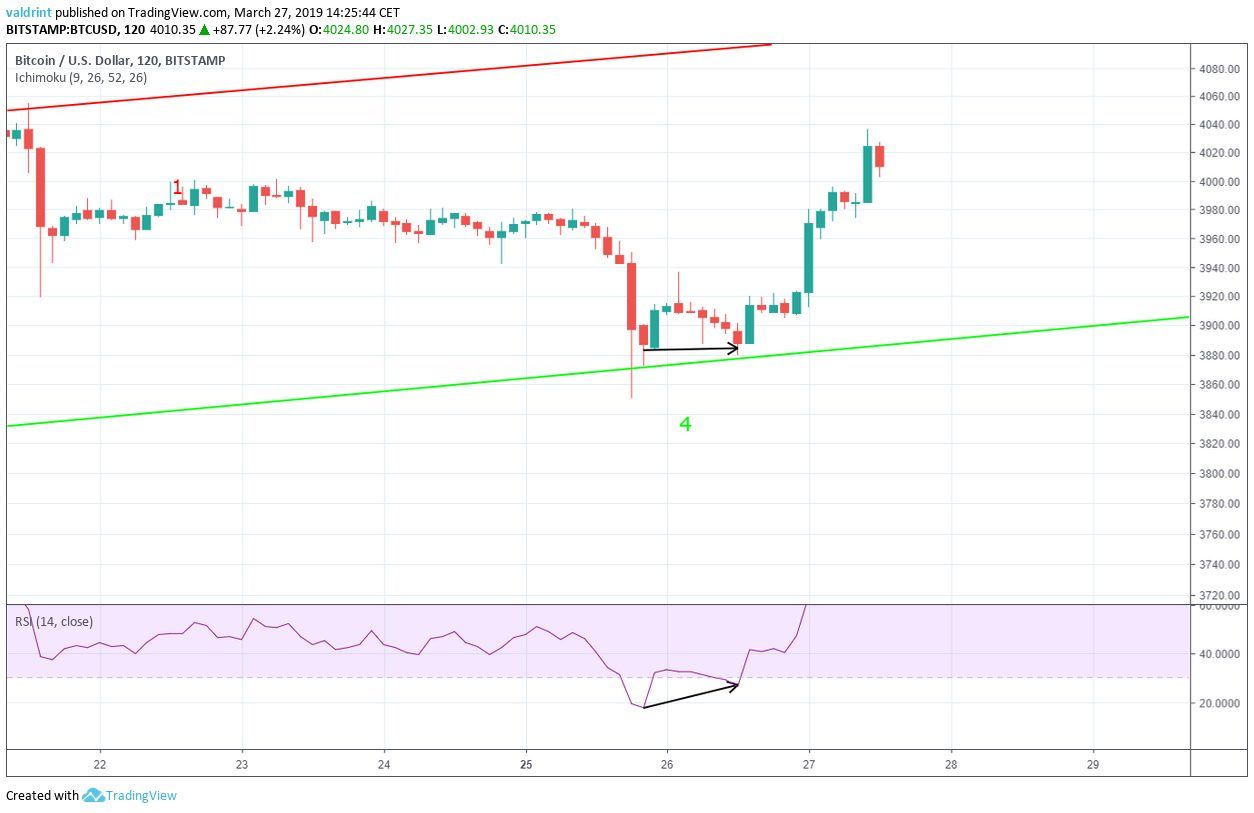
On Mar 25, the price made a low of $3850, before closing at $3886. It reached the same level again on Mar 26.
Similarly, the RSI reached made a low on Mar 25. However, it proceeded to create a higher value on Mar 26.
This is known as bullish divergence and often precedes increases in price. Such increases occurred on Mar 27 as we had predicted. Further highs may be reached, but it is possible.
Following these highs, a sell-off appears likely. In such a case, the price of Bitcoin may begin decreasing in value as RSI moves into oversold territory.
Based on this indicator and the current position of BTC within the channel, we believe the price of Bitcoin will continue moving closer to the resistance before falling toward support. It is possible that Bitcoin will touch and validate the resistance line for the sixth time.
Reversal Areas
In order to better determine possible future levels of resistance and support, the price of BTC on BitStamp is analyzed at one-day intervals from Dec 14, 2018 to Mar 26, 2019.
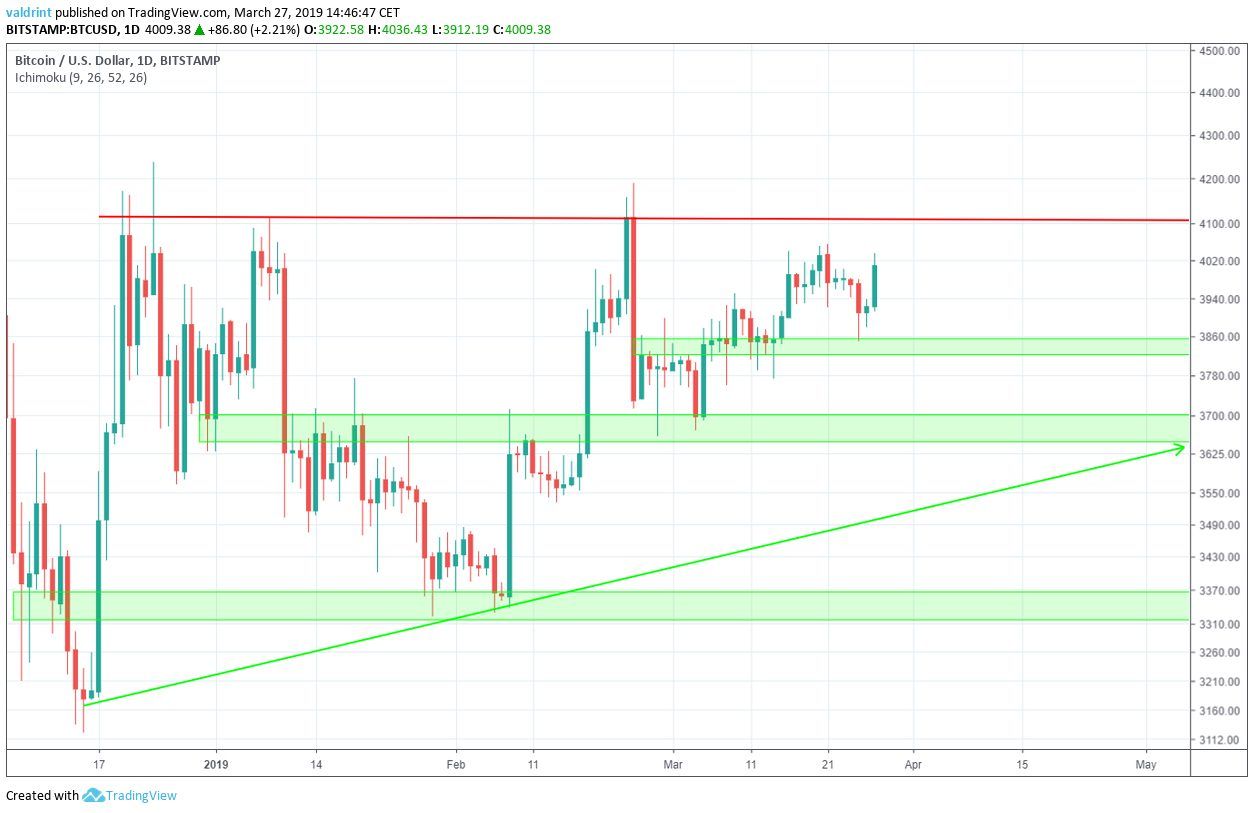
Resistance and support areas are created when the price visits the same level several times. The first resistance area is found near $4120. It is likely that it will eventually reach this area but not necessarily in the near future. Price may drop toward the support areas prior to reaching a $4120 high.
Bitcoin is currently trading above the first support area at $3840. Continued price drops to this level seem possible. If a breakdown commences, prices may drop below this level and move toward the second support of $3680. While prices are likely to drop to or below $3840, a low of $3680 may or may not be reached.
A third support is traced near $3340. It is unlikely that Bitcoin will reach this level in the immediate future.
Summary of Analysis
Based on this analysis, the price of BTC is likely to keep moving inside the confines of the ascending channel with steady, gradual price increases. It is also likely that short-term price increases may continue as Bitcoin moves closer to the resistance line. A drop toward support will likely follow in the near future after a high is reached.
If price increases to resistance before falling to support, the prediction will be fully validated. A nearly immediate price drop without continued gains would partially validate this prediction. Similarly, a breakout with or without a drop back to support would offer partial validation.
However, a breakdown below support would likely invalidate our prediction.
Do you think BTC will eventually breakout from the channel? Let us know your thoughts in the comments below.
Disclaimer: This article is not trading advice and should not be construed as such. Always consult a trained financial professional before investing in cryptocurrencies, as the market is particularly volatile.


