


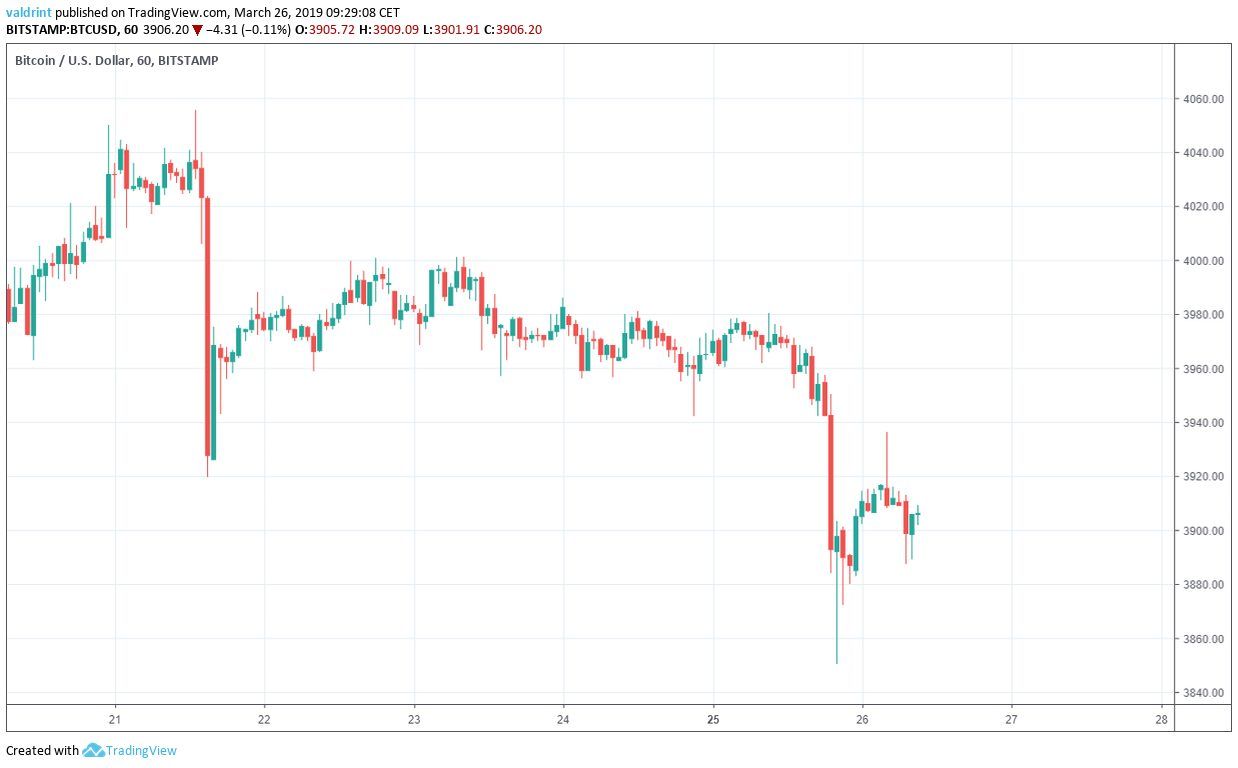
On March 21, 2019, Bitcoin (BTC) made a high of $4055. A sharp drop brought prices to under $3920 hours later.
Prices rebounded with highs over $4000 experienced on Mar 23 and 24. A gradual drop brought prices back down to around $3940 on Mar 26. Within a couple of hours, Bitcoin’s price then plummeted to around $3850.
As Bitcoin’s price continues falling farther below the $4,000 level, should we expect continued losses or will a reversal take Bitcoin above $4000?
Based on today’s analysis, we believe these losses are part of a longer-term upward trend. While Bitcoin has recently suffered price losses, it’s price throughout March has steadily increased. We believe that Bitcoin will continue trading within an upward facing ascending wedge defined below.
Price increases and decrease between the support and resistance lines of the wedge should be expected. However, price decreases in the short term do not invalidate overall long-term gains—which theoretically should continue.
Nonetheless, a breakdown below the current trading pattern remains possible, and this could precipitate rapid price losses. Whether or not the current upward trend will continue requires a more thorough look at Bitcoin’s price over the last several months.
Based on this, we will assess whether or not we should expect movement toward the $4000 mark or away from it.
Bitcoin (BTC): Trends and Highlights For March 26, 2019
- The price of Bitcoin has been on a downtrend since Mar 21 after breaking down from a horizontal channel.
- Bitcoin is, however, trading inside a longer term ascending channel.
- There are support areas near $3840 and $3680 and $3340.
- There is resistance near $4120.
Previous Movement
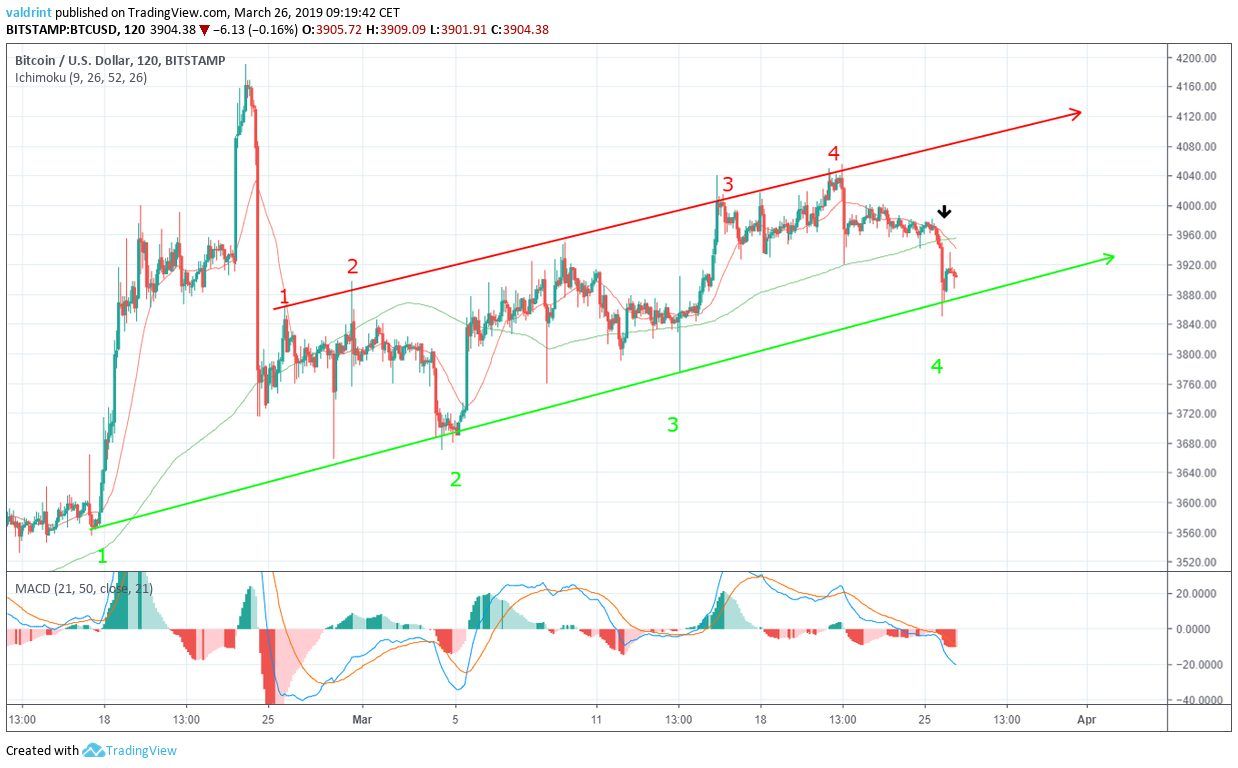
The price of BTC on BitStamp is analyzed at one-hour intervals from Mar 21 to Mar 26 along with trading volume.
Volume is a measure of how much of a certain asset is traded in a certain period of time
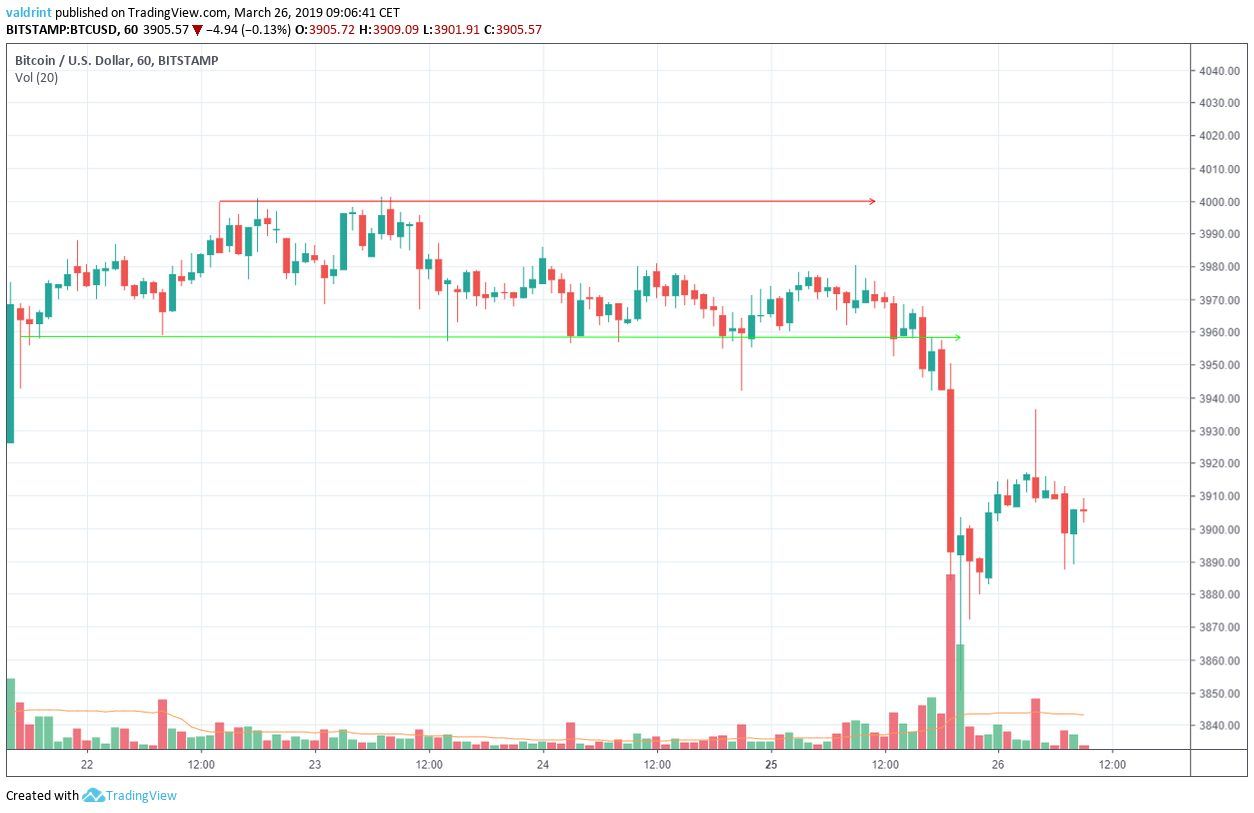
As described in our previous analysis, Bitcoin was trading inside a horizontal channel. A support line was traced around $3960 while resistance was traced near $4000.
A breakdown from the channel occurred on Mar 25 as we had predicted. A rapid price loss led Bitcoin to a low of $3850 for the day.
This drop was combined with above-average volume—validating the movement. In other words, the high trading volume correlates to rapid price fluctuations. As prices have recovered to over $3900, trading volume has decreased and moved toward normal levels.

As trading volume decreases and price settle, new long-term trading patterns are emerging. New support and resistance lines for this pattern are defined and traced in the following sections:
Horizontal Support
The price of BTC on BitStamp is analyzed at two-hour intervals from Feb 17 to Mar 26.
On Feb 17, the price made a low of $3553.80. A sharp upward move began. This was followed by a sharp correction. The price has been on a gradual uptrend since, with each low being higher than the previous one.
Tracing these lows gives us an ascending support line.
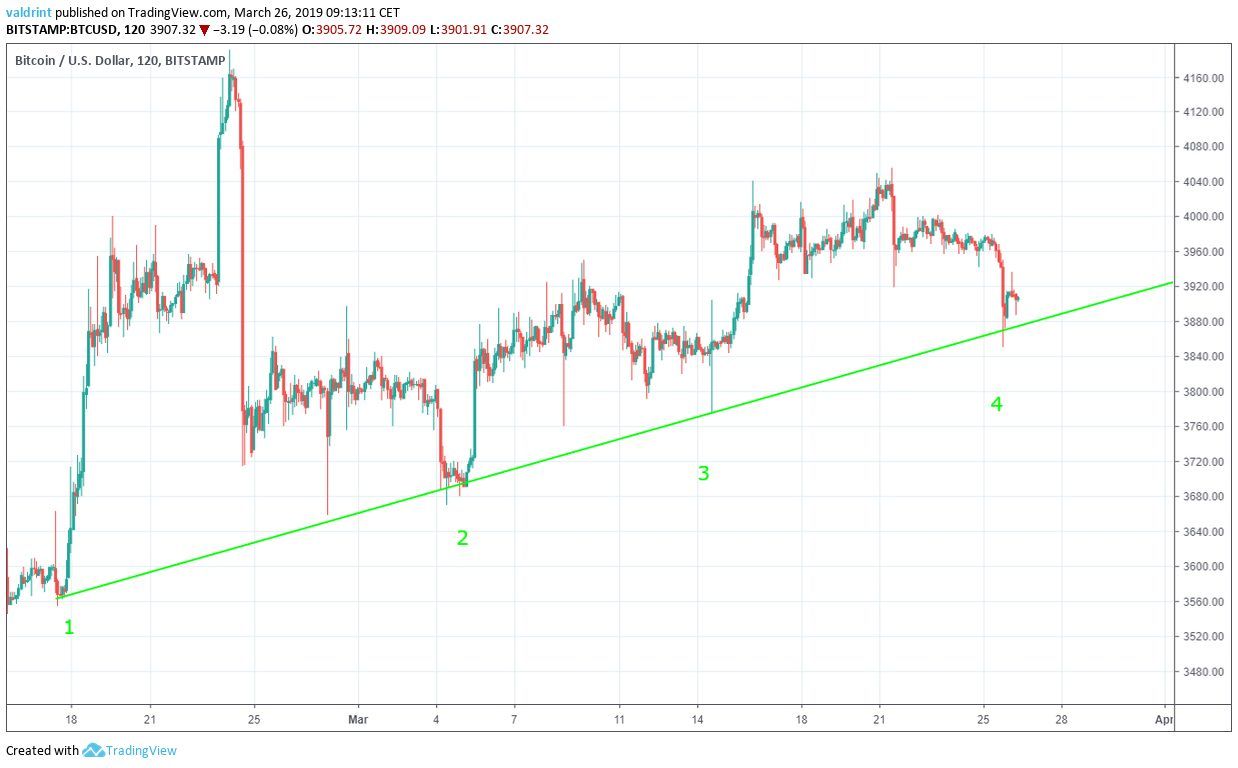
The support line acts as a floor to price, preventing further downward movement. It traces the theoretical lower limits of the price and measures an asset’s rate of growth.
The price has increased at the same rate as predicted by the line. It is unlikely that the price trades below these levels.
On the contrary, it is more likely that Bitcoin’s price will keep increasing at or above the rate determined by the support.
Ascending Channel
On Feb 25, the price made a high of $3861.80. Since then, several market cycles have been completed with each high being higher than the preceding one. Tracing these highs gives us an ascending resistance line.
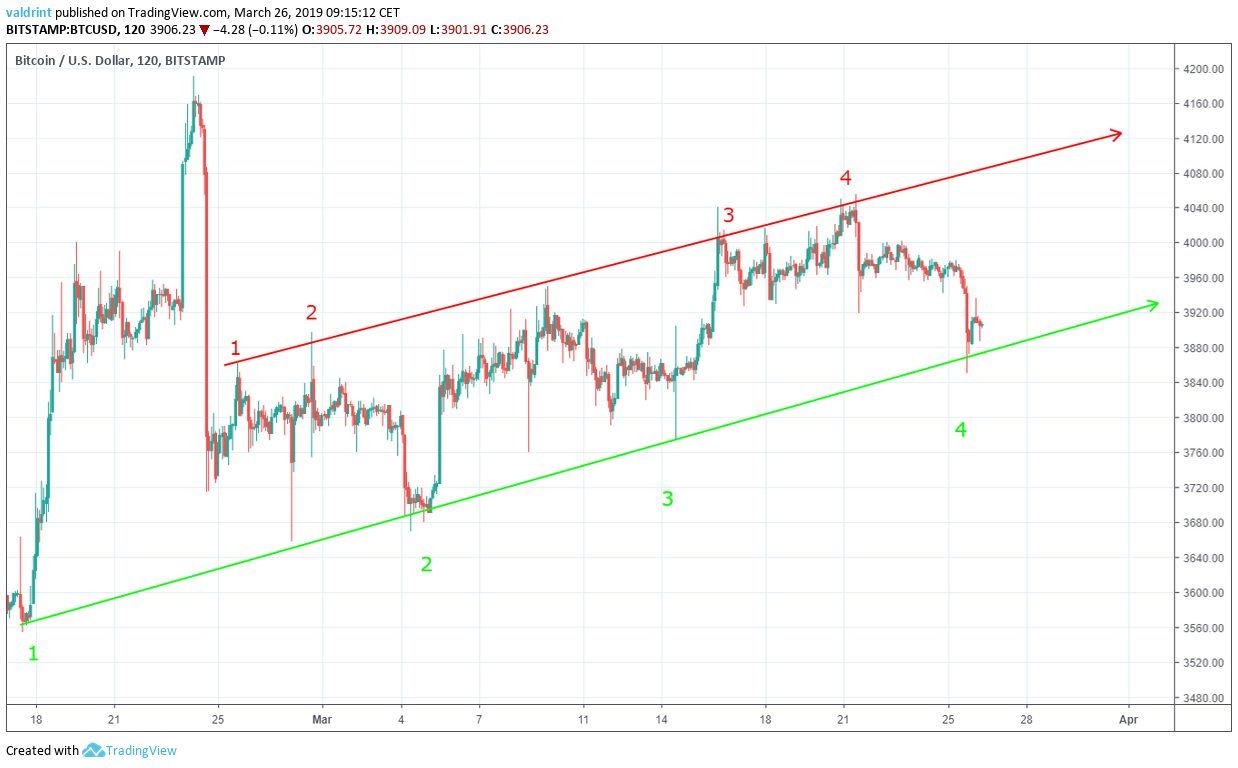
Similar to the support line, the resistance line can act as a ceiling to price, preventing further upward movement.
The resistance and support lines combine to create an ascending channel, which is a neutral pattern, making price increases and decreases equally likely within the channel.
Movements above the line such as the wick breakout of $4005 on March 16 can be considered insignificant since they were not supported by continuous movement above the line.
The channel is a better predictor of price fluctuations than support or resistance alone.
It is likely that the price will trade inside the confines of this channel until a breakdown or breakout occurs.
Signal Triggered
The moving average convergence divergence (MACD) is a trend indicator that shows the relationship between two moving averages (long and short-term) and the price. It is used to measure the strength of a move.
Combined with simple moving averages (SMA), MACD can be used as a trigger for buy and sell signals. Signals are triggered whenever the MACD line is above 0 and the price is above the 21 (red) and 50-period (green) SMAs.
These movements may indicate that the current trend is over and a new downtrend is beginning.
Using these indicators, it is likely that the price trades close to the support line and possibly breaks down. Current price losses may be the beginning of greater losses.
Reversal Areas
In order to better determine possible future levels of resistance and support, the price of BTC on BitStamp is analyzed at one-day intervals from Feb 9 to Mar 26, 2019.
Resistance and support areas are created when the price visits the same level several times.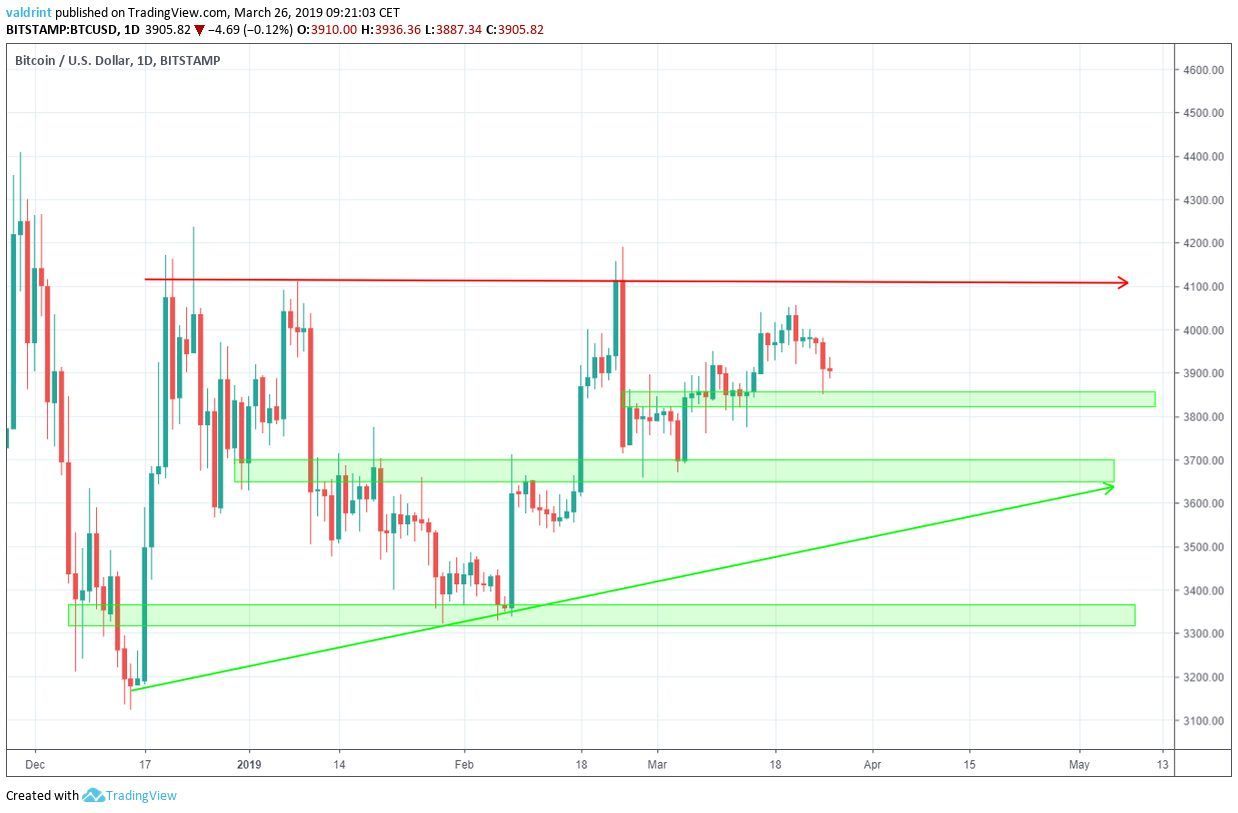
Bitcoin is currently trading above the first support area at $3840. Continued price drops to this level seem likely. If a breakdown commences as indicated by the MACD and SMA, prices may drop below this level and move toward the second support of $3680. We believe this to be a likely scenario, though it is not certain if this support area will be reached before prices rebound. While prices are likely to drop to or below $3840, a low of $3680 may or may not be reached.
A third support is traced near $3340. It is unlikely price will reach this level in the immediate future.
Summary of Analysis
Based on this analysis, the price of BTC is likely to keep moving inside the confines of the ascending channel with upward movement toward the resistance line appearing unlikely. What appears more likely is continued price decreases toward the first and possibly second support levels. Lows below $3840 may be expected in the near-future.
If the price trades below $4000 and is close to the support line, this prediction will be partially validated. If it eventually breaks down to or below $3840, it will be fully validated. A breakout above the resistance line would invalidate the prediction.
Do you think BTC will rebound and start an upward move? Let us know your thoughts in the comments below.
Disclaimer: This article is not trading advice and should not be construed as such. Always consult a trained financial professional before investing in cryptocurrencies, as the market is particularly volatile.


