


Binance Coin (BNB) is gearing to extend its seven-day gains. Readings from the coin’s price movements on a one-day chart reveal that it has broken above the descending channel within which it has traded since early June.
If this breakout is successful, the fourth cryptocurrency by market capitalization will trade at a monthly high of $598.90.
Binance Coin Bulls Pushes For More
BNB’s price decline since the beginning of June has led to a descending channel formation. This pattern is formed when an asset’s price consistently forms lower highs and lower lows, creating a downward-sloping channel on a chart. This bearish pattern indicates that sellers have control, and the asset’s price may continue to fall if it remains within the channel.
Since it began trending within this channel, its price has dropped by 17%. However, with a surging bullish bias toward the altcoin following the general market decline of August 5, BNB has broken above this bearish channel.
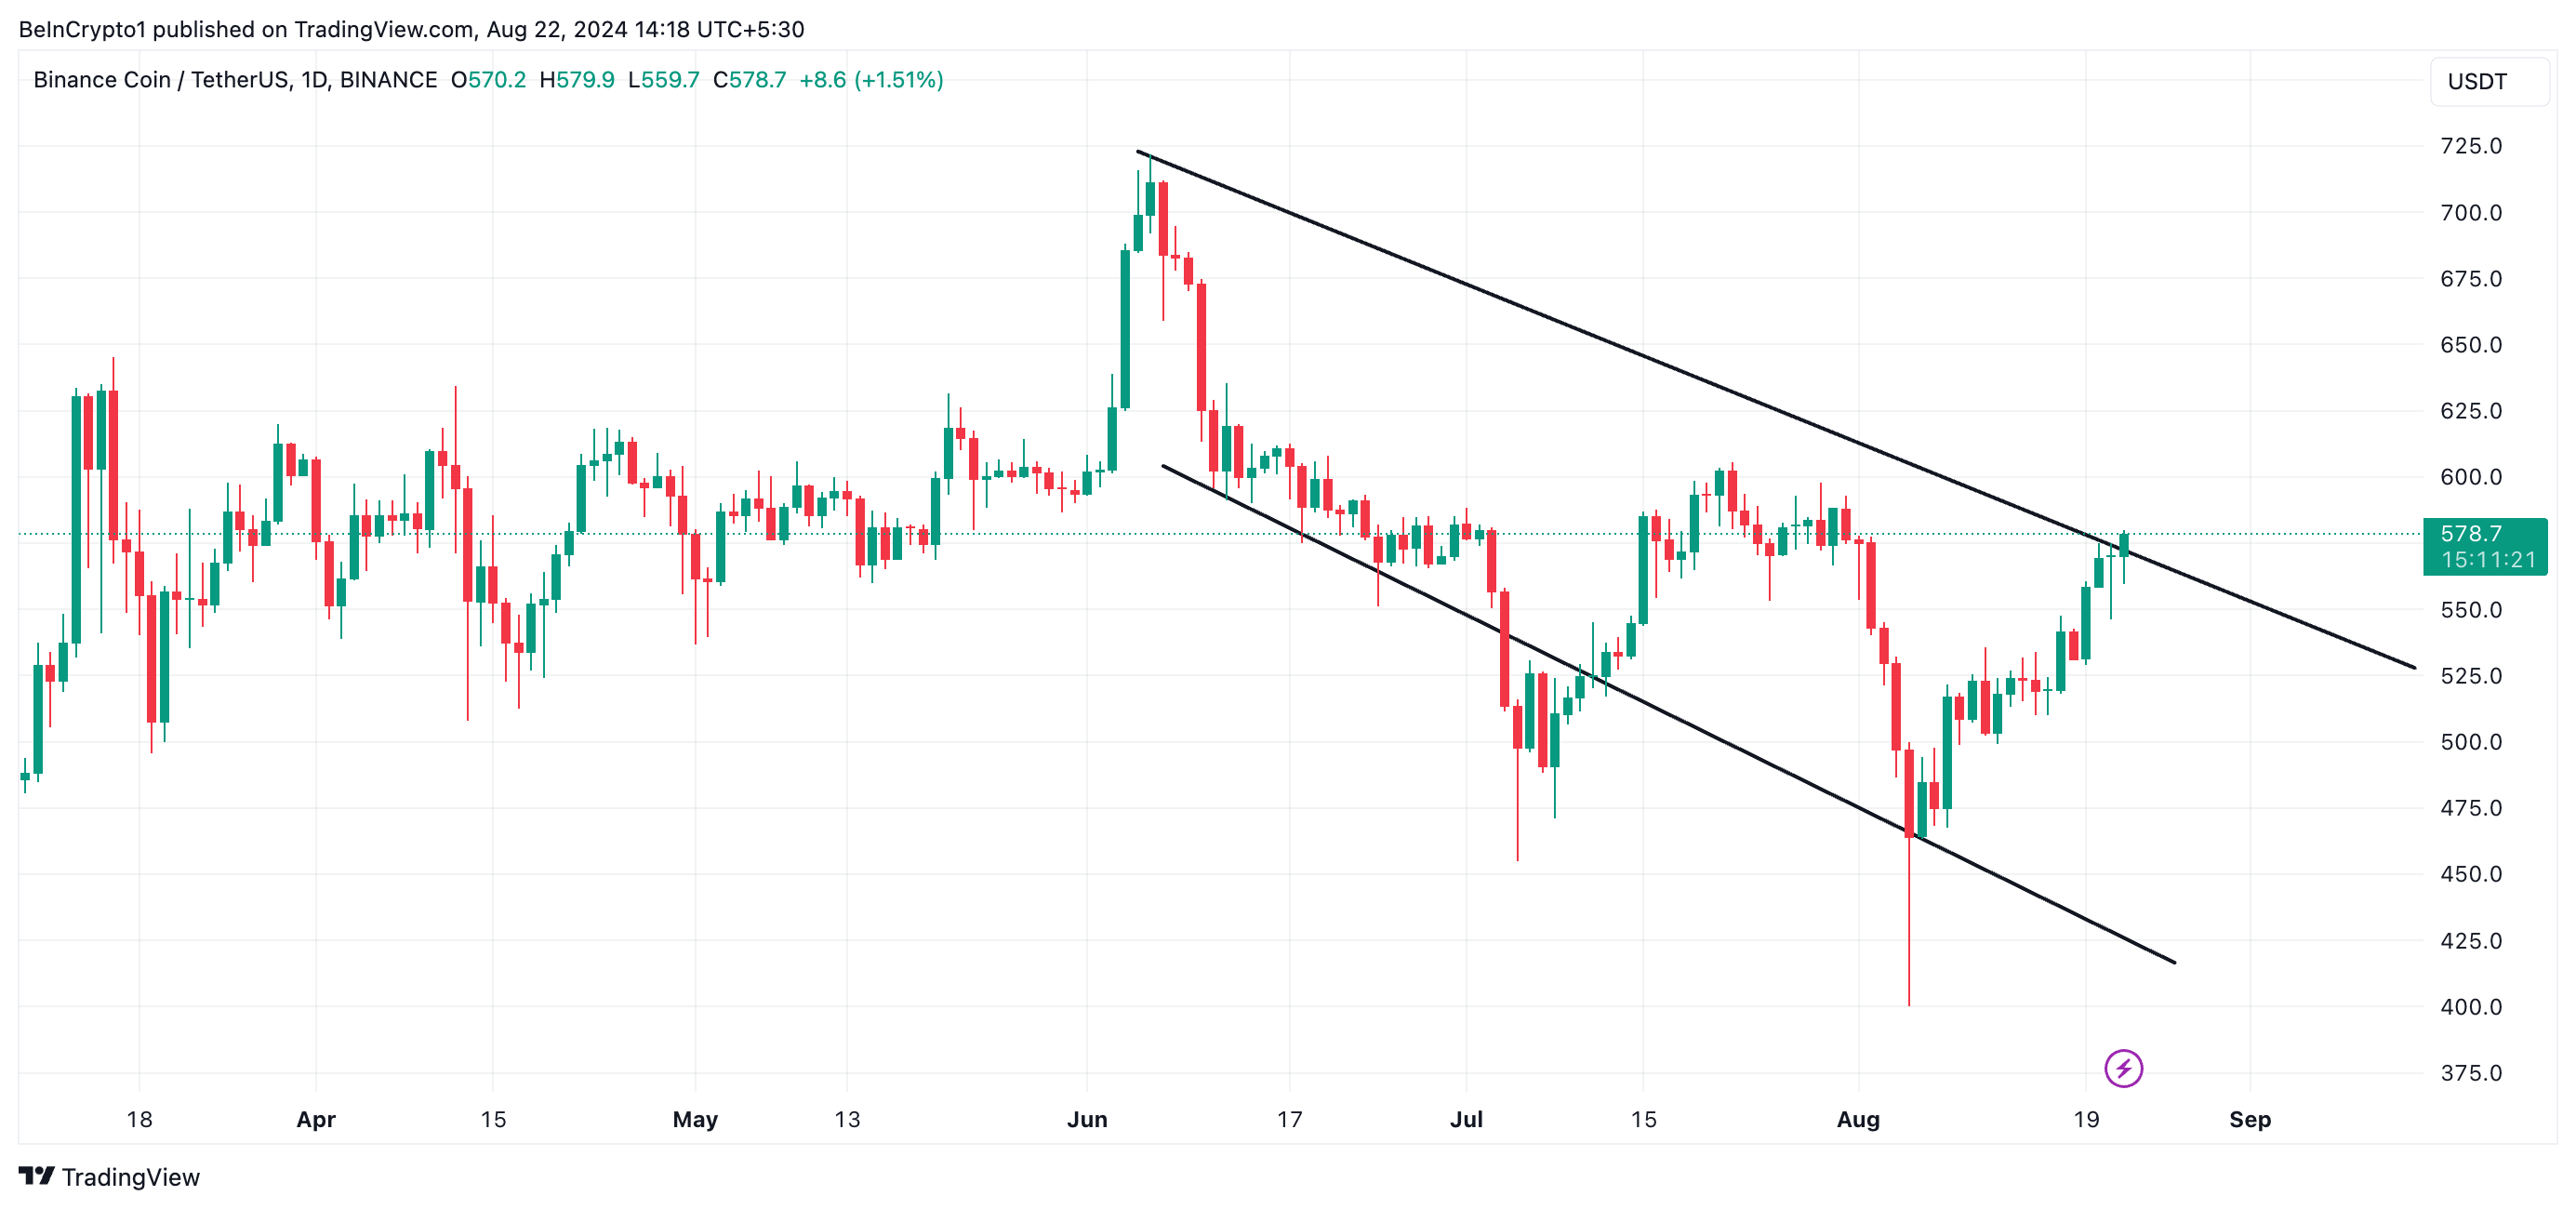
When an asset’s price nears the upper line of a descending channel, it suggests weakening downward momentum. A successful breakout signals a shift from bearish to bullish sentiment, with market control moving from sellers to buyers. Traders often interpret this as a continuation of an uptrend.
For BNB, the technical setup on its one-day chart supports this outlook. The Moving Average Convergence Divergence (MACD) indicator shows the MACD line (blue) positioned above both the signal and zero lines (orange). This is a bullish signal, indicating sustained buying pressure and upward momentum.
The MACD, which tracks price trends, direction, and momentum changes, typically confirms bullishness when the MACD line is above both the signal and zero lines. This setup suggests that BNB is currently in an uptrend.
Further supporting this outlook, BNB is trading above the Leading Span A of its Ichimoku Cloud and is approaching the Leading Span B. This position within the Ichimoku Cloud indicates that the market is in a bullish phase, with potential for continued upward movement.
Read more: Binance Coin (BNB) Price Prediction 2024/2025/2030
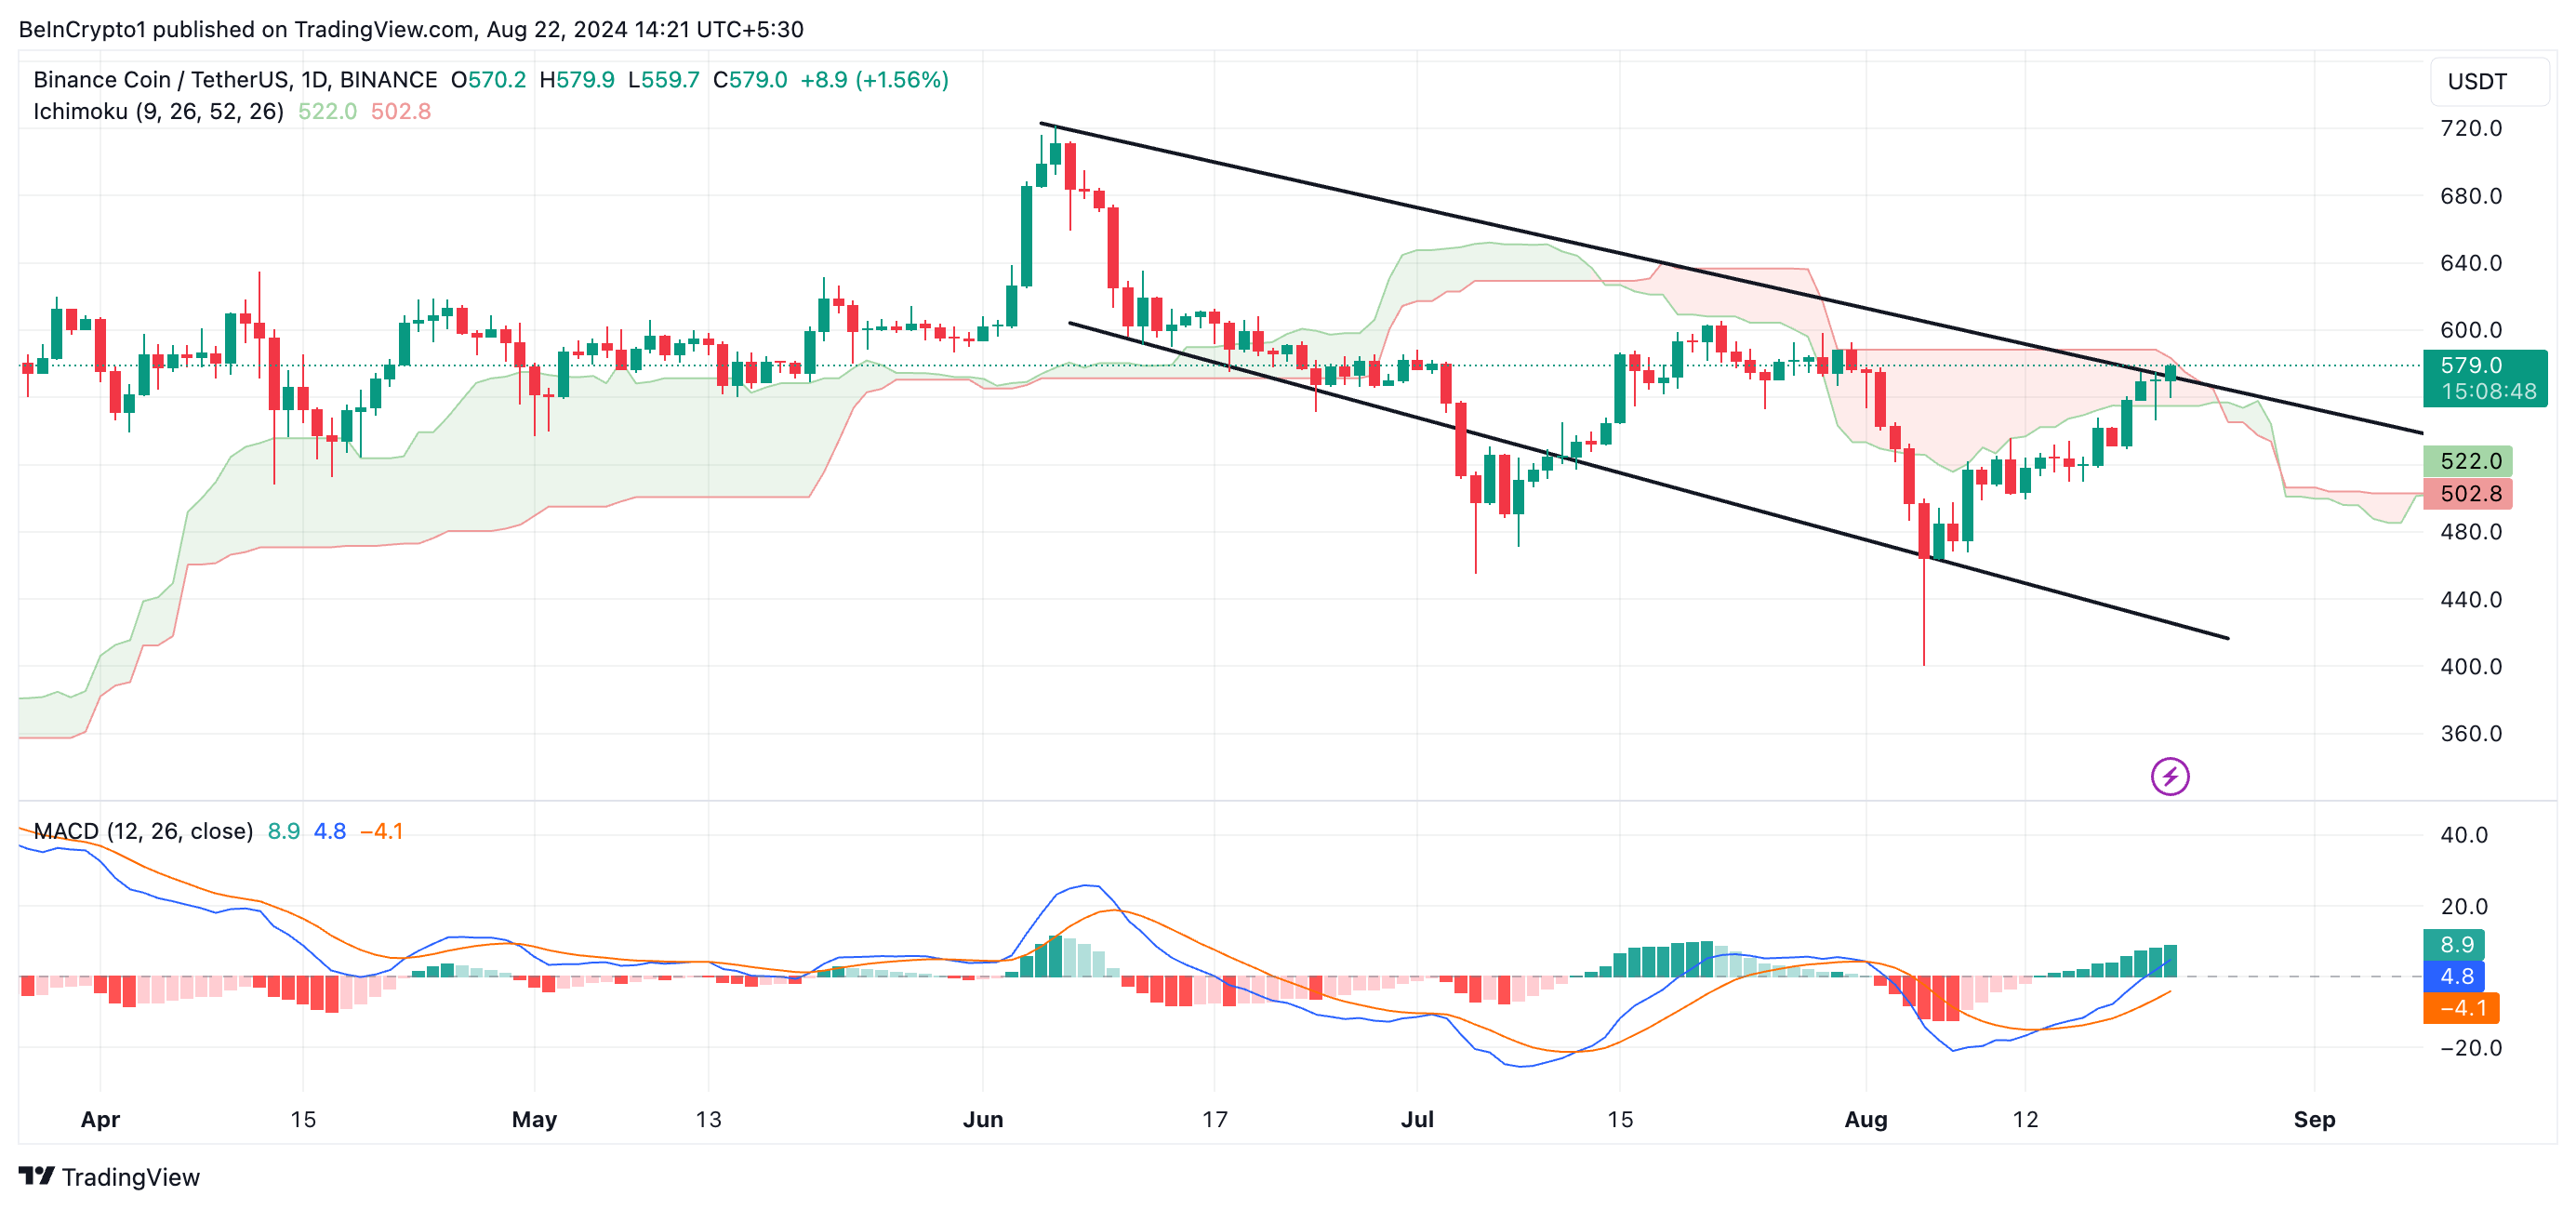
Leading Span A and Leading Span B are key components of the Ichimoku Cloud, an indicator that identifies trends, support, resistance levels, and potential market reversals. While it rests above the Leading Span A, BNB’s successful break above the Leading Span B will signal a continuation of the bullish trend.
BNB Price Prediction: Coin Remains at Risk of Swings
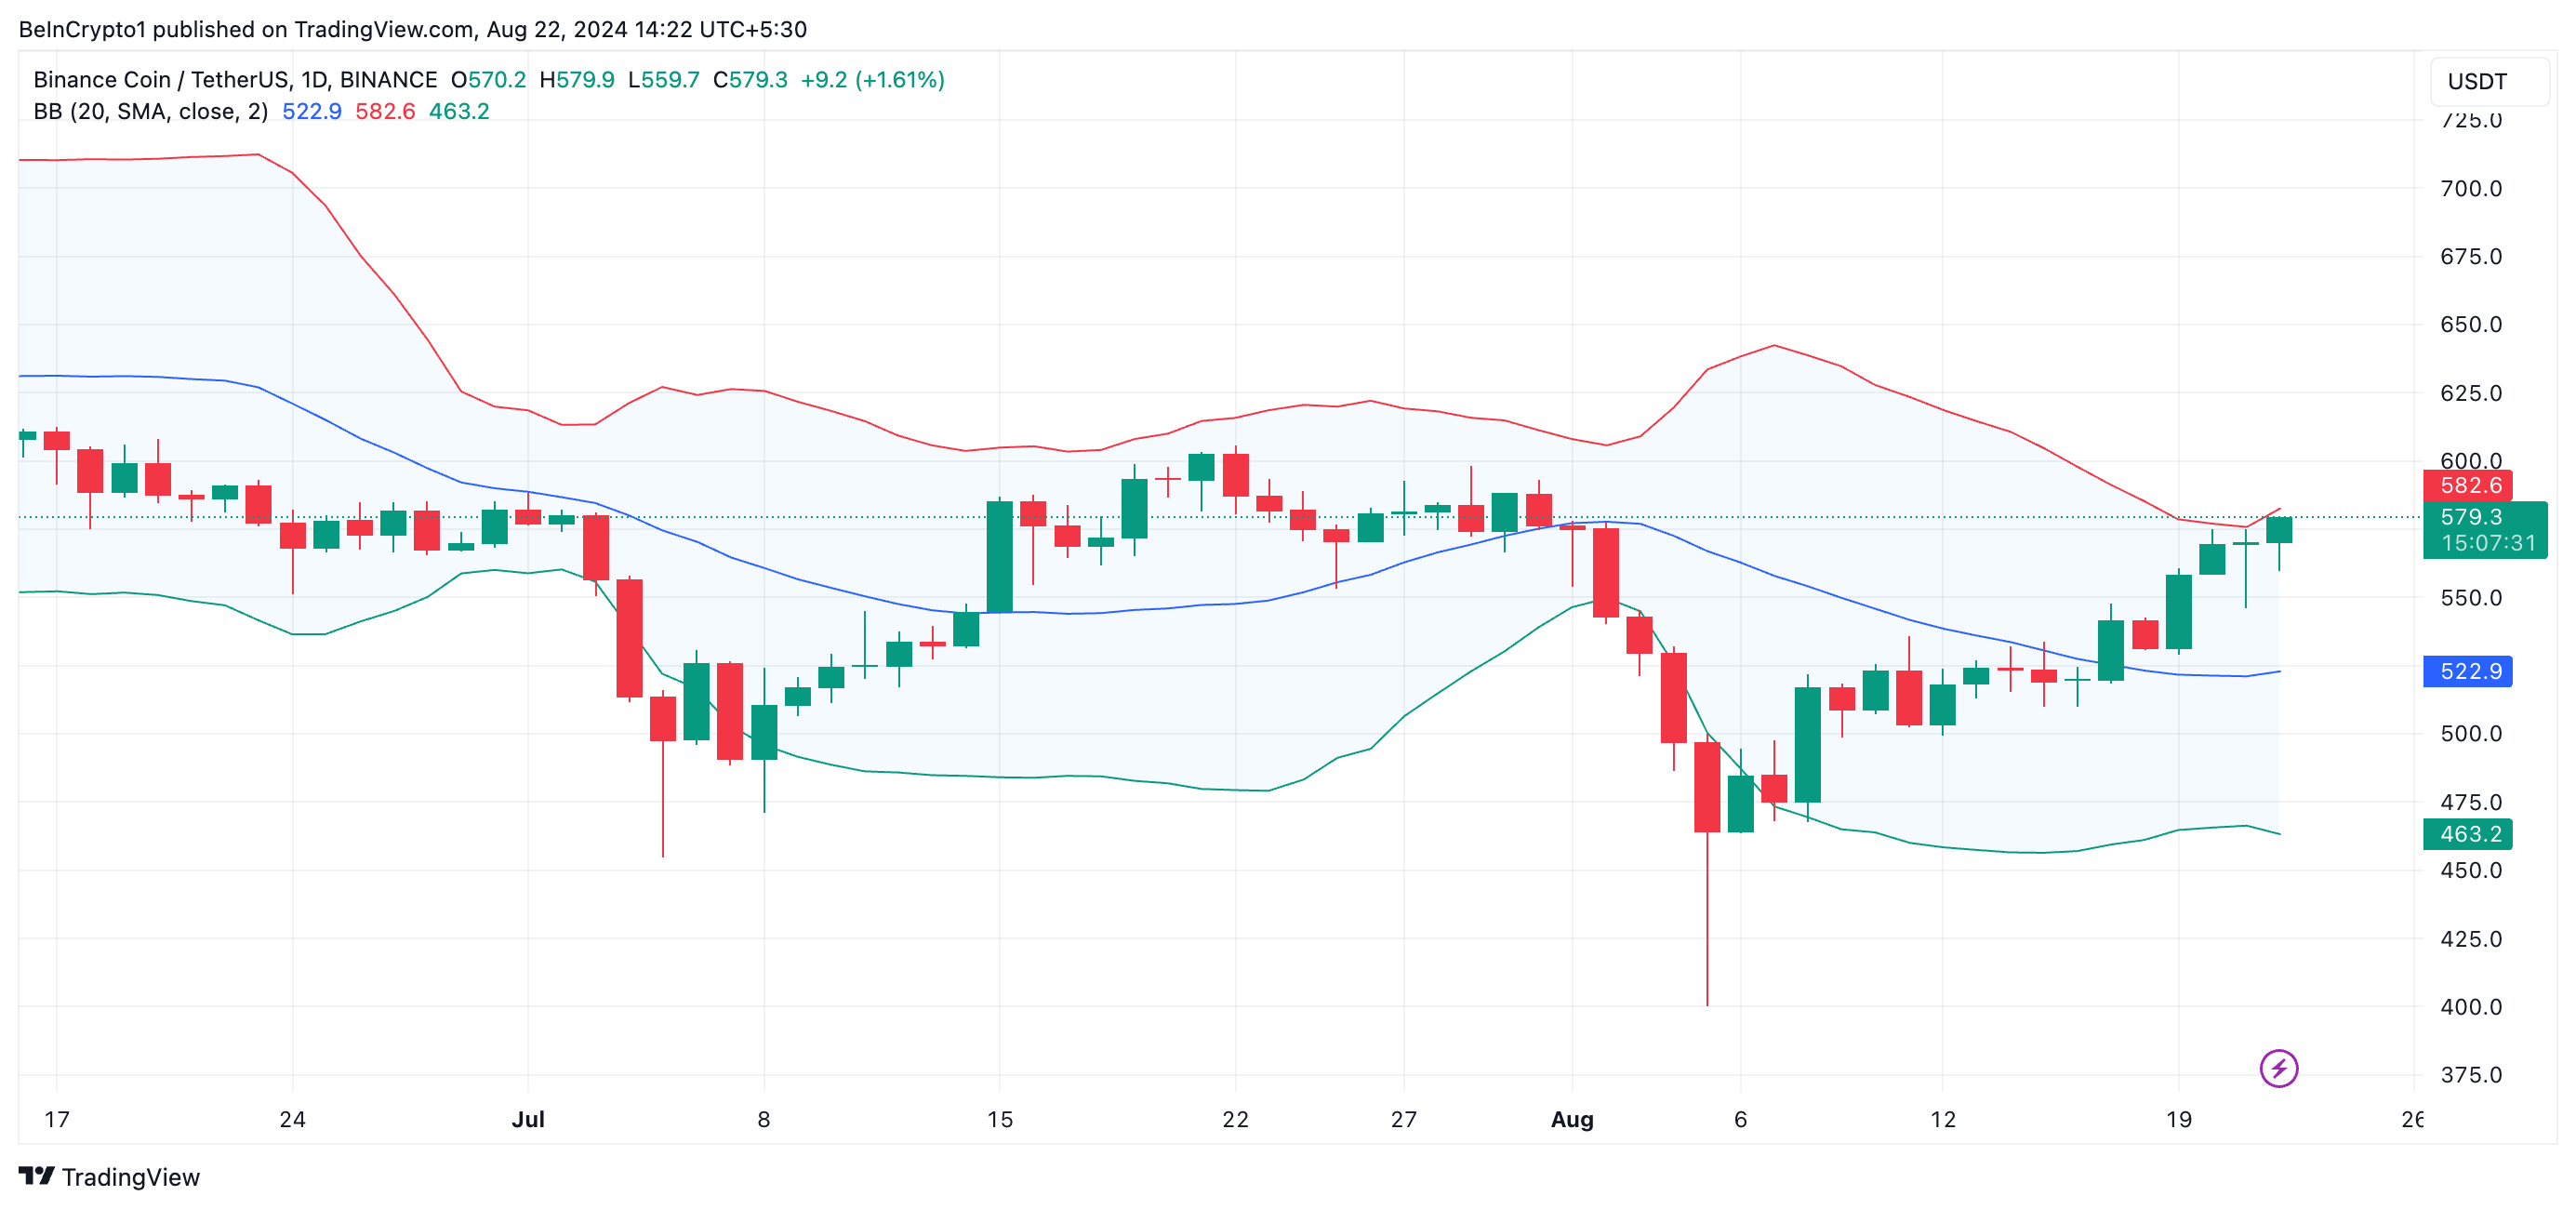
While BNB’s current technical setup is bullish, growing market volatility puts it at risk of swings in either direction. This is gleaned from the widening gap between the upper and lower bands of its Bollinger Bands indicator.
An asset’s BB indicator measures market volatility and identifies potential overbought or oversold conditions. The upper band represents the higher range of an asset’s price movements, while the lower band tracks the lower range. When the gap between these bands widens, it suggests that market volatility has increased.
BNB maintains a bullish bias from its holders, as indicated by its positive weighted sentiment on-chain, currently at 1.87. This metric measures the market’s overall sentiment regarding the asset.
When the value is above zero, it shows that most online mentions, news, and social media discussions are optimistic. A positive weighted sentiment is often a precursor to continued price growth.
Read more: How To Trade Crypto on Binance Futures: Everything You Need To Know
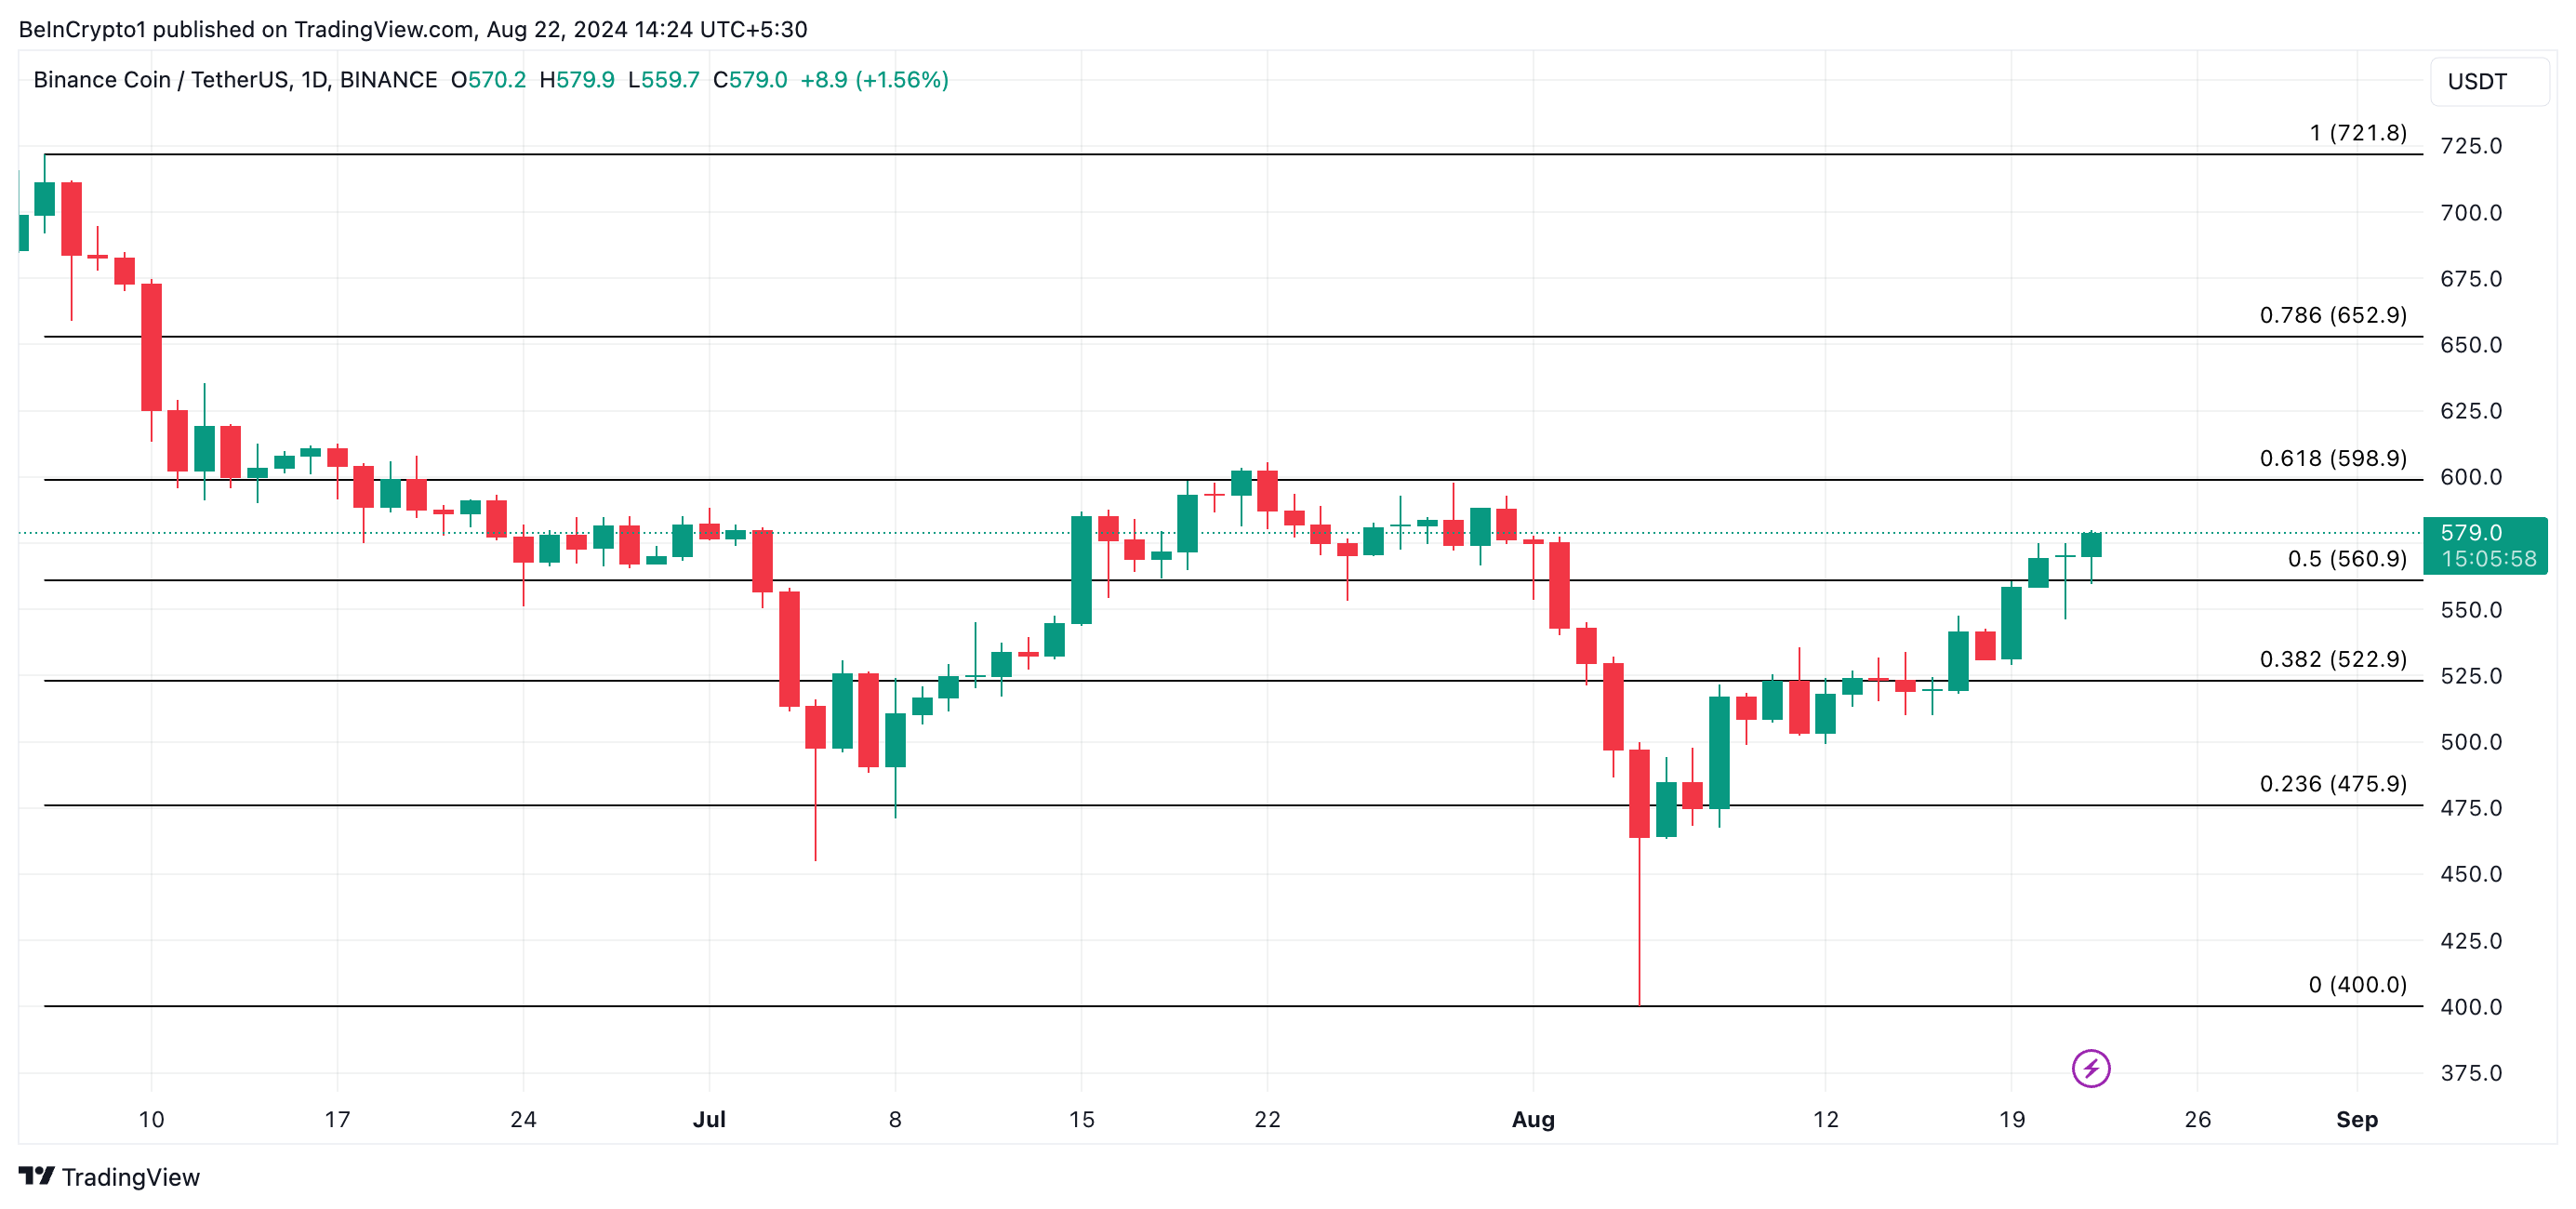
If this bullish sentiment holds, BNB’s price could rally to a one-month high of $598.90. The ongoing optimism from holders suggests sustained confidence in the asset, potentially driving further upward momentum in the near term.
However, if the trend reverses and the bears re-emerge to reclaim control, the coin’s price may drop to $560.90.


