


After validating the previous breakout level, Binance Coin (BNB) reached a new all-time high on Feb. 2, 2021.
While the trend is clearly bullish for the Binance Coin-USD pair, it’s not yet clear if BNB/BTC has begun a bullish reversal.
Binance Coin Breakout Leads to All-Time High
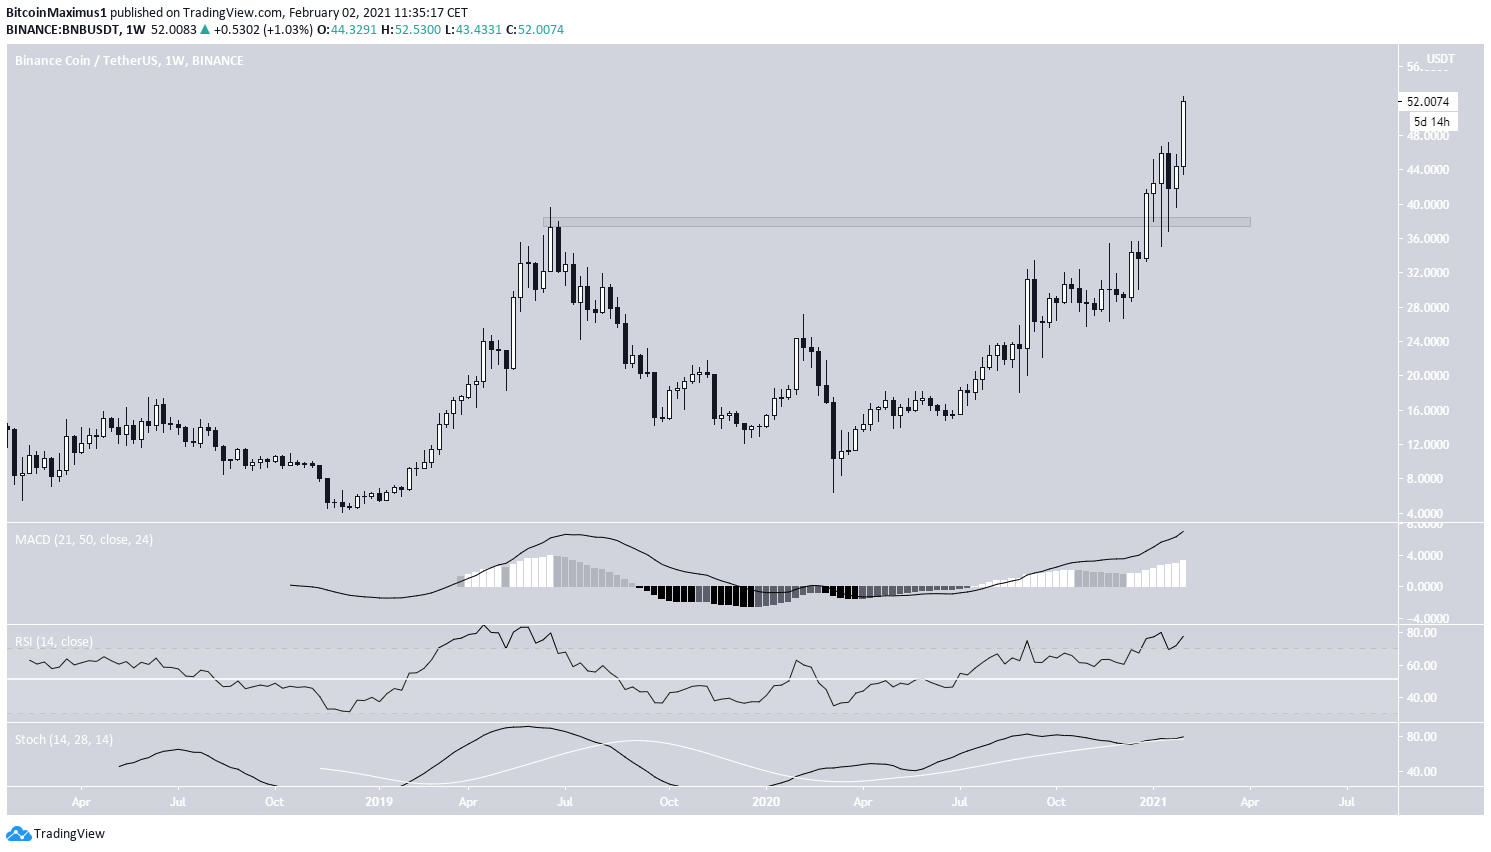
While BNB has been moving upwards since March 13, 2020, it failed to clear the all-time high resistance of $38 until January 2021.
BNB validated the $38 level as support, before resuming its upward movement.
So far, BNB has reached an all-time high price of $52.53 on Feb. 2.
Technical indicators in the weekly time-frame are bullish, supporting the continuation of the upward movement.
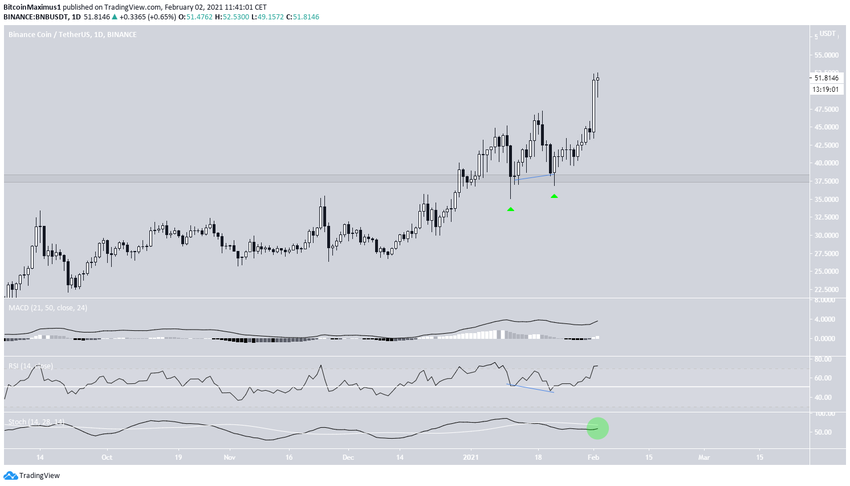
The readings from the daily time-frame support this possibility, showing multiple retests of the $38 area. This has also been combined with a hidden bullish divergence in the RSI.
The MACD is also moving upwards, and the Stochastic oscillator is very close to making a bullish cross. This seems to indicate that the trend is bullish and BNB is expected to continue moving higher.
Wave Count
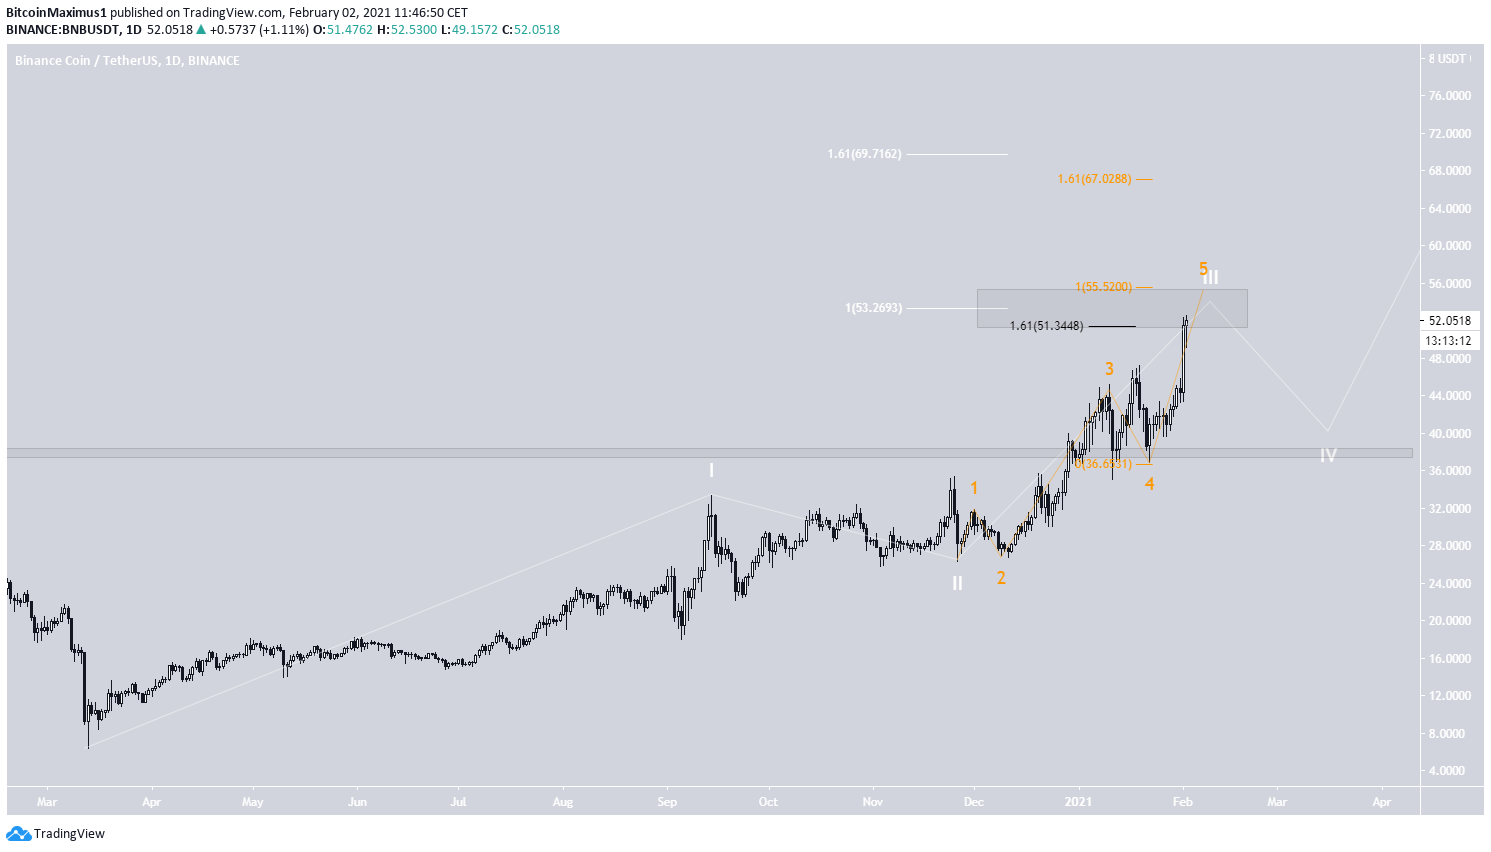
The wave count suggests that BNB is nearing the top of wave three of a bullish impulse (shown in white below) which began with the March 2020 lows.
BNB has reached a cluster of possible targets between $51.34-$53.81, found by using a combination of Fib extensions, projections, and external retracements.
While it’s possible that wave three extends all the way to $65-$69, it’s more likely that it will stop near the current level.
The sub-wave count is given in orange.
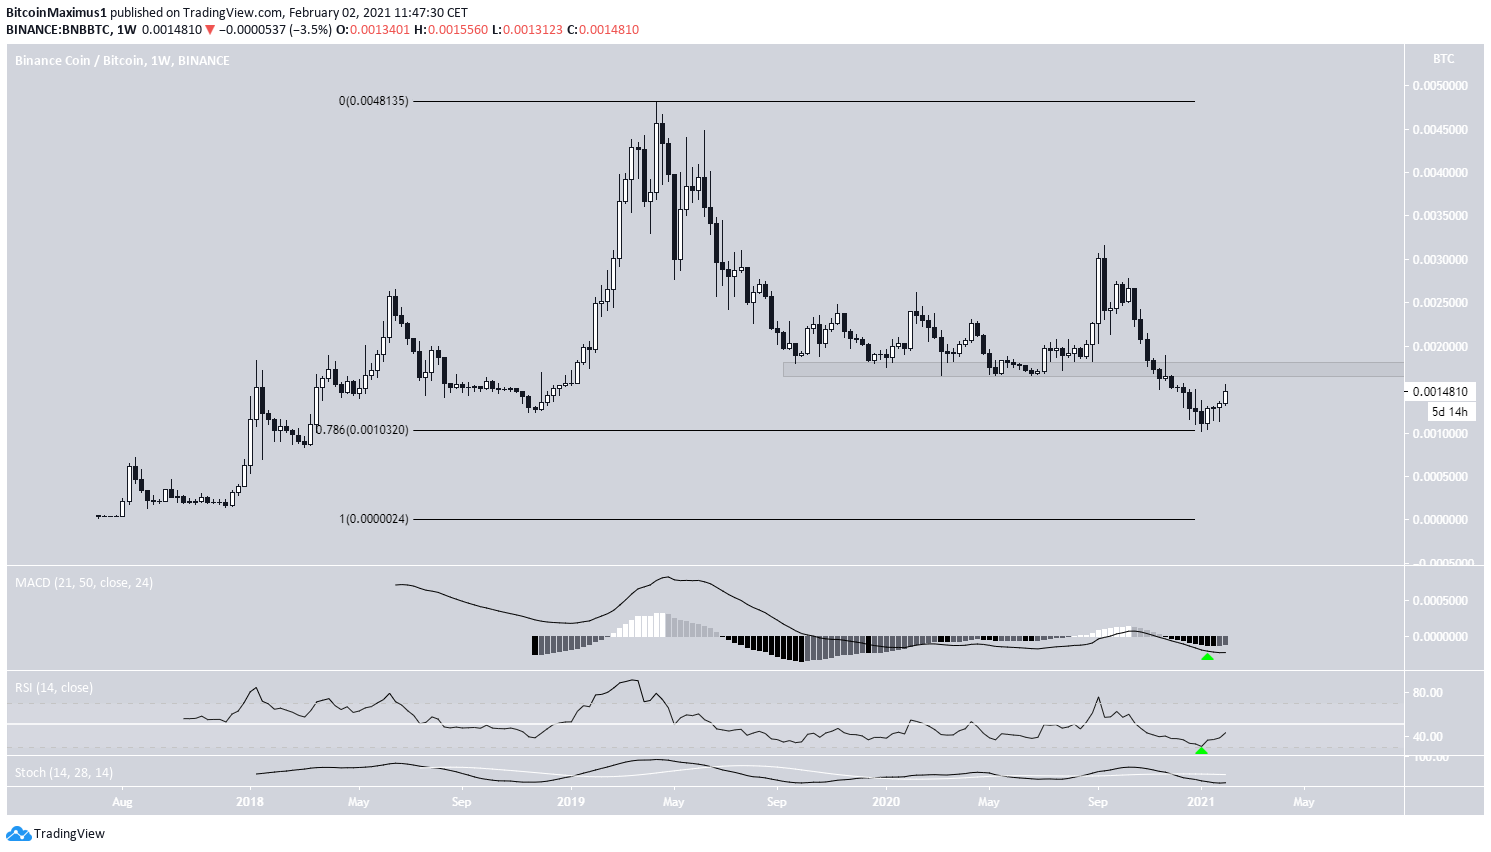
BNB/BTC
Cryptocurrency trader @Thebull_Crypto outlined a BNB chart, stating that a pump is likely incoming, giving a possible target of ₿0.0019
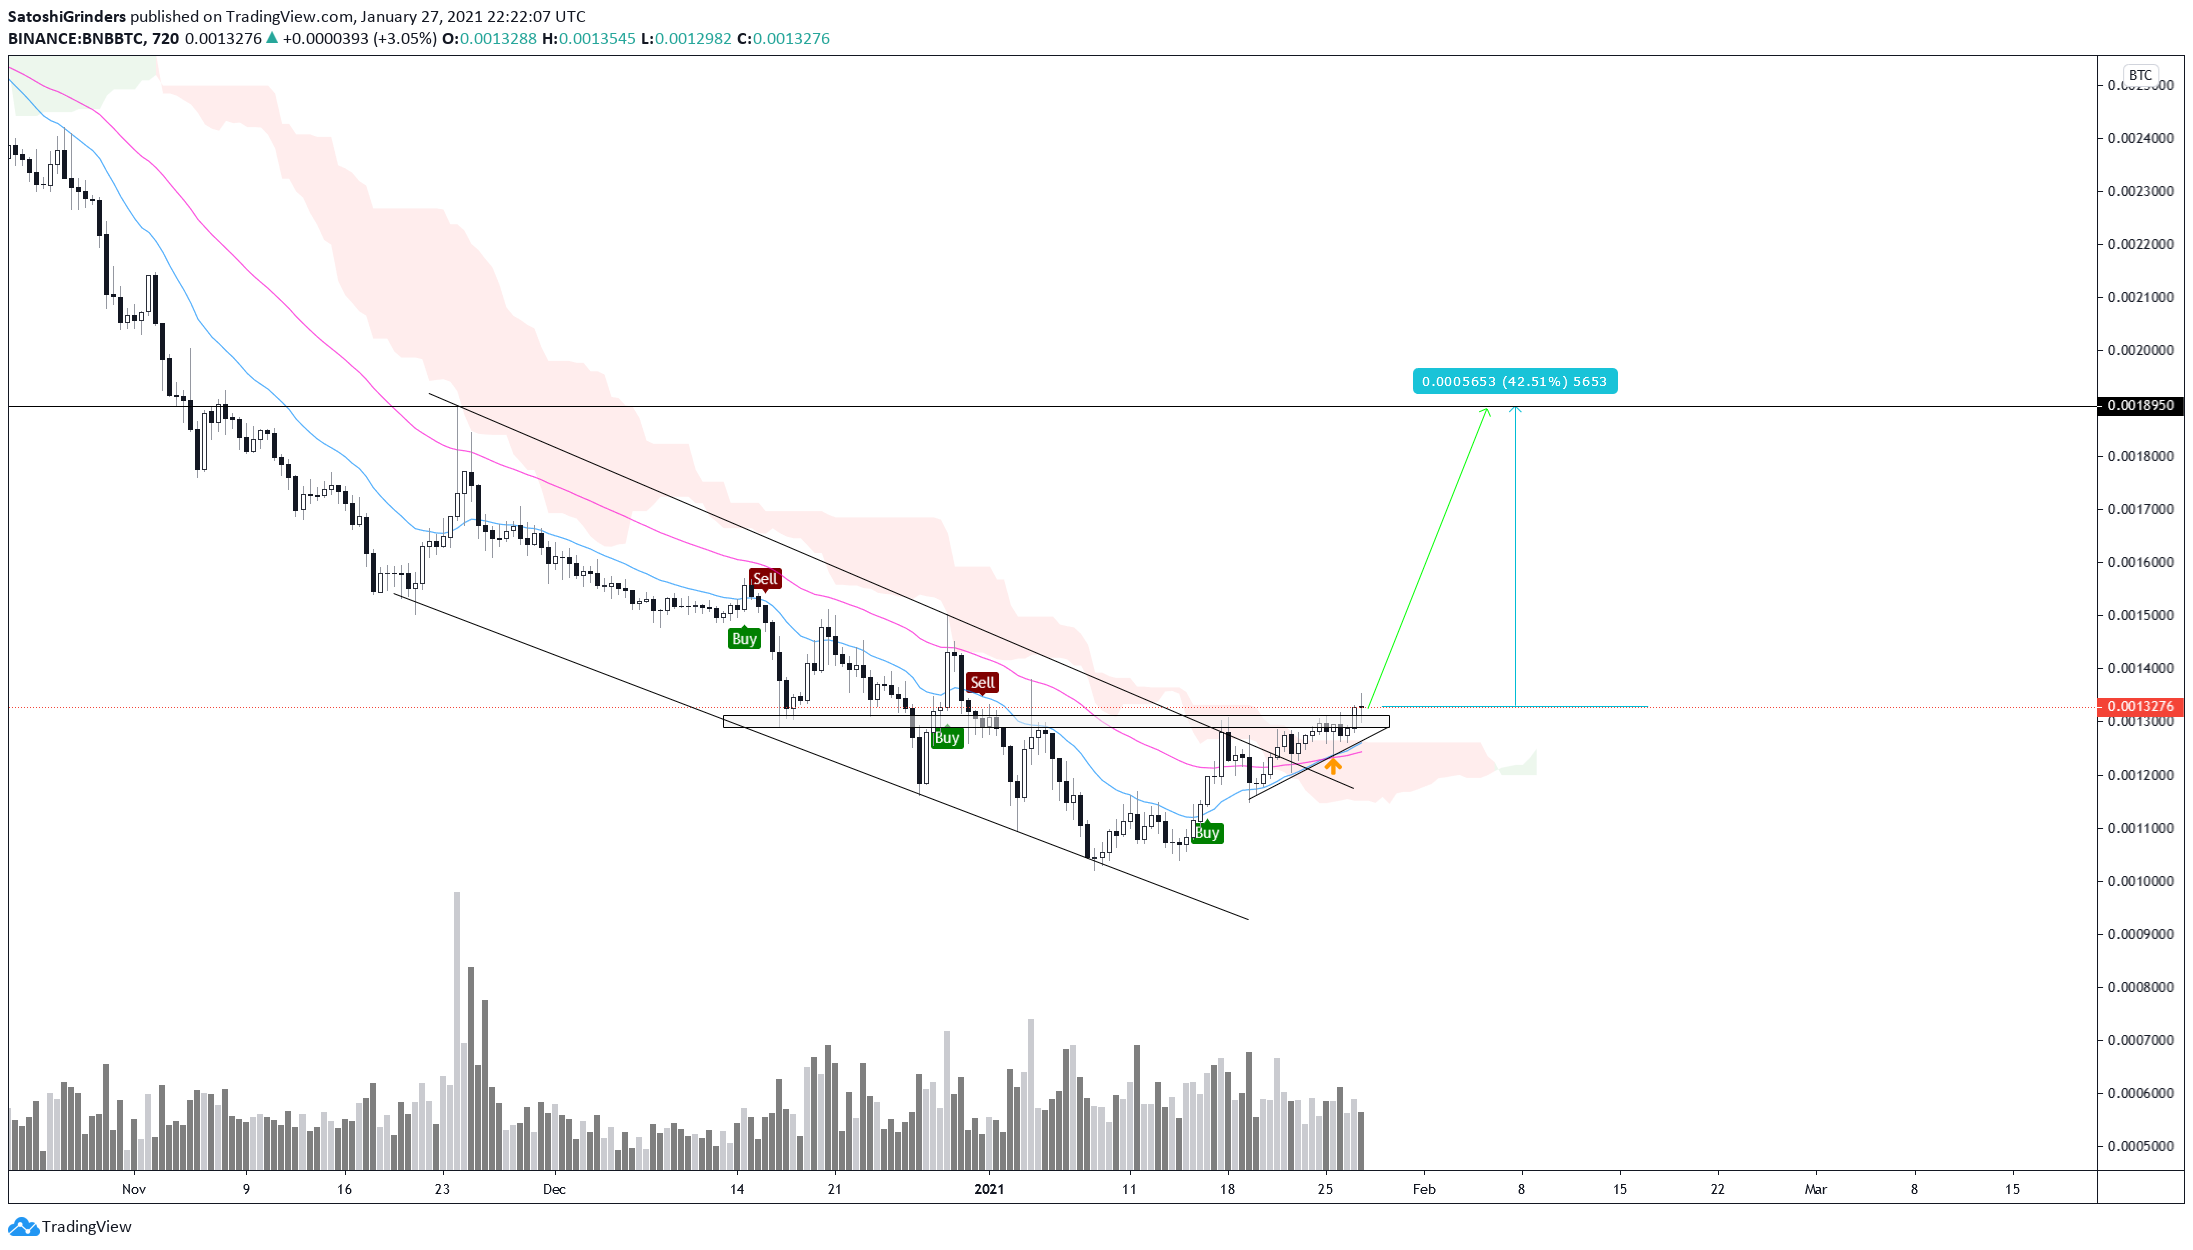
While BNB/BTC has bounced at the 0.786 Fib retracement level, it still faces strong resistance at the previous breakdown level at ₿0.0019.
While technical indicators are clearly bullish, the trend cannot be considered so until BNB manages to reclaim the ₿0.0019 level and validate it as support.
Conclusion
To conclude, while the long-term trend for BNB/USD is still bullish, a short-term retracement could occur prior to the resumption of the upward move.
BNB/BTC needs to clear the closest resistance area for the trend to be considered bullish.
For BeInCrypto’s latest Bitcoin (BTC) analysis, click here


