


Binance Coin (BNB) price has increased significantly since falling to a new yearly low in June. The recent triple-bottom pattern could confirm that a bullish reversal has begun.
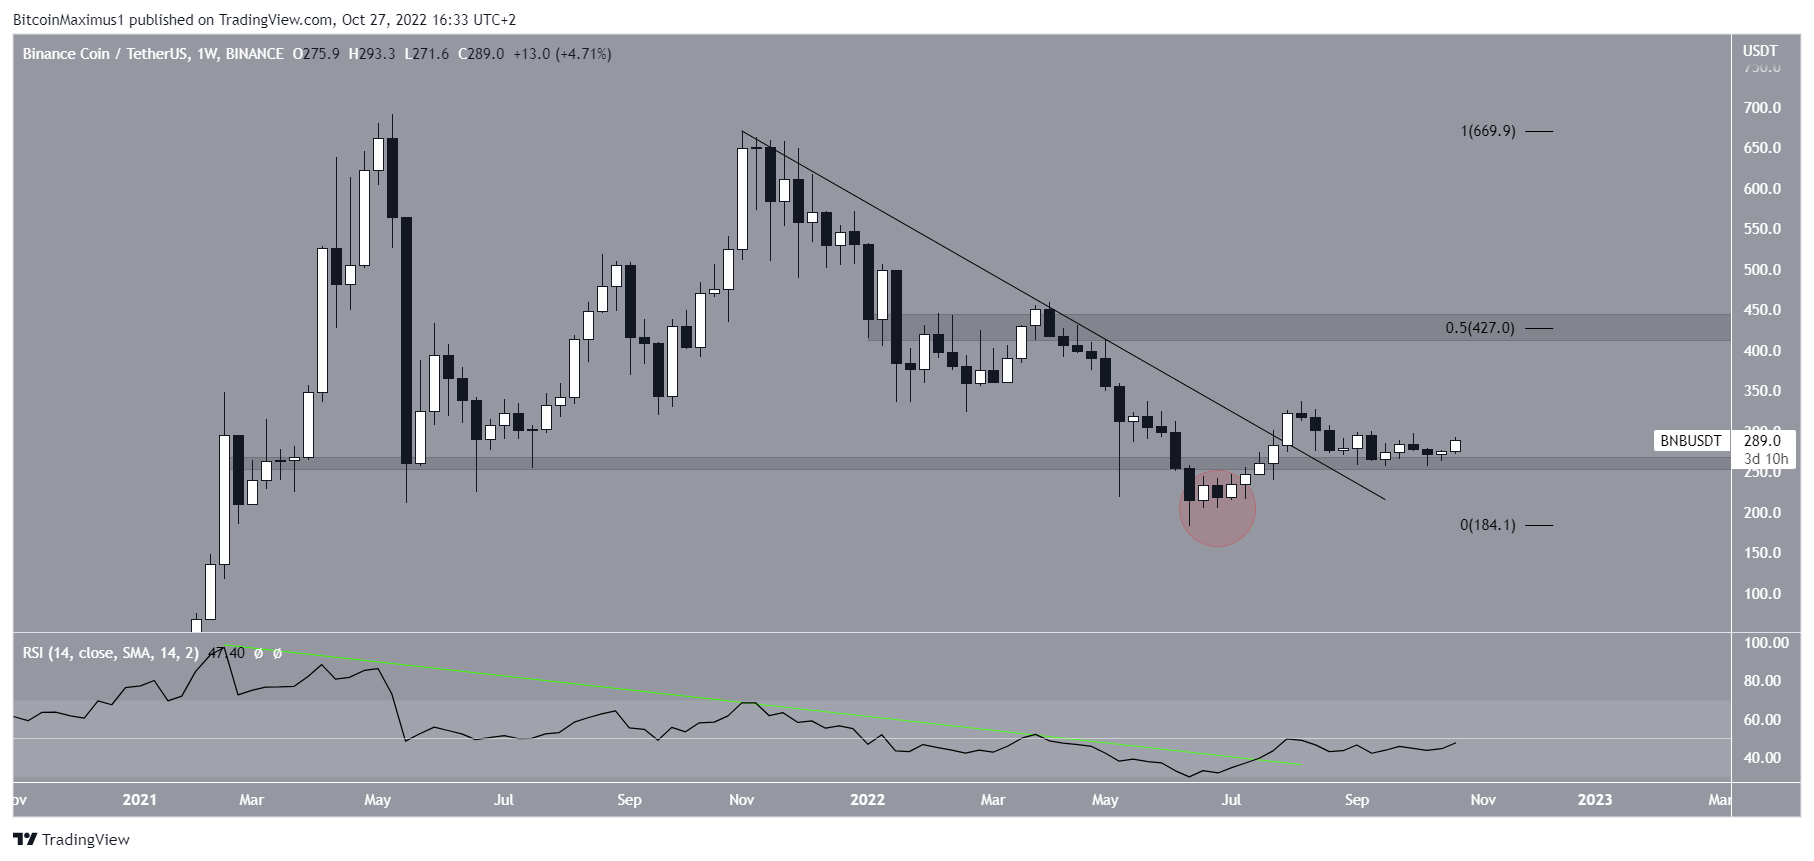
BNB price has been falling since reaching an all-time high price of $692 in May 2021. In Nov. 2021, it created a slightly lower high and resumed its downward movement underneath a descending resistance line.
This decrease led to a yearly low of $183 in June 2022. Initially, it seemed that the decrease caused a breakdown below the $255 horizontal support area. However, the BNB price reversed the trend shortly afterward and reclaimed the area (red circle). In Aug, it managed to break out from the aforementioned descending resistance line.
Additionally, the weekly RSI has broken out from its bearish divergence trendline (green), increasing the validity of the breakout. But it is worth mentioning that the indicator has yet to move above 50. This would further confirm that a bullish reversal has begun.
If the upward movement continues, the closest long-term resistance area would be at $427. This is the 0.5 Fib retracement resistance level and a horizontal resistance area.
Binance Coin Price Prediction: Triple Bottom
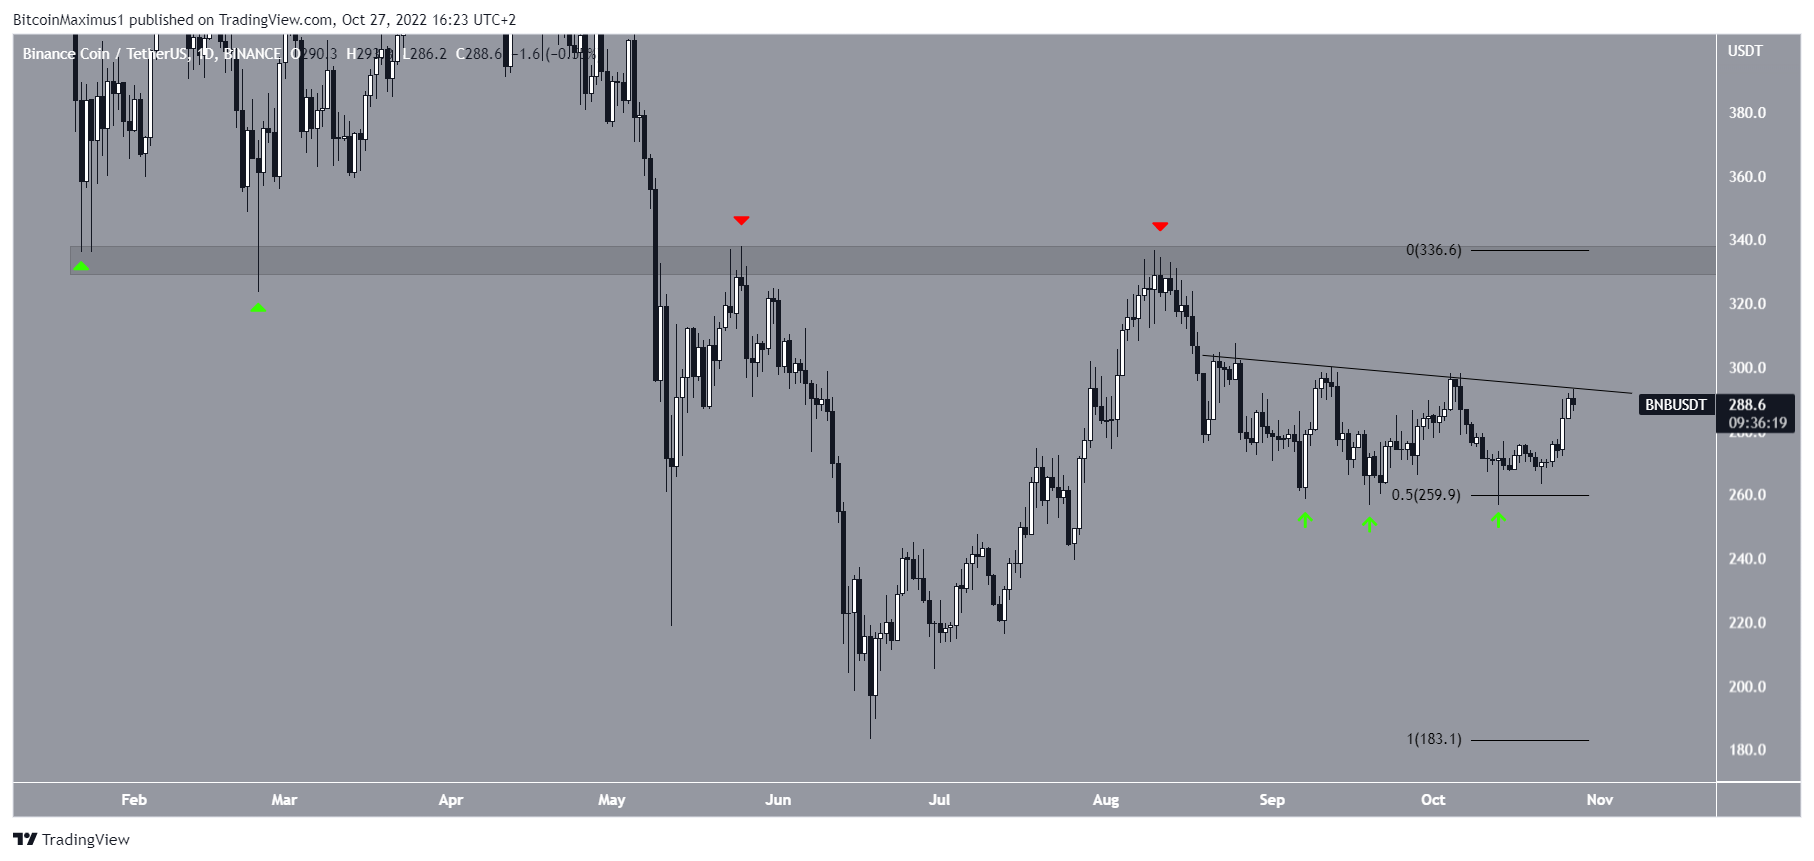
Between Sept. 06 and Oct. 13, the Binance Coin price created a triple bottom pattern (green arrows). According to technical analysis, the triple bottom is regarded as a bullish pattern that usually leads to bullish trend reversals. Additionally, the final bottom created a very long lower wick, which is viewed as a sign of buying pressure.
However, the BNB price pattern is not confirmed yet. The reason for this is that the price is still following a descending resistance line, which acts as the pattern’s resistance. A breakout from it is required to confirm the pattern.
In that case, the next resistance area would be $336. This is a crucial horizontal level since it has previously acted as both support (green icons) and resistance (red icons). So, a breakout above it could significantly accelerate the rate of increase. It is entirely possible that a breakout will occur within the next 24 hours.
So far, the bullish Binance Coin price prediction from the daily timeframe is in line with bullish readings from the weekly timeframe.
Wave Count Supports Continuation of BNB Price Upward Movement
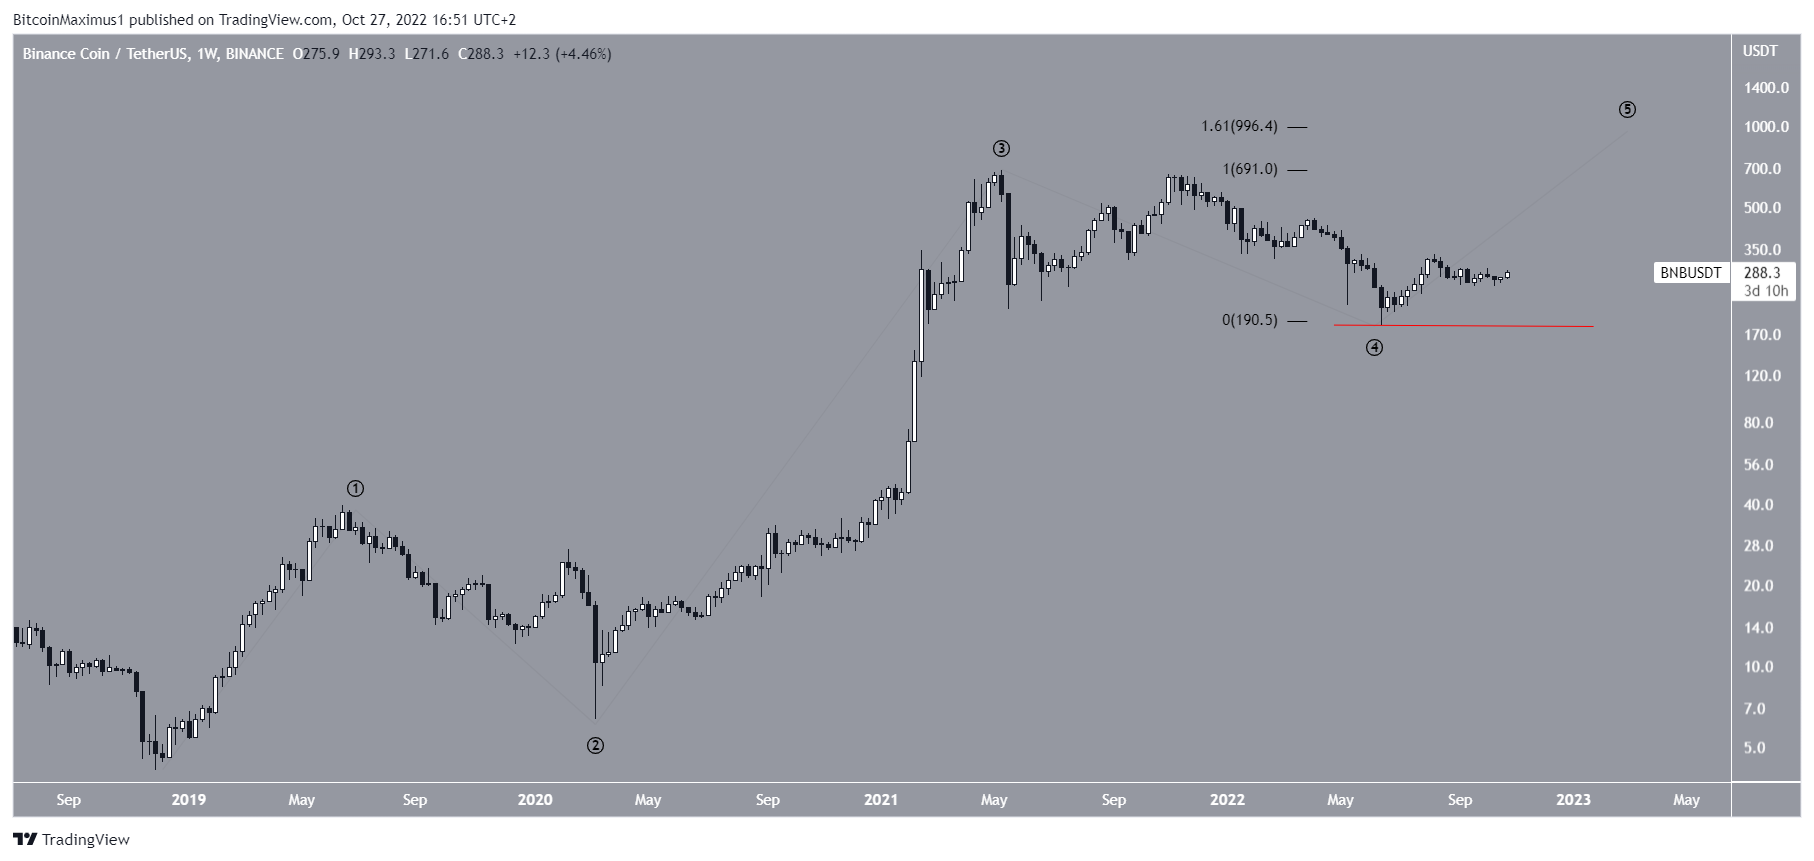
Measuring from March 2020, the most likely wave count suggests that the BNB price has begun the fifth and final wave of a bullish impulse (black). If correct, the upward movement would lead to a new all-time high. The first potential target is at $996, created by the 1.61 external Fib retracement of wave four.
Conversely, a decrease below the yearly low of $183 would invalidate the bullish wave count. In that case, due to the lack of support below the level, the rate of the decrease could accelerate and take the BNB price below $100.
For the latest BeInCrypto Bitcoin (BTC) and crypto market analysis, click here
Disclaimer: BeInCrypto strives to provide accurate and up-to-date information, but it will not be responsible for any missing facts or inaccurate information. You comply and understand that you should use any of this information at your own risk. Cryptocurrencies are highly volatile financial assets, so research and make your own financial decisions.


