


Bitcoin (BTC) price has broken out from a descending wedge after bouncing at the $18,850 horizontal support area, while Ethereum (ETH) price has bounced at the $1,270 horizontal support area and could soon break out from its descending parallel channel.
The XRP price, however, is barely holding on to the support line of a symmetrical triangle. The direction of the trend is unclear.
Bitcoin Price Prediction: Break Out From 88-Day Pattern
The BTC price has been decreasing inside a descending wedge since Aug. 15. The descending wedge is considered a bullish pattern, meaning that an eventual breakout from it would be the most likely scenario.
On Sept. 21, it seemed that the Bitcoin price broke down from the wedge and the $18,850 horizontal support level. However, the decrease was only a deviation (green circle), since the BTC price increased shortly afterward and reclaimed the $18,850 area. The low also served to validate the support line of the wedge, which has been in place since July 26.
Afterward, the Bitcoin price created two long lower wicks (green icons) after bouncing at the $18,850 support area and finally broke out on Oct. 23. At the time of the breakout, the wedge had been in place for 88 days.
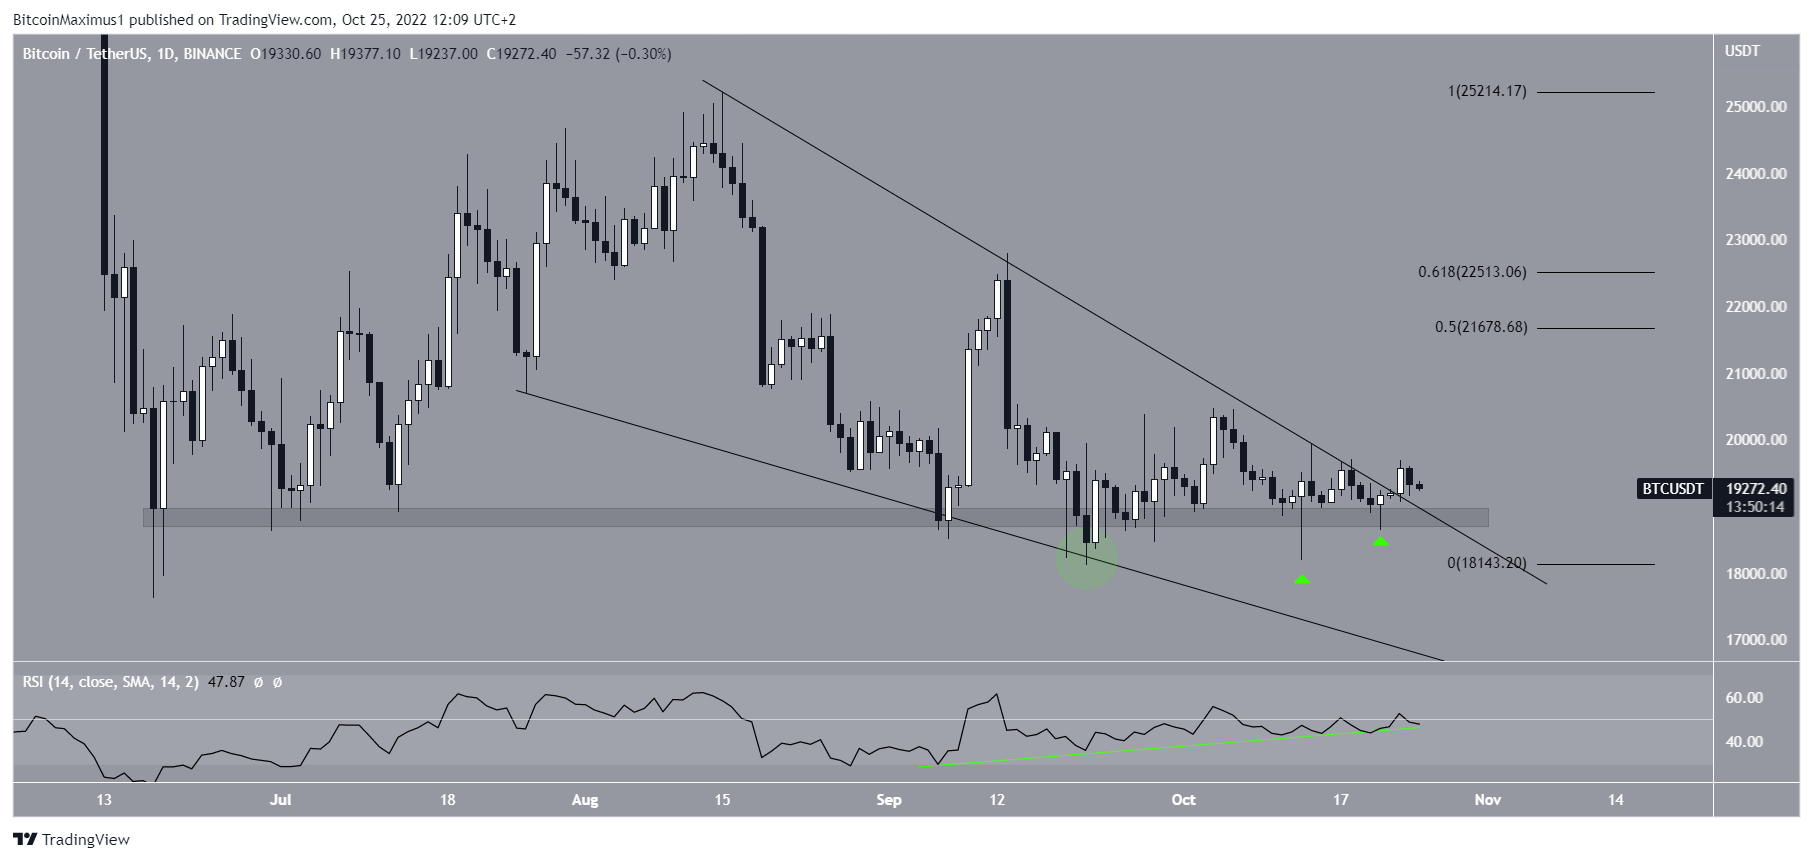
Moreover, the daily RSI supports the continuation of the upward movement. It has generated bullish divergence (green line) and its trend line is still intact.
If the upward movement continues, the main resistance area would be between $21,678 and $22,513.
So, there are two main bullish signs that support a bullish BTC price prediction.
- BTC has broken out from a descending wedge
- The daily RSI has generated bullish divergence (green line)
Ethereum Price Prediction: Strength Shown by Reclaiming Support
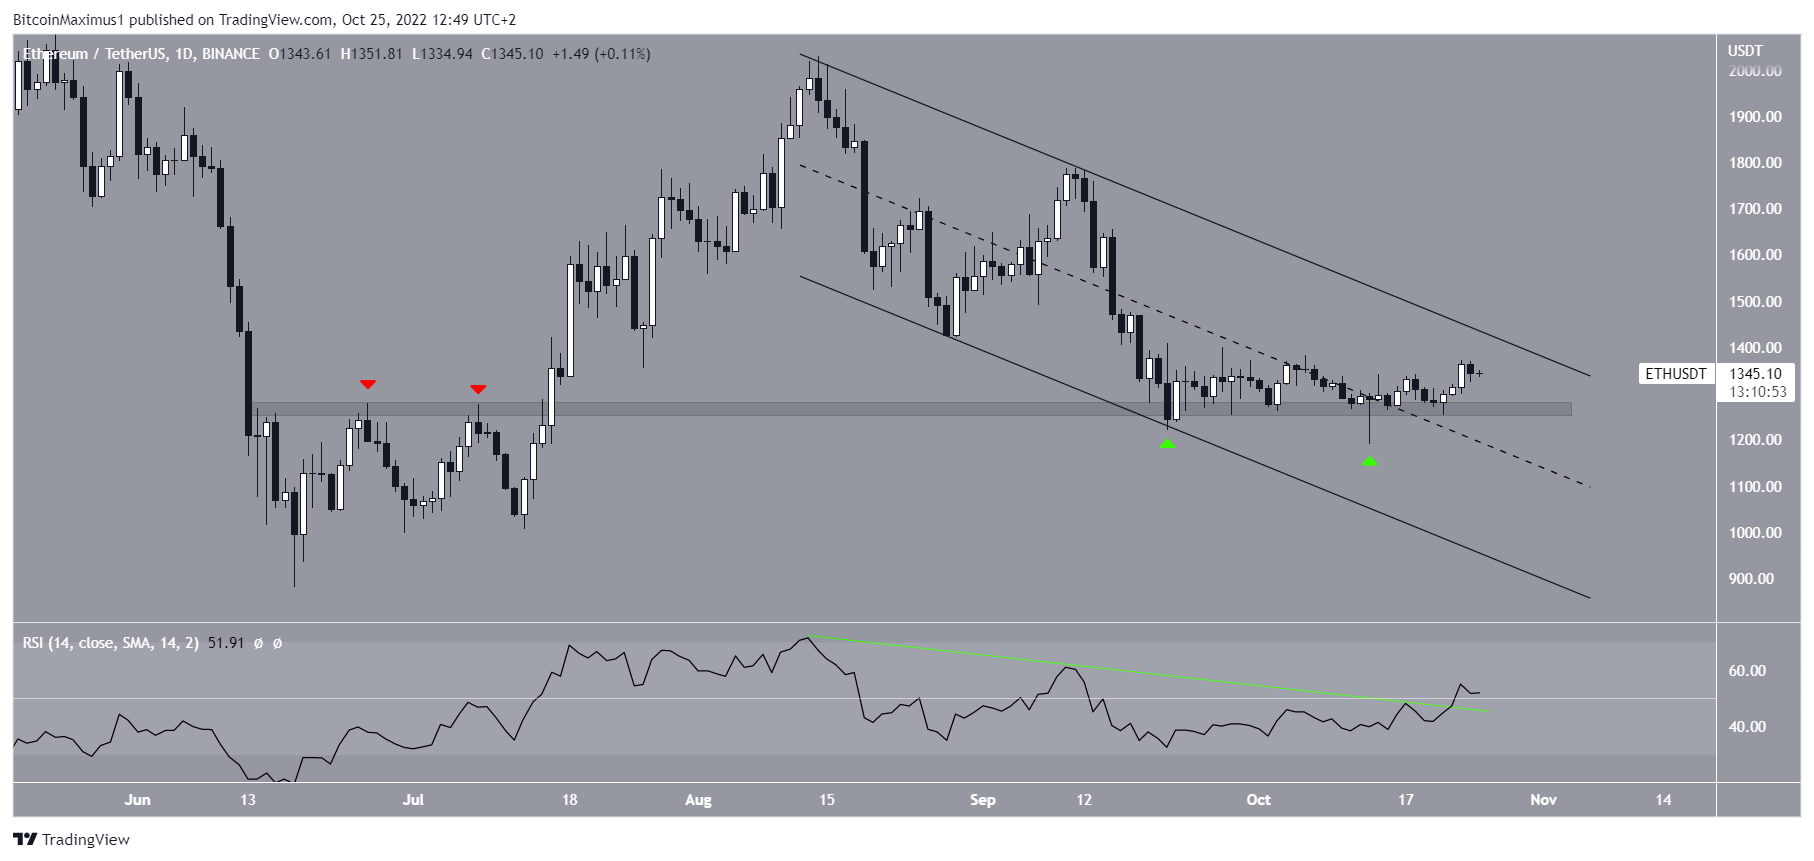
ETH has been falling underneath a descending parallel channel since reaching a high of $2,020 on Aug. 22. Similar to the descending wedge, the descending parallel channel is considered a bullish pattern. As a result, an eventual breakout is expected.
Moreover, the price action is bullish. The Ethereum price has bounced twice (green icons) at the $1,270 horizontal support area, creating a long lower wick the second time.
Furthermore, the daily RSI has broken out from its descending resistance line (green line) and is now above 50. Finally, the ETH price is trading in the upper portion of the channel, indicating that an eventual breakout is expected.
So, in a similar fashion to BTC, there are several signs that indicate that the ETH price trend is bullish:
- The daily RSI has broken out from its descending resistance line
- The ETH price has reclaimed the $1,270 horizontal support area
- ETH is trading in the upper portion of the channel
XRP Price Prediction: Consolidation Without Clear Trend
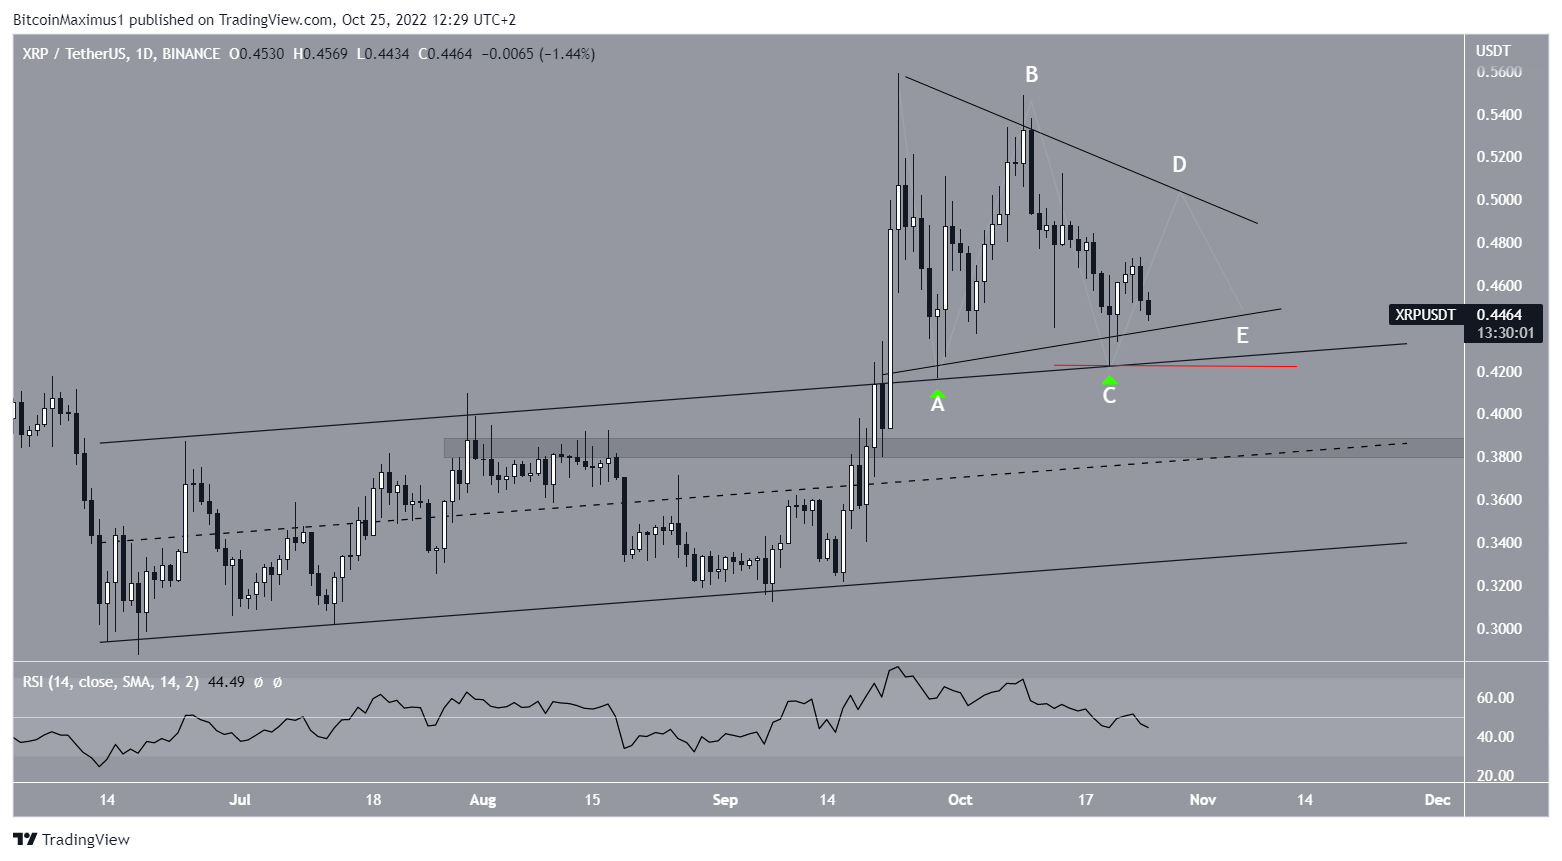
The technical analysis picture for XRP is less clear. While the XRP price has broken out from an ascending parallel channel, it is now trading inside a neutral symmetrical triangle pattern.
On one hand, the support lines of the triangle have been validated twice (green icons), creating long lower wicks in the process. On the other, the daily RSI is decreasing and is below 50. So, there are mixed signs in both technical indicators and the price action.
The most likely wave count suggests that the XRP price is in wave C (white) of the triangle and will eventually break out. However, this price prediction is not supported by the RSI nor the price action.
So, a decrease below the wave C low of $0.421 (red line) would invalidate this hypothesis and suggest that the XRP price will fall lower. In this case, the next closest support area would be at $0.385.
Unlike BTC and ETH, the trend for XRP is less clear. The lack of bullish divergence and the ongoing RSI decrease coupled with the neutral pattern fail to confirm the direction of the trend.
For the latest BeInCrypto Bitcoin (BTC) and crypto market analysis, click here
Disclaimer: BeInCrypto strives to provide accurate and up-to-date information, but it will not be responsible for any missing facts or inaccurate information. You comply and understand that you should use any of this information at your own risk. Cryptocurrencies are highly volatile financial assets, so research and make your own financial decisions.


