


On May 11, 2019, 990 billion BitTorrent Tokens (BTT) were airdropped among those who held BTT prior to this date. This was the third scheduled monthly airdrop. According to the Tron Foundation, these airdrops will continue monthly until Feb 11, 2025—through the number of BTT airdropped is expected to fluctuate annually.
We completed analyses of BTT shortly after the Mar 11 and Apr 11 airdrops. In this analysis, we have waited about two weeks to better assess longer-term price fluctuations following this current airdrop.
As seen in the graph below, the price of BTT has been steadily increasing since May 11 as seen in the graph below:
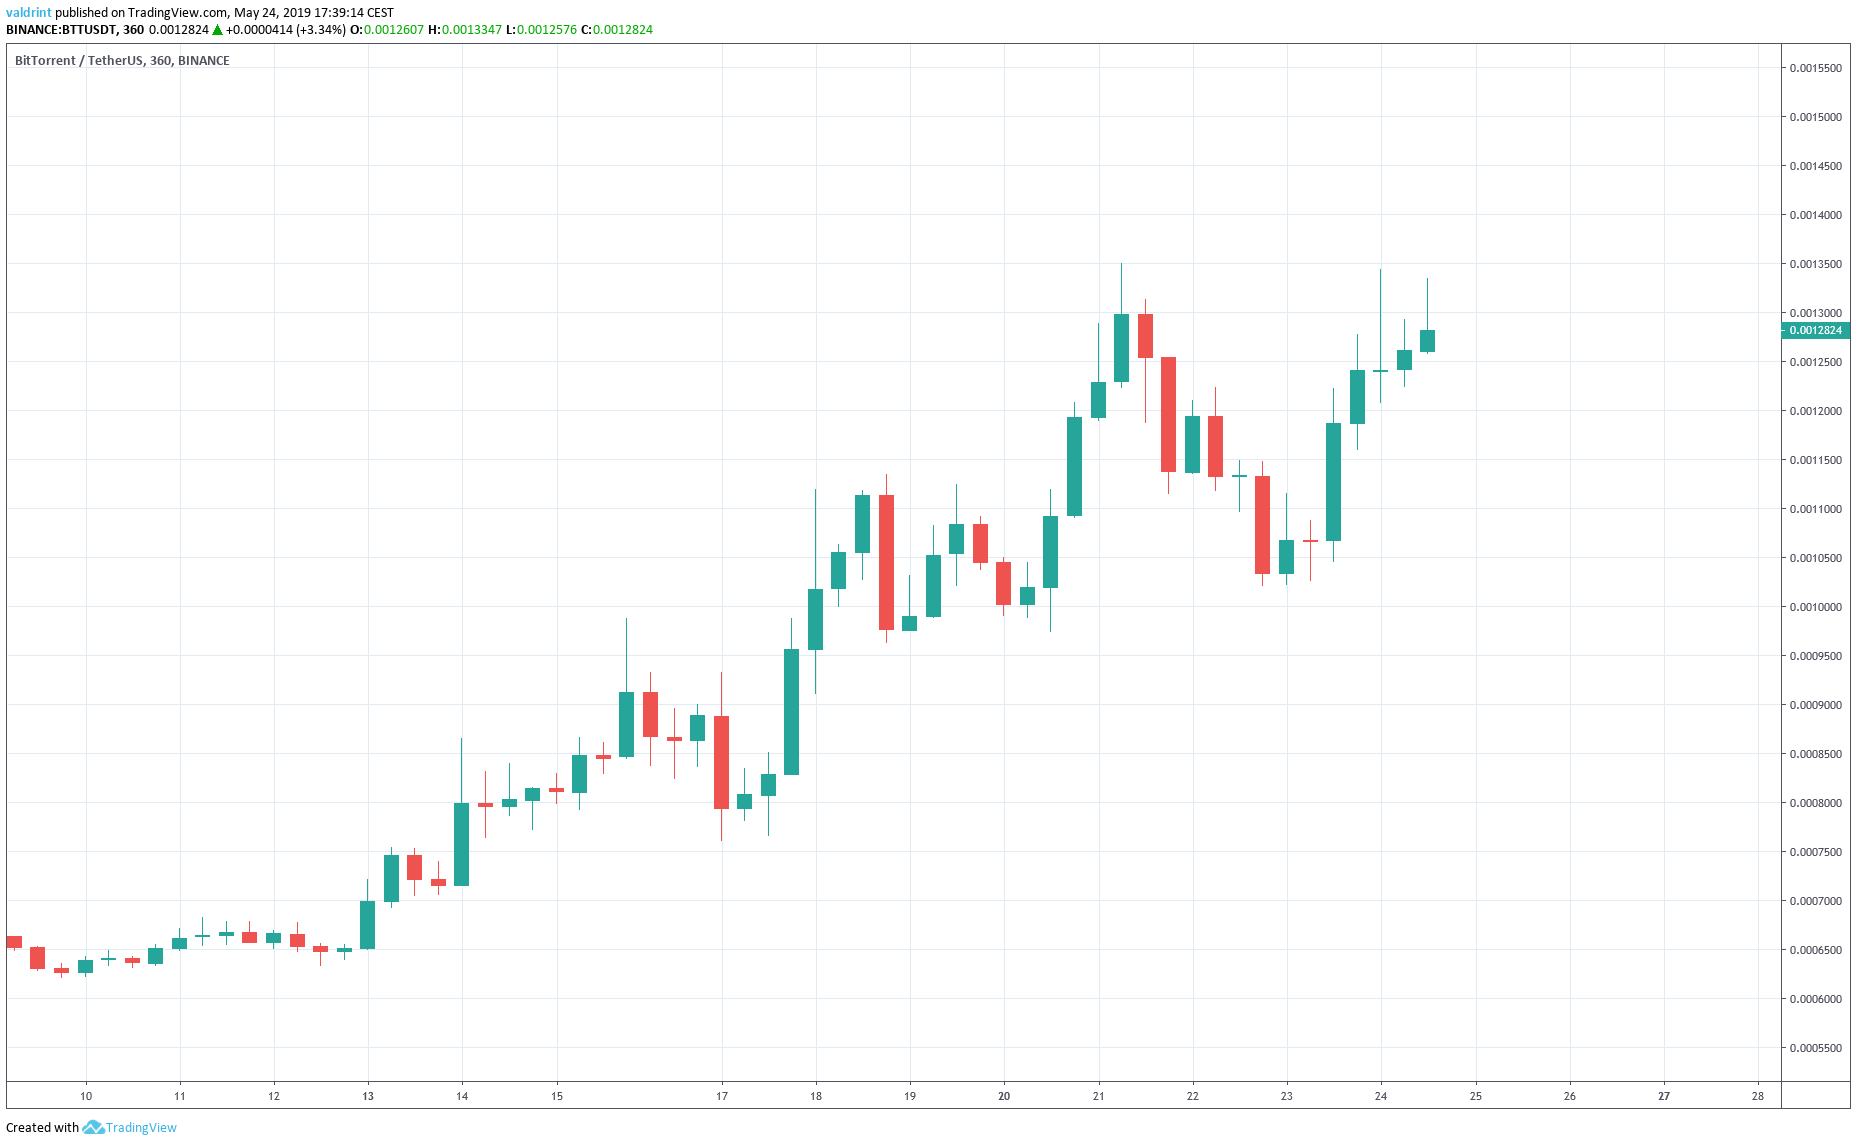
On May 12, the price reached a low of ₮0.00063. A gradual increase followed. The price reached a high of ₮0.00135 on May 21. After a decrease, the price reached a similar high on May 24.
Will the price create new highs or is a reversal in store? Let’s find out:
BitTorrent Token(BTT): Trends and Highlights For May 24, 2019
- BTT price reached a high of ₮0.00135 on May 21.
- A similar high was reached on May 24.
- The price is trading inside a symmetrical triangle.
- Bearish divergence has developed in the RSI and the MACD.
Short-Term Symetrical Triangle
Following a low of ₮0.00091 on May 18, BTT/USDT has been trading above an ascending support line. A descending resistance line emerged on May 21 with after a high of ₮0.00135 was reached.
Since that high, BTT has been trading inside the symmetrical triangle outlined below:
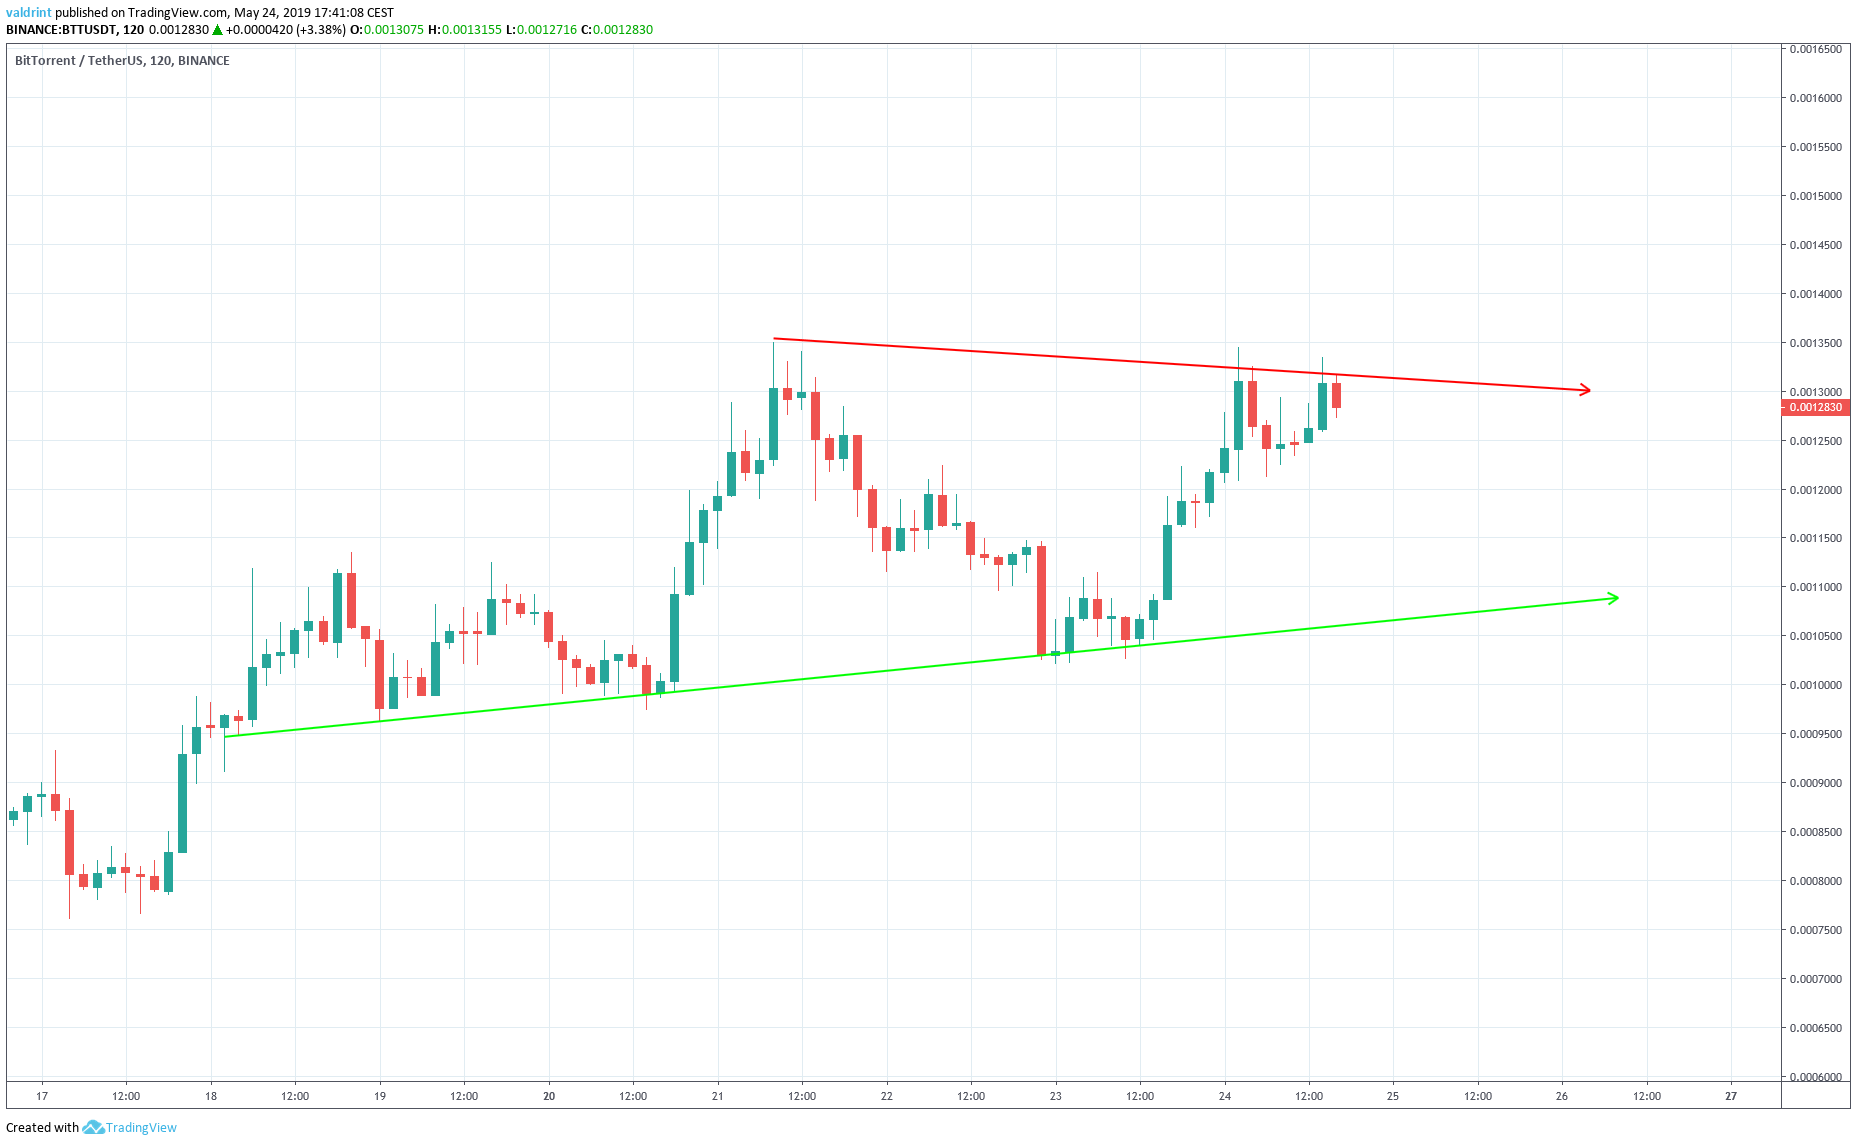
At the time of writing, the price had recently validated the resistance line and generated an apparent double top pattern. If we include the high on May 21, then the price has made a triple top.
Both double and triple tops are bearish reversal patterns. This suggests that the price is likely to soon drop toward the support line.
BTT About to Fall?
To better assess the possibility of short-term losses, the price is analyzed alongside the RSI and the MACD below:
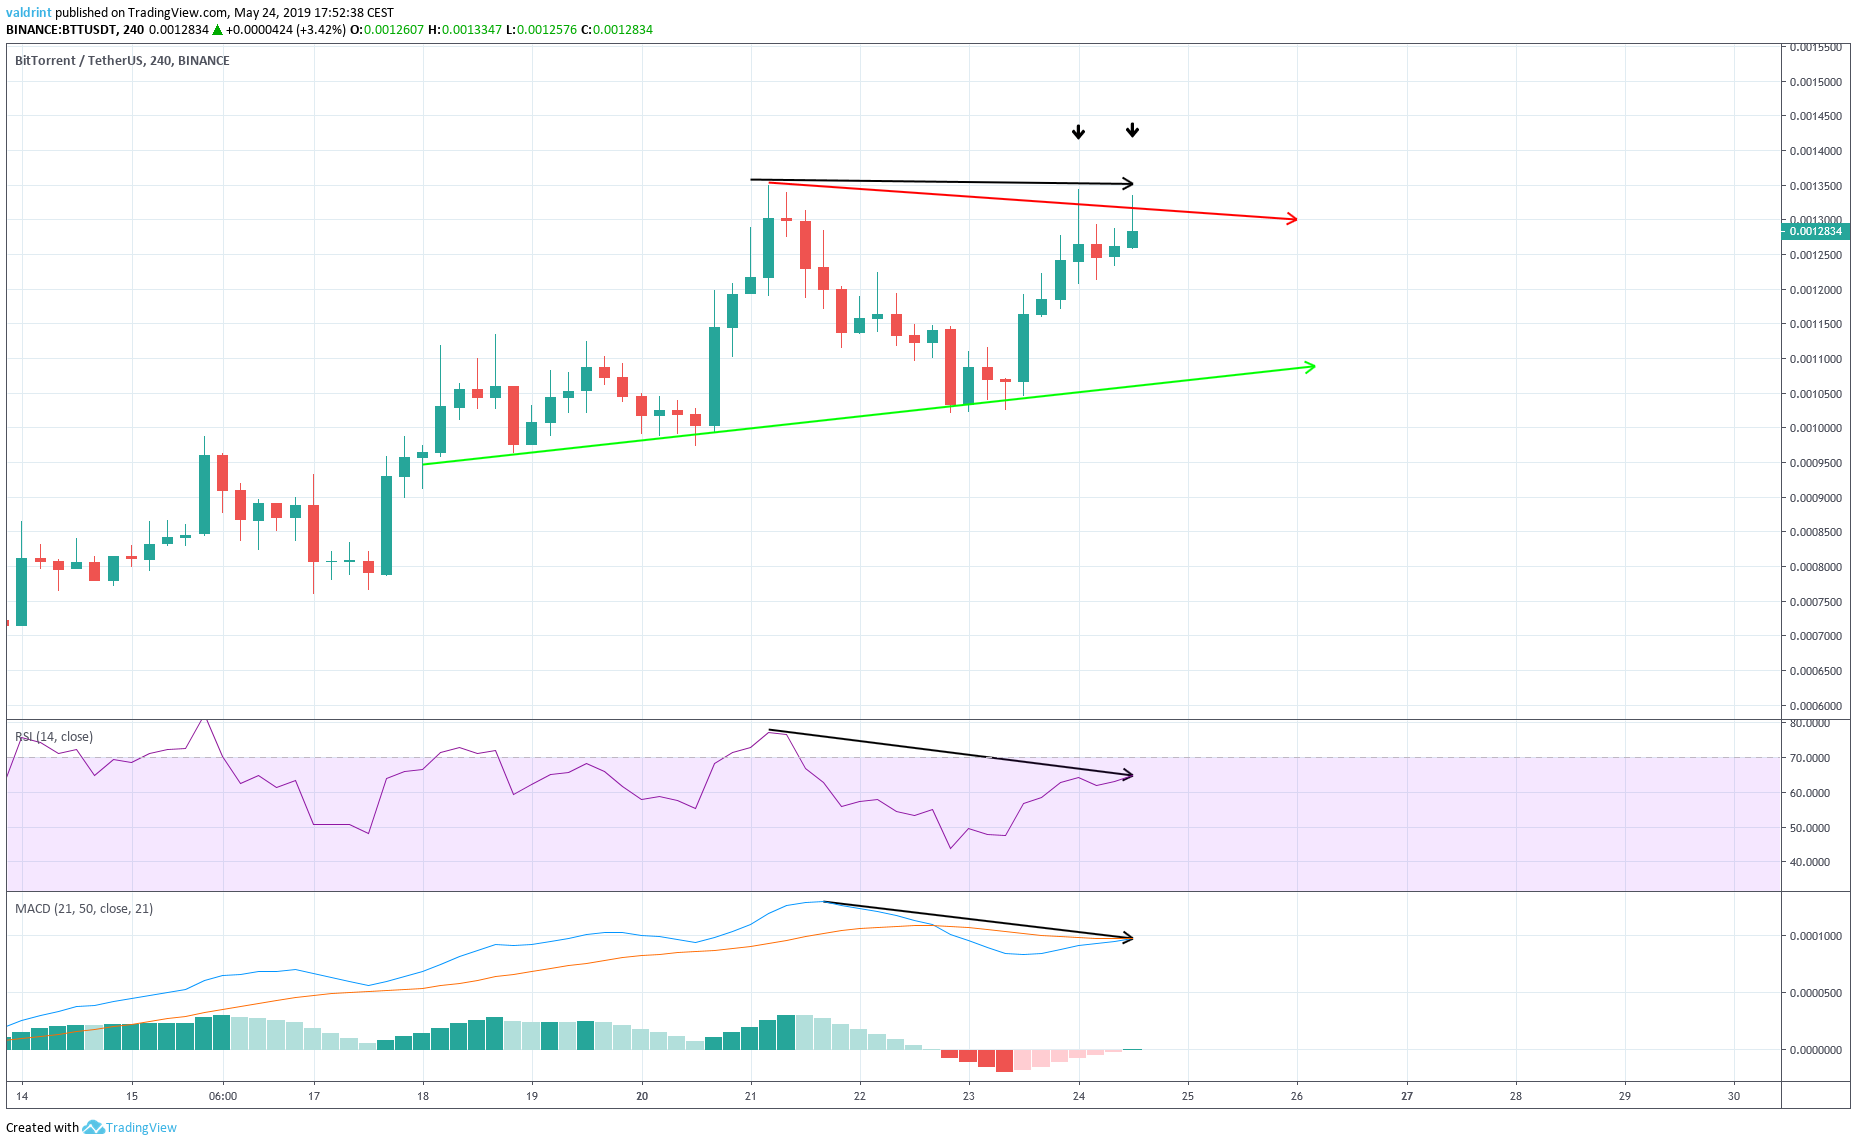
The price has reached similar highs of around ₮0.0013 on three occasions: once on May 21 and twice on May 24. Furthermore, the candlesticks on May 24 have had long upper wicks, indicating that there is selling pressure in the market.
However, the RSI and the MACD did not act in the same manner. Even though they reached their first high on May 21, they have continued to generate lower values since.
This bearish divergence combined with the double or triple top suggests that price drops may be imminent. The support line may be reached in the short-term.
Short Trade Setup for BTT
Based on the position of the price within the triangle, we have identified a short setup with an average entry of ₮0.00130. The stop-loss order is placed at ₮0.00136, slightly above the May 21 highs. This is a stop loss of 4.5%.
Our targets are set at ₮0.0011 and ₮0.00078 respectively.
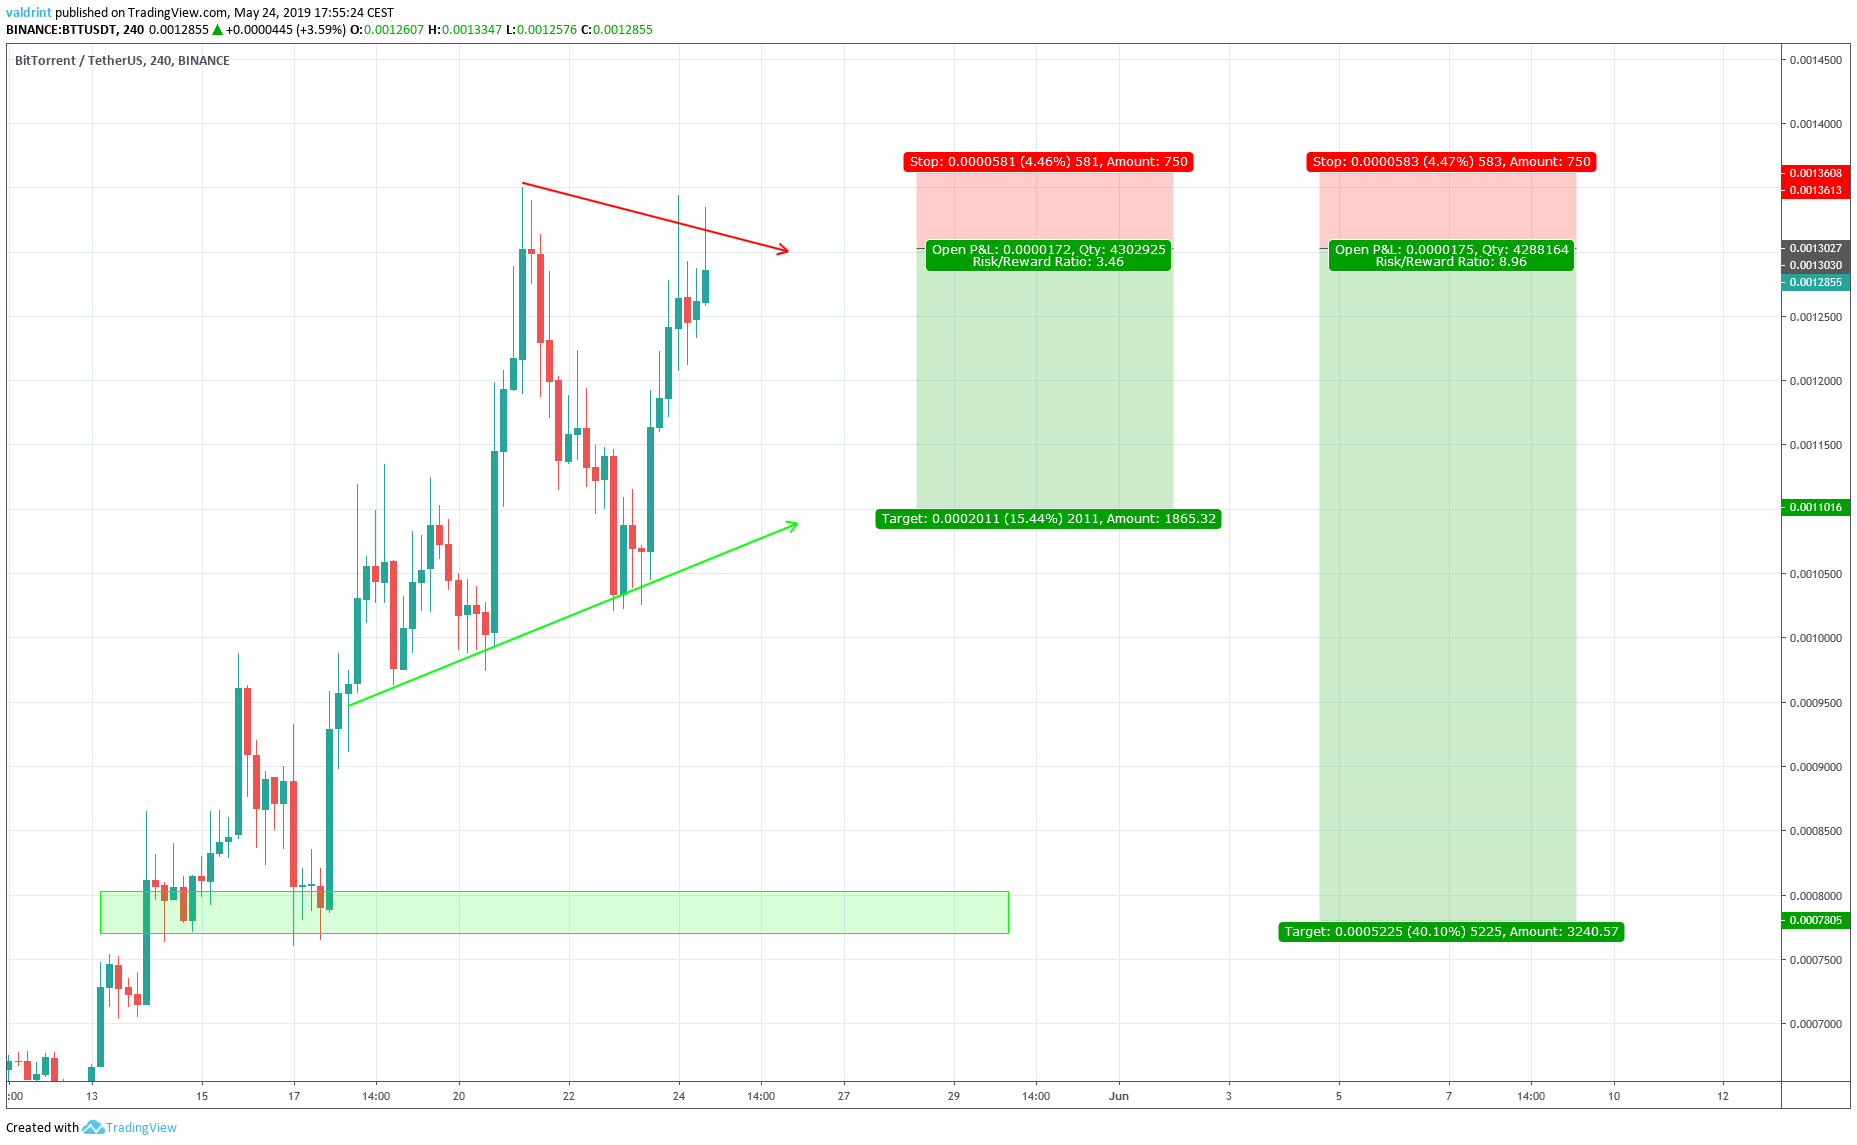
Combined with the stop loss presented above, the first target presents a 3.5 risk/reward ratio. If prices decrease toward the support line as predicted, this target is likely to be reached soon.
The second target would require a breakdown. We do not believe this to be likely in the short-term. Nonetheless, this target may be reached in the long-term. It presents a 9 risk/reward ratio.
If a breakdown occurs, profit can also be taken at ₮0.00096 and ₮0.00086. Our original target of ₮0.00078 should be considered the final target, created by the lows of May 15-17.
Summary of Analysis
Based on this analysis, the price of BTT is likely to keep decreasing until it reaches the support line of the triangle. A breakdown is possible in the longer term.
Furthermore, we identified two possible trade setups based on this analysis. The first is likely to be reached in the short-term; however, the second requires a breakdown and is not likely to be reached until the farther future.
Do you think BTT will break down from the triangle? Let us know your thoughts in the comments below.
Disclaimer: This article is not trading advice and should not be construed as such. Always consult a trained financial professional before investing in cryptocurrencies, as the market is particularly volatile.


