
The Bitcoin (BTC) price experienced a volatile week, creating long wicks on each side of its weekly candlestick.
While the weekly timeframe readings and price action are decisively bearish, a growing bullish divergence in the RSI could lead to a bullish trend reversal.
Bitcoin Experiences Volatile Week
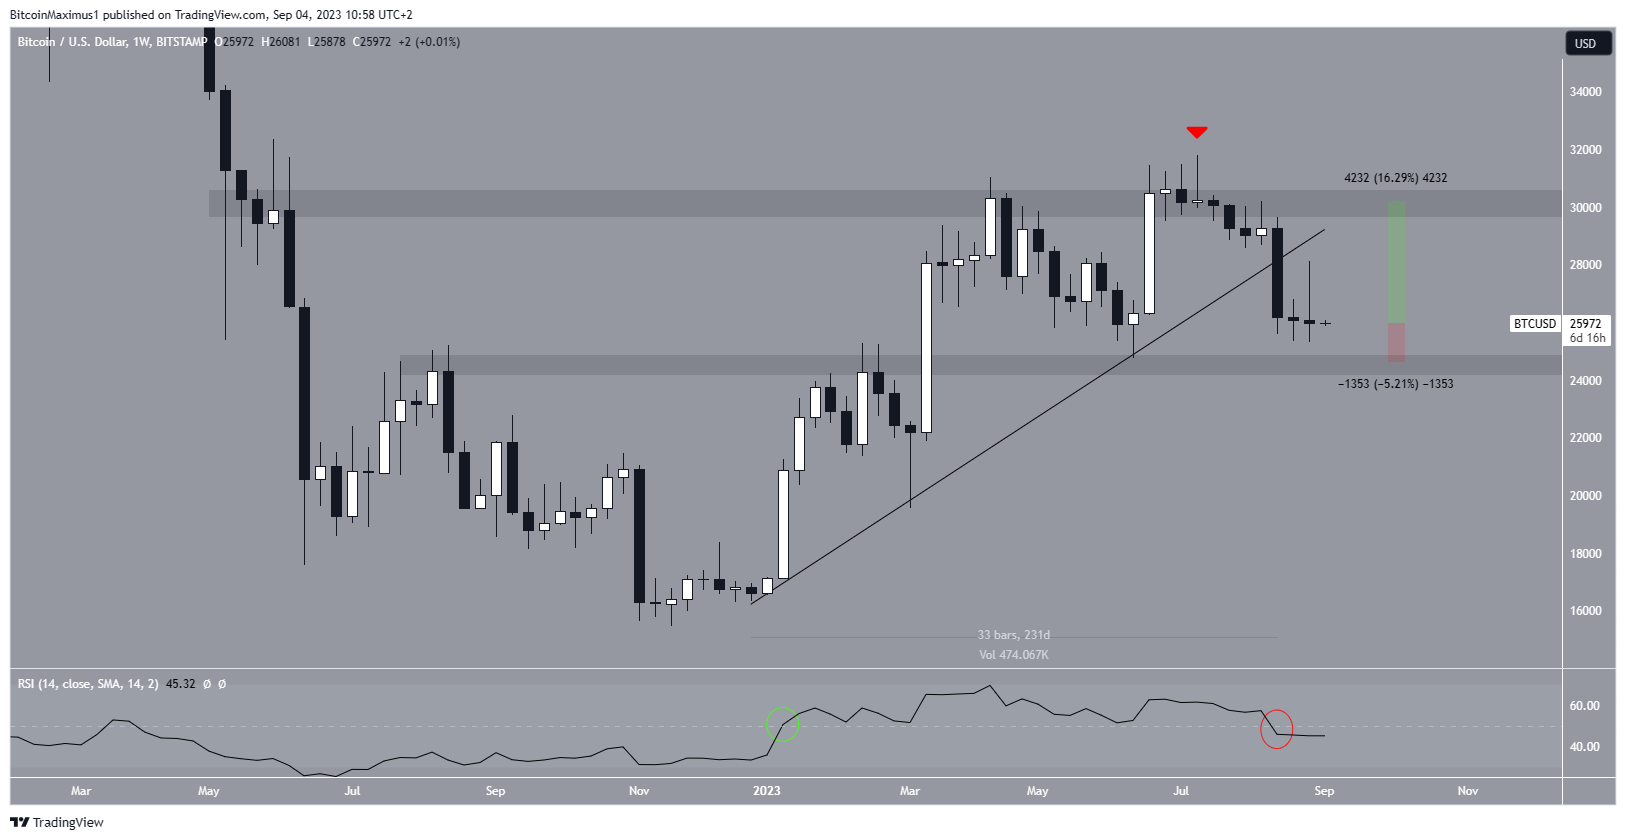
The weekly timeframe technical analysis gives several bearish signs. Firstly, the BTC price decreased from a 231-day ascending support line in August. This is a bearish sign that suggests that the previous trend has ended and a new bearish one has begun.
Moreover, the decrease transpired after a rejection from the $30,000 horizontal resistance area, which has been in place since May 2021.
The Relative Strength Index (RSI) serves as a crucial momentum indicator utilized by traders to assess whether a market is exhibiting signs of being overbought or oversold.
It aids in deciding whether to accumulate or divest from a particular asset. If the RSI registers readings above 50 while displaying an upward trajectory, it implies that bulls currently hold the upper hand in the market. Conversely, when the RSI falls below 50, it shifts toward the bears.
The indicator fell below 50 (red circle) in August. This is a bearish sign and the first time the indicator fell below this level since the beginning of 2023 when the ascending support line was created. Therefore, the decrease below 50 increases the validity of the breakdown.
Despite the bearish price action, the news is mostly positive. The former Securities and Exchange Commission (SEC) chair Jey Clayton, predicted that the Bitcoin ETF would be approved in the near future.
If the price continues to fall, the closest support area at $24,500 will be 5% below the current price. On the other hand, an upward movement can lead to a retest of the $30,000 area, which is 16% above the current price.
BTC Price Prediction: Will Bullish Divergence Initiate Reversal?
While the weekly timeframe is bearish, the daily one suggests that an upward movement could occur soon. The main reason for this is the growing bullish divergence in the RSI (green line). A bullish divergence occurs when a momentum increase accompanies a price decrease. It is a bullish sign that often leads to upward movements.
Additionally, divergence took the RSI outside of its oversold territory, another sign that momentum is favoring the bulls.
However, despite the divergence, the price has yet to move upward. Rather, it is trading close to its August lows and considerably below the descending resistance line in place since the yearly high. The line is currently at $28,200.
If the BTC price were to break out from the resistance line, it could then increase to the previously outlined $30,000 resistance area.
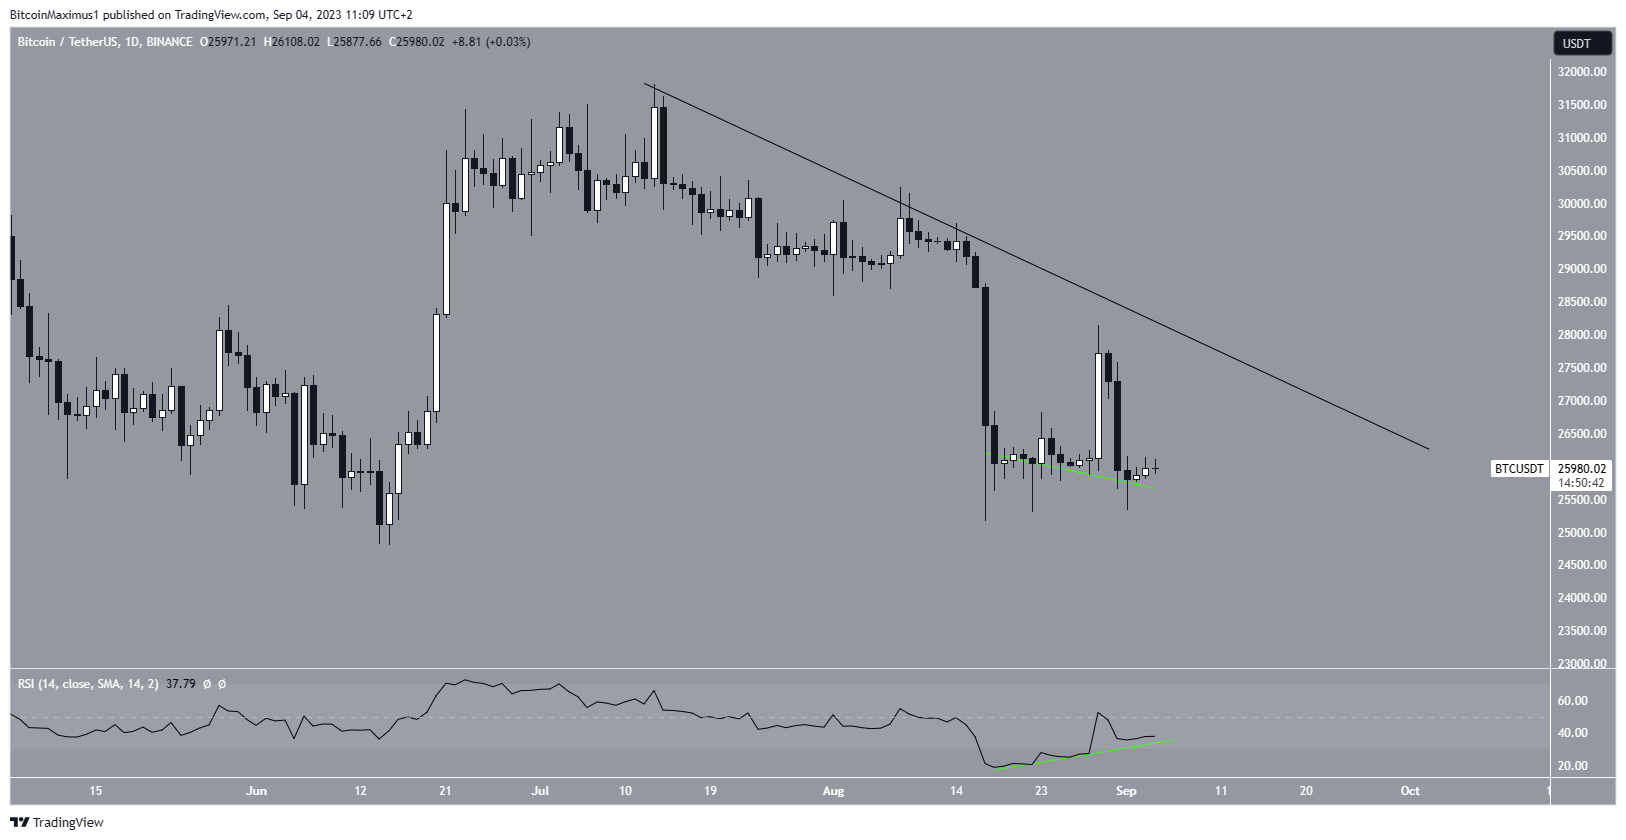
However, if the BTC price falls below $25,500, it will mean that the BTC price prediction is bearish. In that case, a 5% drop to the $24,500 area will likely be the future price scenario.
Check out the Best Crypto Sign-Up Bonuses in 2023
