


The Bitcoin (BTC) price rally has stalled since July 27, when it reached a high of $11,394.
The direction of the exit from the current pattern will determine whether this is an accumulation before another extension or the beginning of the correction.
Bitcoin Sustains Previous Highs
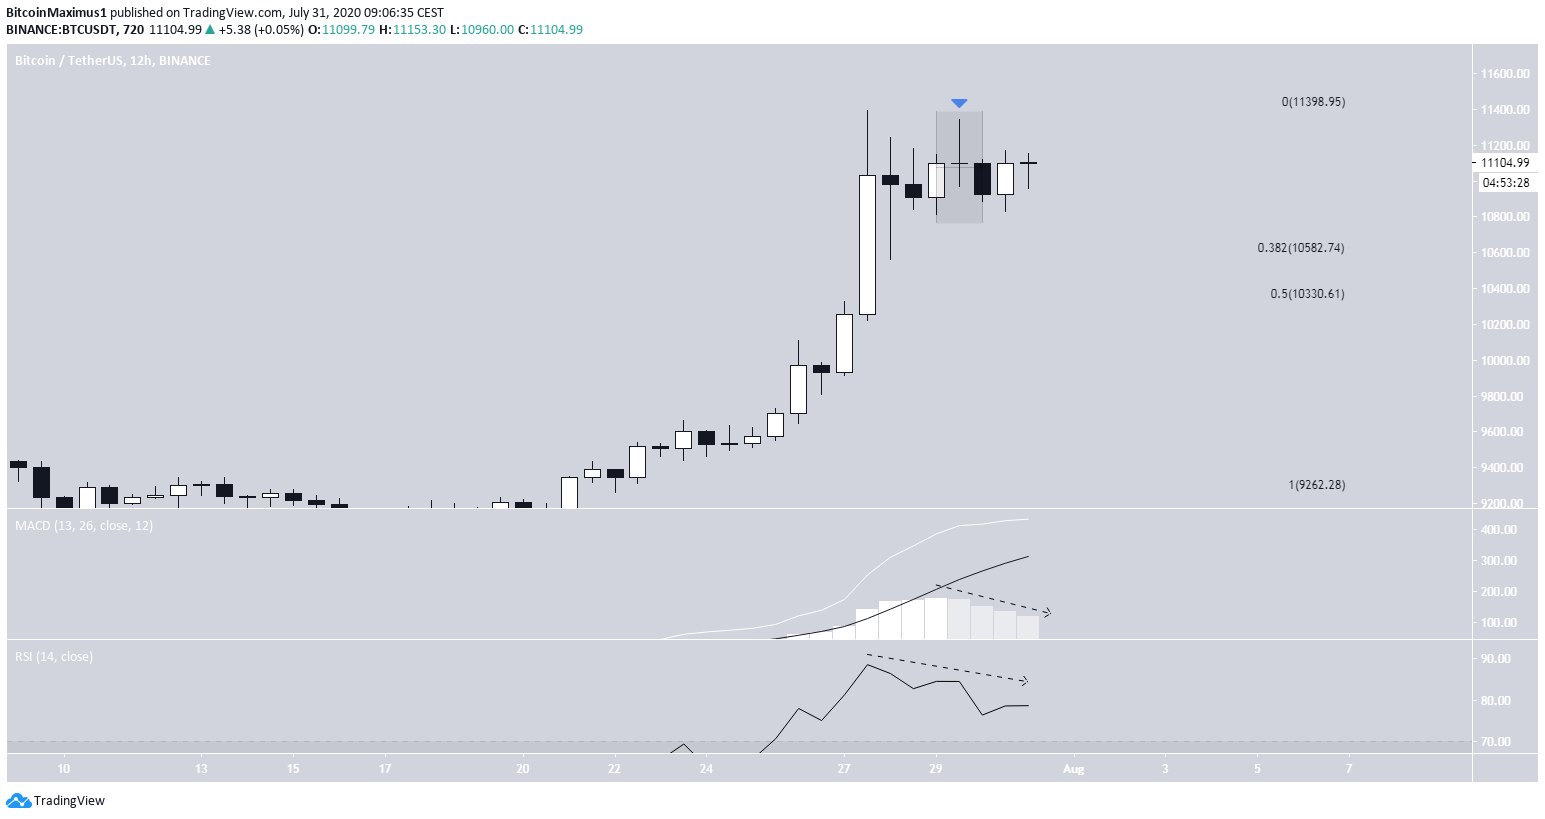
The Bitcoin price reached a high of $11,394 on July 27. After a slight decrease, the price began another upward move, which created a lower-high of $11,342.
Afterward, the price decreased once more and created a Doji candlestick. While this movement has left several long upper wicks in place, the price failed to complete an evening star pattern yesterday and created a bullish candlestick instead.
Technical indicators are showing weakness. The 12-hour MACD has generated three successive lower momentum bars, and the RSI has generated some bearish divergence and is currently being in the process of moving downwards.
If the price decreases, the main support area is found between the 0.5-0.382 Fib levels between $10,330-$10,582.
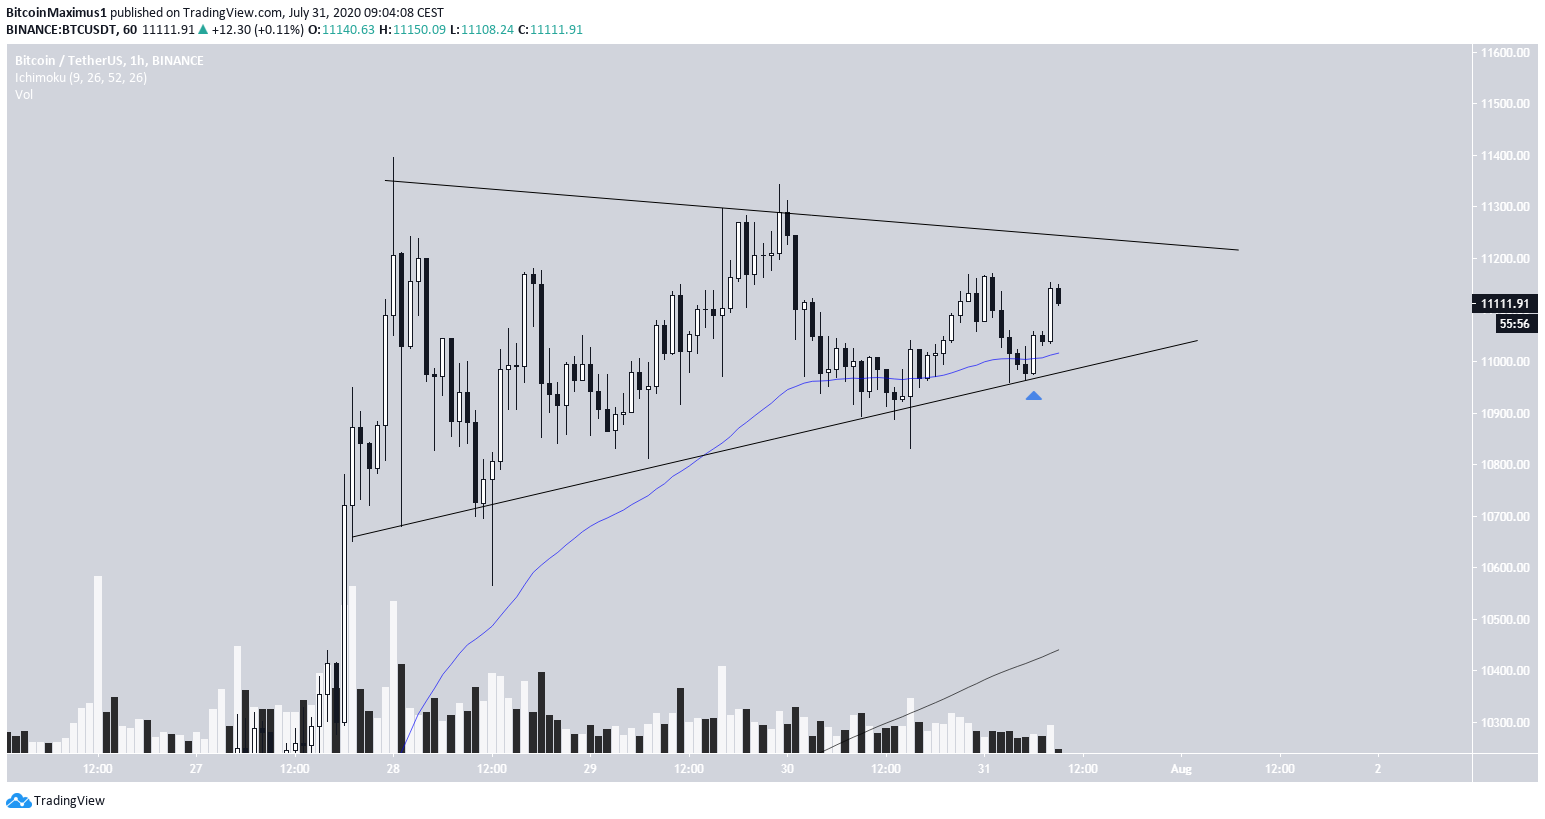
The hourly chart shows that the price is possibly trading inside a bullish pennant. The pattern is being created after an upward move, so a breakout would be expected. Furthermore, the support line of the pattern is strengthened by the 50-hour moving average (MA).
Therefore, as long as the support line holds, upwards continuation is considered a valid option. A breakdown from the ascending support line would confirm that the price will trend downwards. This could mean retargeting the support areas outlined in the previous section, which are also strengthened by the 200-hour MA.
Wave Count
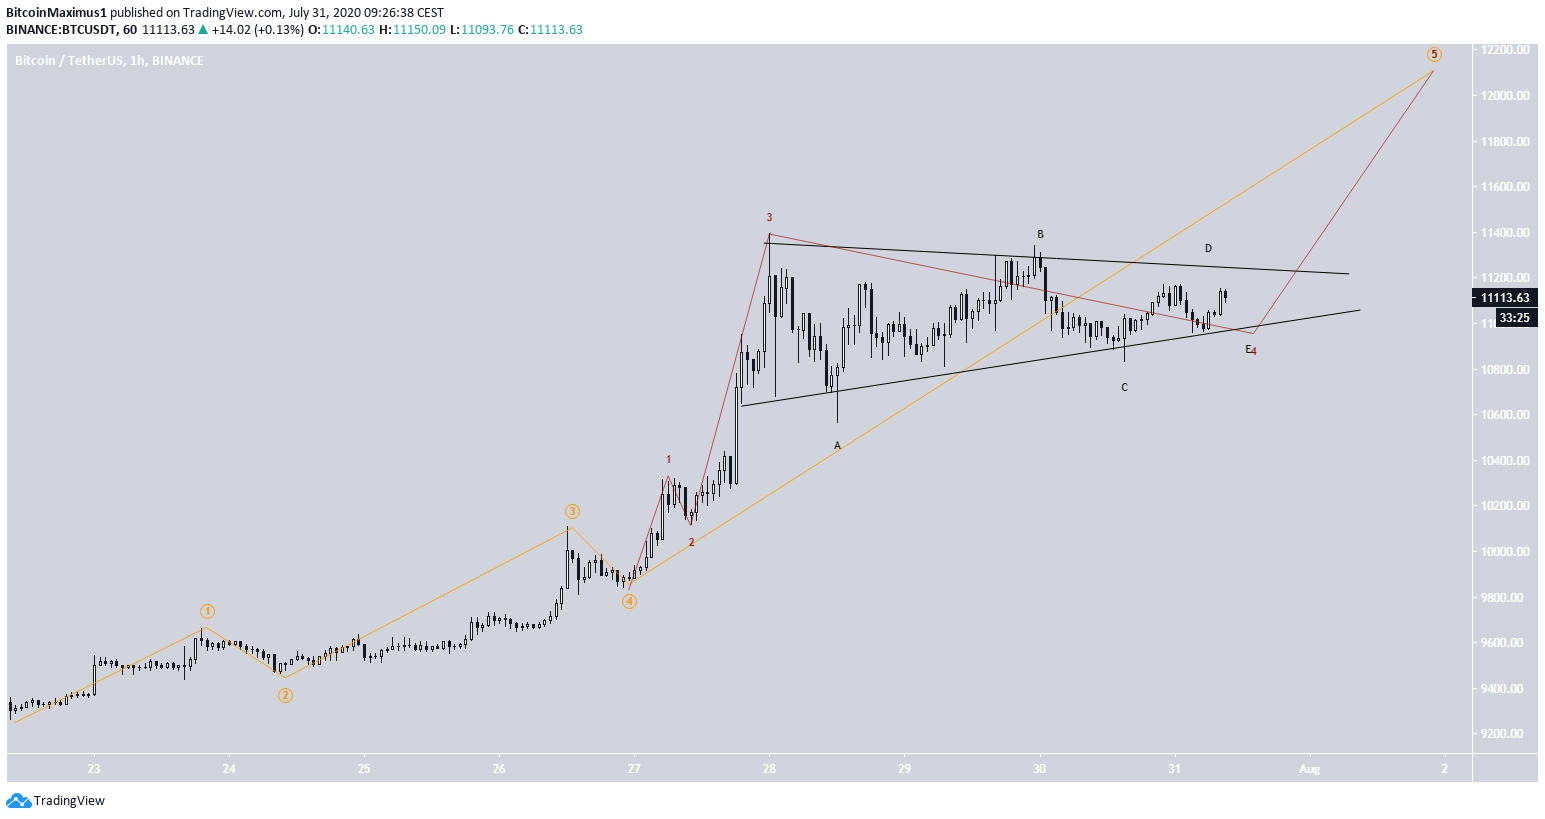
As for the wave count, there are two likely possibilities. BTC has either completed a five-wave Elliott formation which began on July 22 or is still in an extended fifth wave.
In the extended fifth wave scenario, the price is completing an a-b-c-d-e triangle as the fourth wave, and a breakout could take BTC towards $12,200.
This possibility is supported by the presence of the pennant and would be invalidated by a decrease below the (C) low of $10,814.
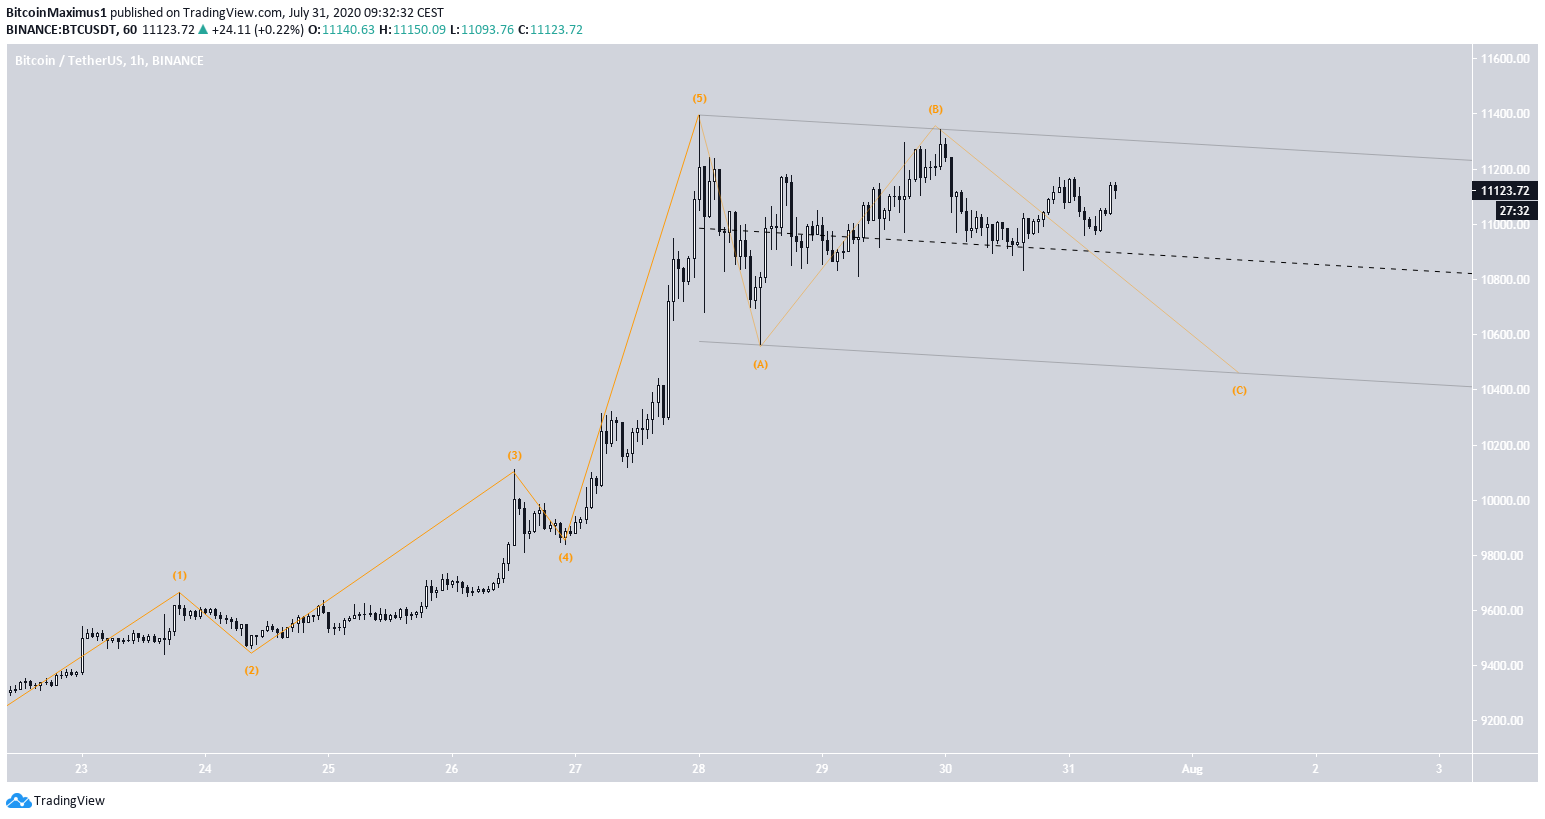
In the bearish scenario, the price currently inside the C-wave of an A-B-C correction. In this case, the price is likely trading inside a descending, parallel channel.
A breakout above the B-high would invalidate this scenario.
The projected decrease in this scenario would take the price towards $10,400, fitting with the support levels outlined in the first section.
The possibility of this scenario is supported by the decreasing momentum in the RSI and the MACD.
To conclude, the BTC price is either correcting or accumulating for another extension. Whether the price breaks out or down from the current pattern should help determine the direction of the next movement.
For our previous analysis, click here.


