


Bitcoin (BTC) is possibly trading inside an ascending triangle with resistance at $15,800.
The price movement and wave count suggest that an eventual breakout from the triangle is likely.
Bitcoin Rally Stalls
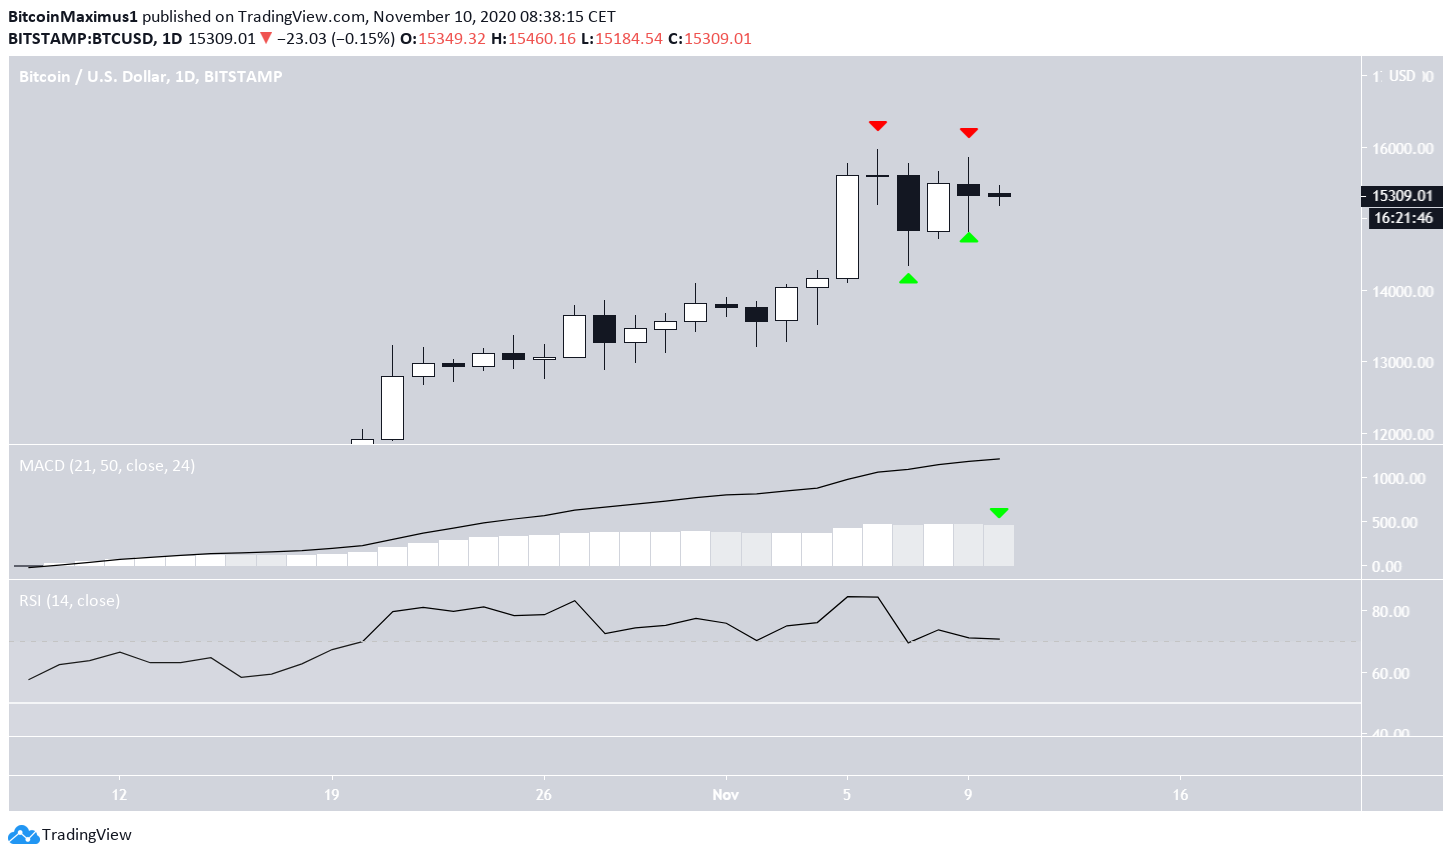
The Bitcoin price showed indecision on Nov 9. While it increased significantly the day prior, the price created a small bearish candlestick with wicks on each side yesterday, signaling indecision.
Technical indicators have possibly begun to show some weakness, but a trend reversal cannot yet be confirmed.
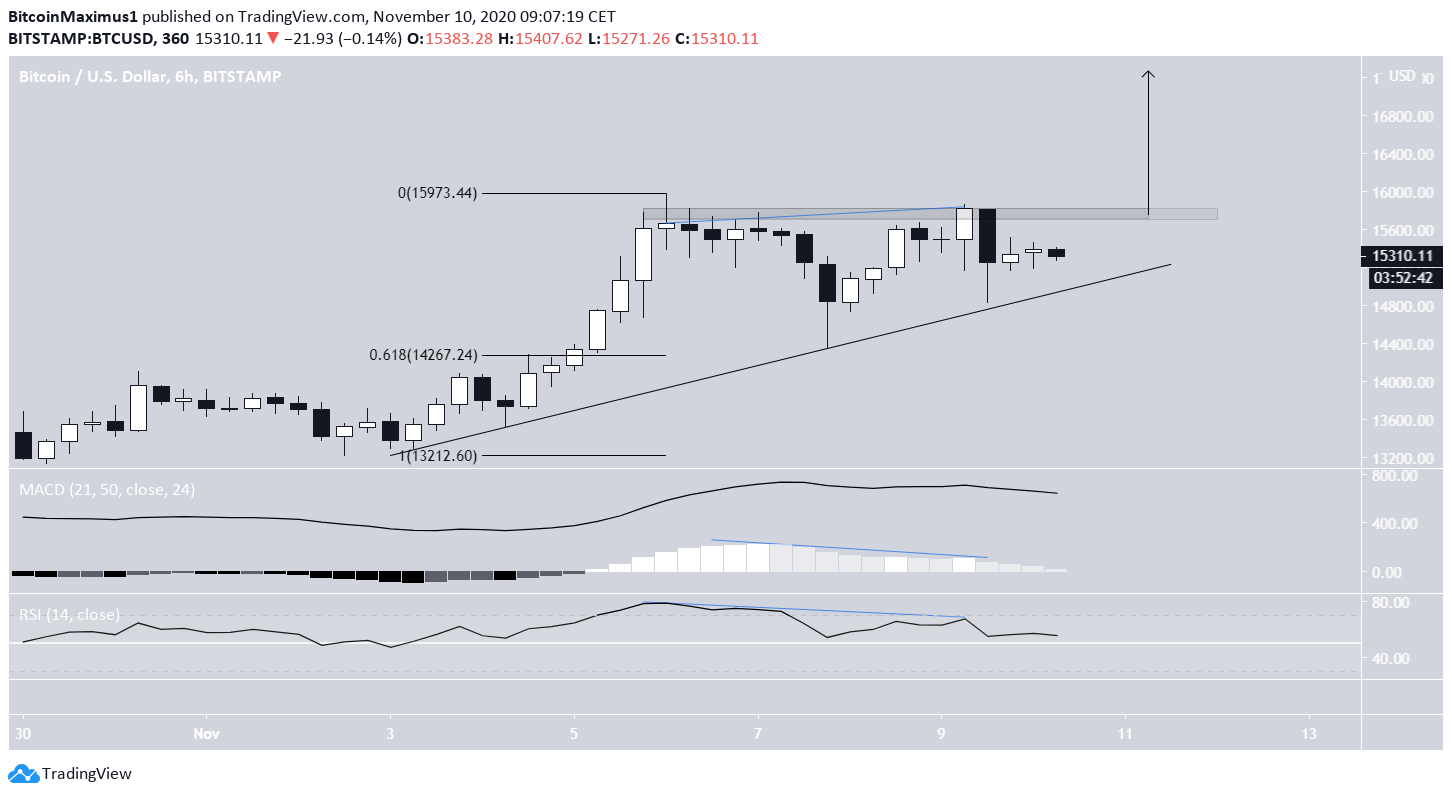
The shorter-term six-hour chart shows that the main resistance area is found near $15,800. The price was rejected by the area yesterday. BTC generated a considerable bearish divergence and dropped sharply afterward.
The decrease stopped once the price reached the ascending support line that has been in place since Nov 2. Combined, the support line and the resistance area possibly create an ascending triangle. This is a bullish pattern out of which a breakout is expected.
A breakout that travels the entire height of the pattern would take BTC all the way to $17,200.
On the other hand, a breakdown from the ascending support line would likely take the price all the way back to the $14,260 support level.
Future Movement
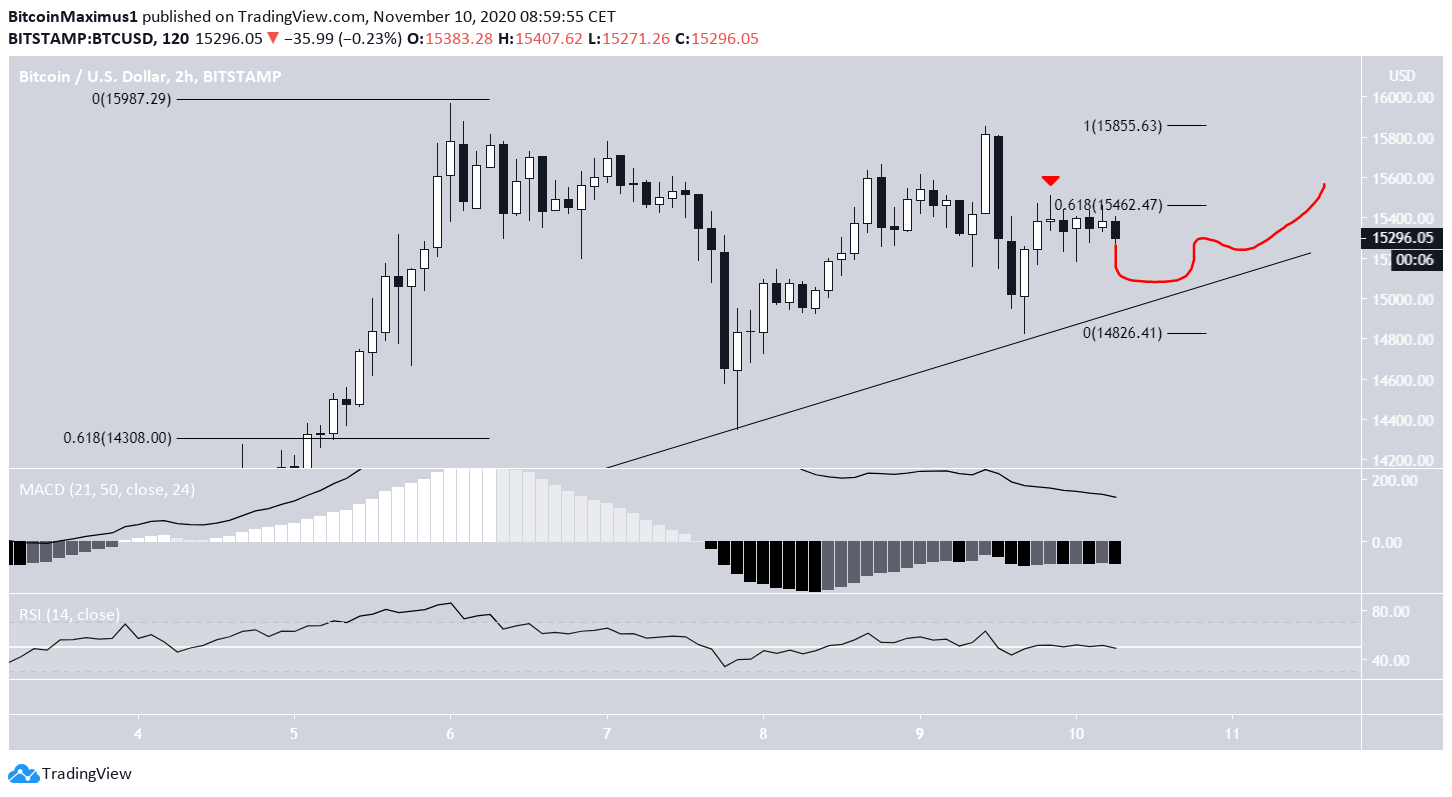
The two-hour chart shows that the price is still retracing as a result of yesterday’s decrease. Despite the bounce, BTC has not cleared the 0.618 Fib resistance level. Instead, it created a long upper wick just above the resistance before decreasing.
Technical indicators do not yet show any weakness since the RSI is above 50 and the MACD line is above 0.
Therefore, the most likely move would be some more consolidation above the ascending support line before an eventual breakout.
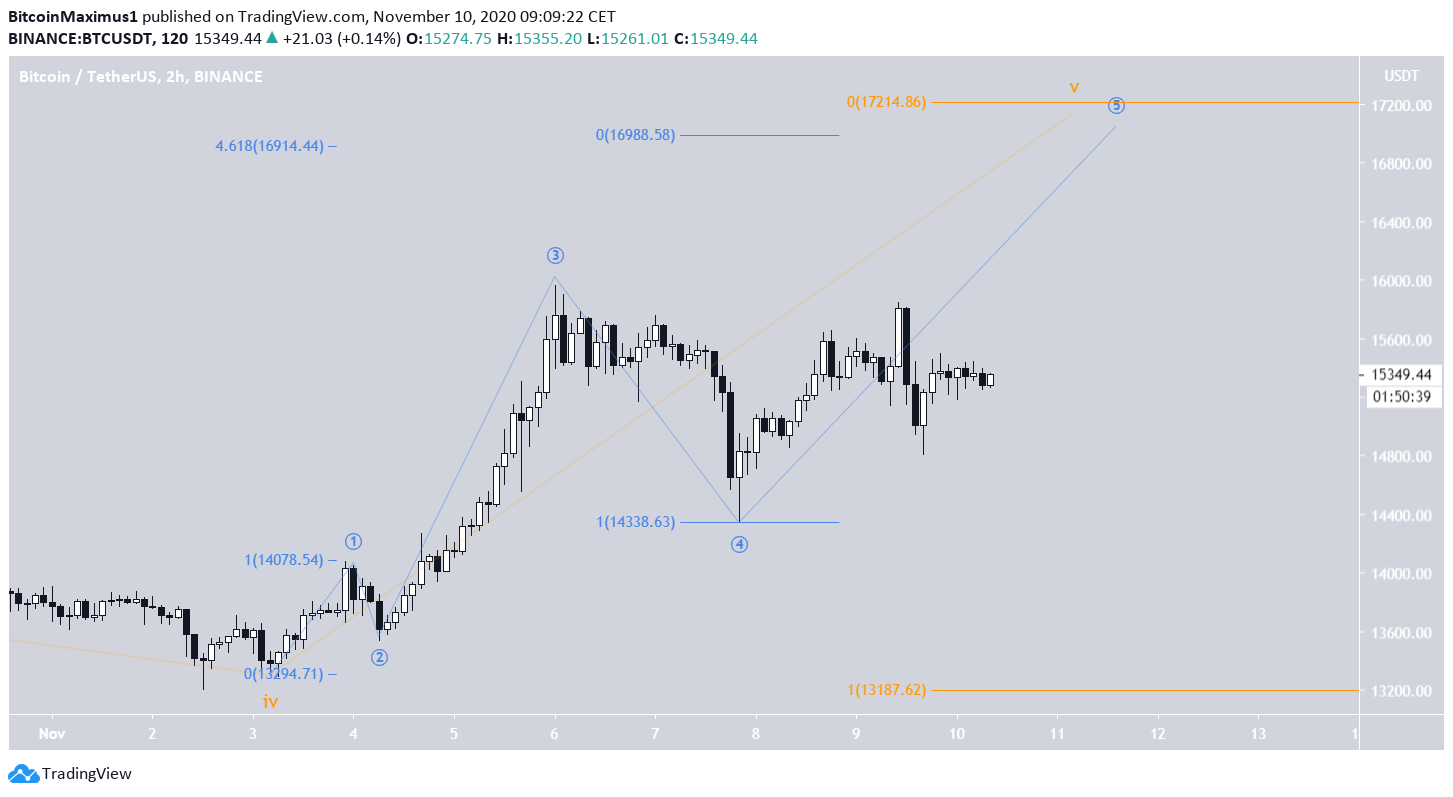
Bitcoin’s wave count also suggests that a similar increase will transpire, predicting a target between $16,900-$17,200.
The target is found by projecting the length of subwaves 1-3 to subwave 4 (blue & orange). This is also the 4.618 Fib extension of sub-wave 1 (blue).
Conclusion
To conclude, the BTC price is expected to consolidate inside its pattern before eventually breaking out to target $17,000.
For BeInCrypto’s latest Bitcoin analysis, click here!
Disclaimer: Cryptocurrency trading carries a high level of risk and may not be suitable for all investors. The views expressed in this article do not reflect those of BeInCrypto.


