


The Bitcoin (BTC) price is nearing the top of a bullish impulse that has been transpiring since the beginning of March.
Technical indicators suggest that BTC may make at least one more upward move to complete the pattern before reaching a top.
Long-Term Bitcoin Wave Count
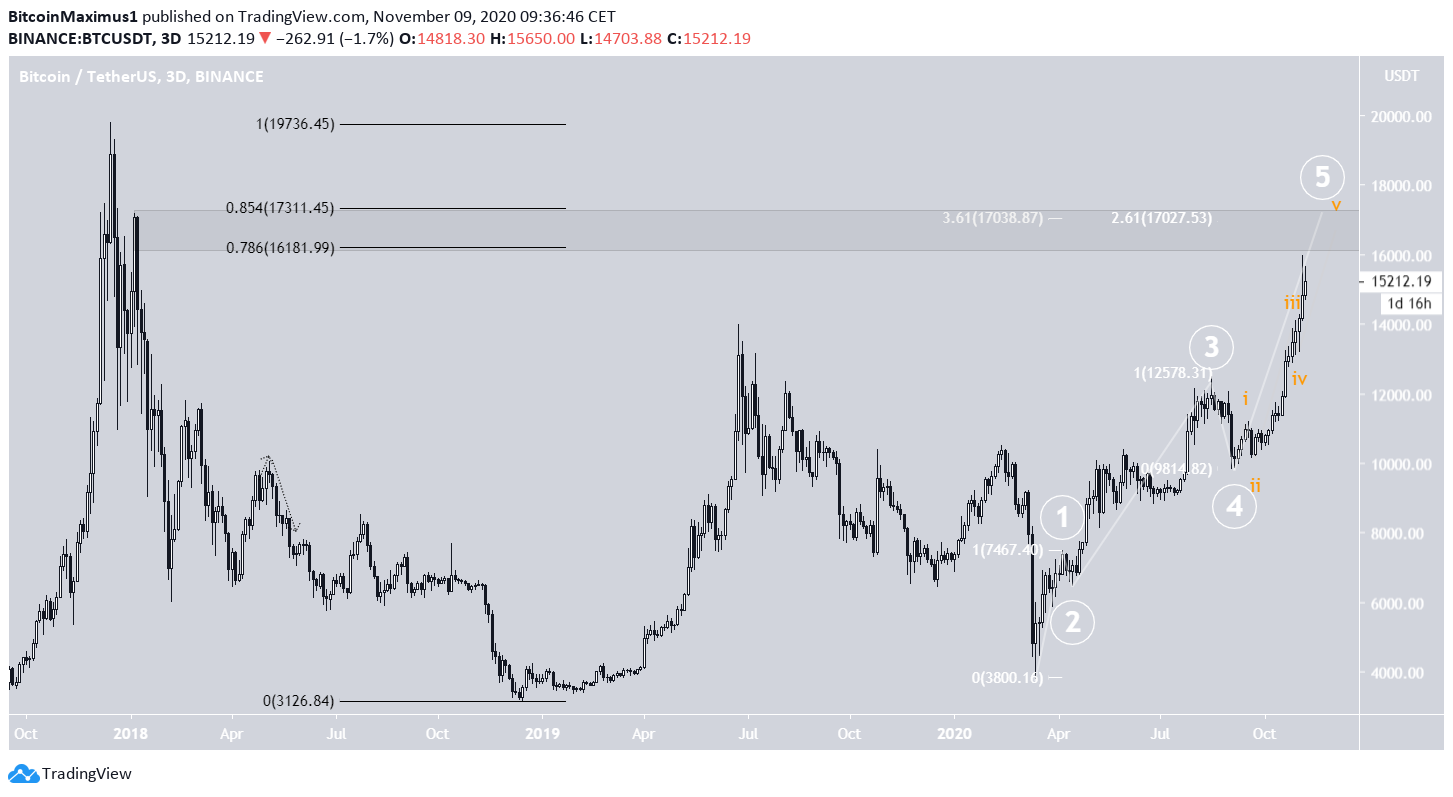
The Bitcoin price has been rapidly increasing in what looks to be a bullish impulse (shown in white below) since the beginning of March. If this pattern is correct, then BTC is likely in the fifth-and-final wave of this move.
The most likely target for wave 5 to end would be near $17,000, a target found using the 3.61 Fib extension of wave 1 and 2.61 external retracement of wave 4. This target also coincides with the 0.85 Fib retracement (black) of the entire downward move from the December 2017 all-time high price.
Inside the Fifth Wave
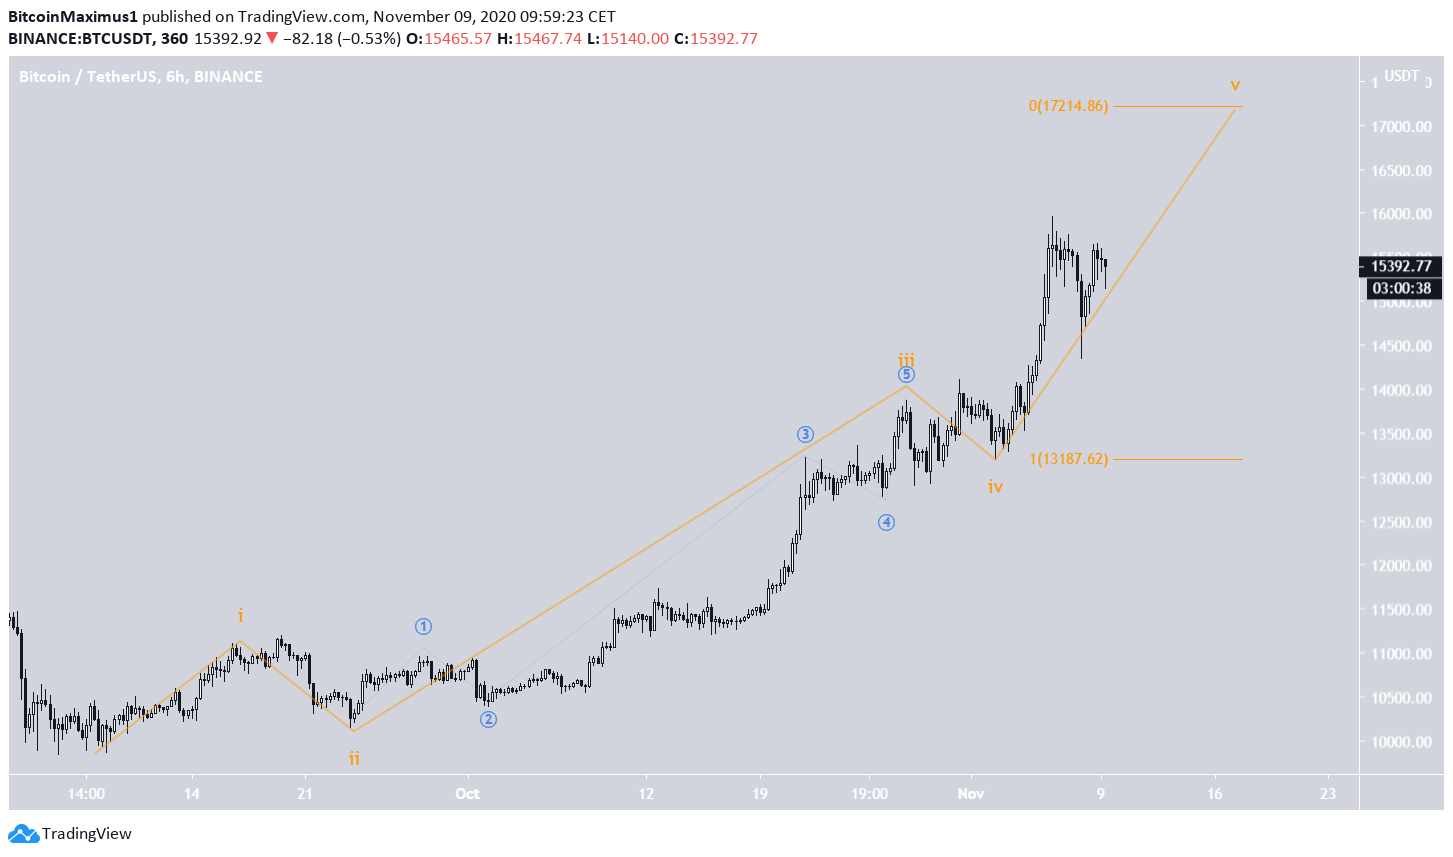
A closer look at the aforementioned fifth wave shows that the price could already be in the fifth-and-final sub-wave (orange). Projecting the length of waves 1-3 gives us a target of $17,214, fitting perfectly with that given by the longer-term count.
A decrease below the bottom of wave 4 at $13,187 would invalidate this particular wave count.
Short-Term Movement
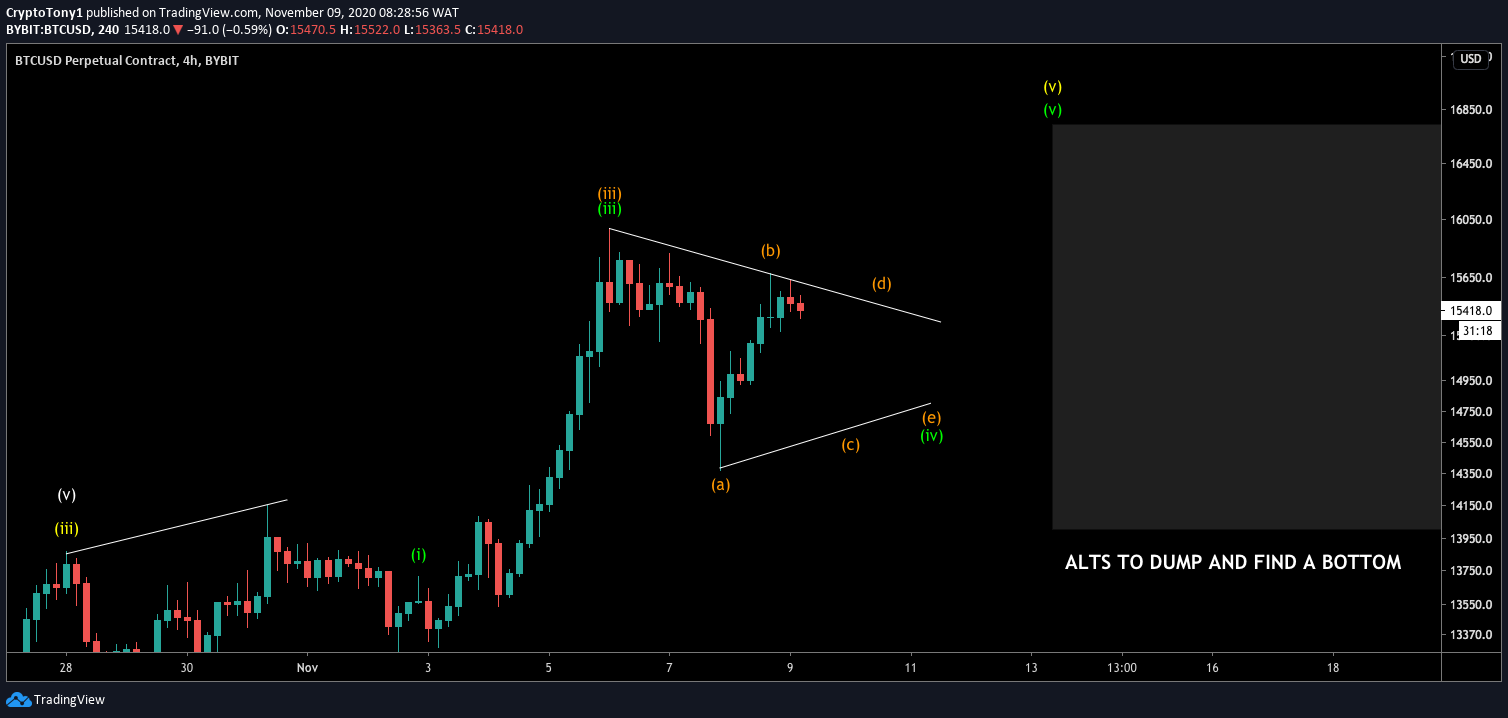
Cryptocurrency trader @CryptoTony_ outlined a potential wave count for BTC that shows the price trading inside a symmetrical triangle in order to complete the current minor sub-wave 4.
A breakout prediction is also outlined forecasting an end to the pattern near $17,000.
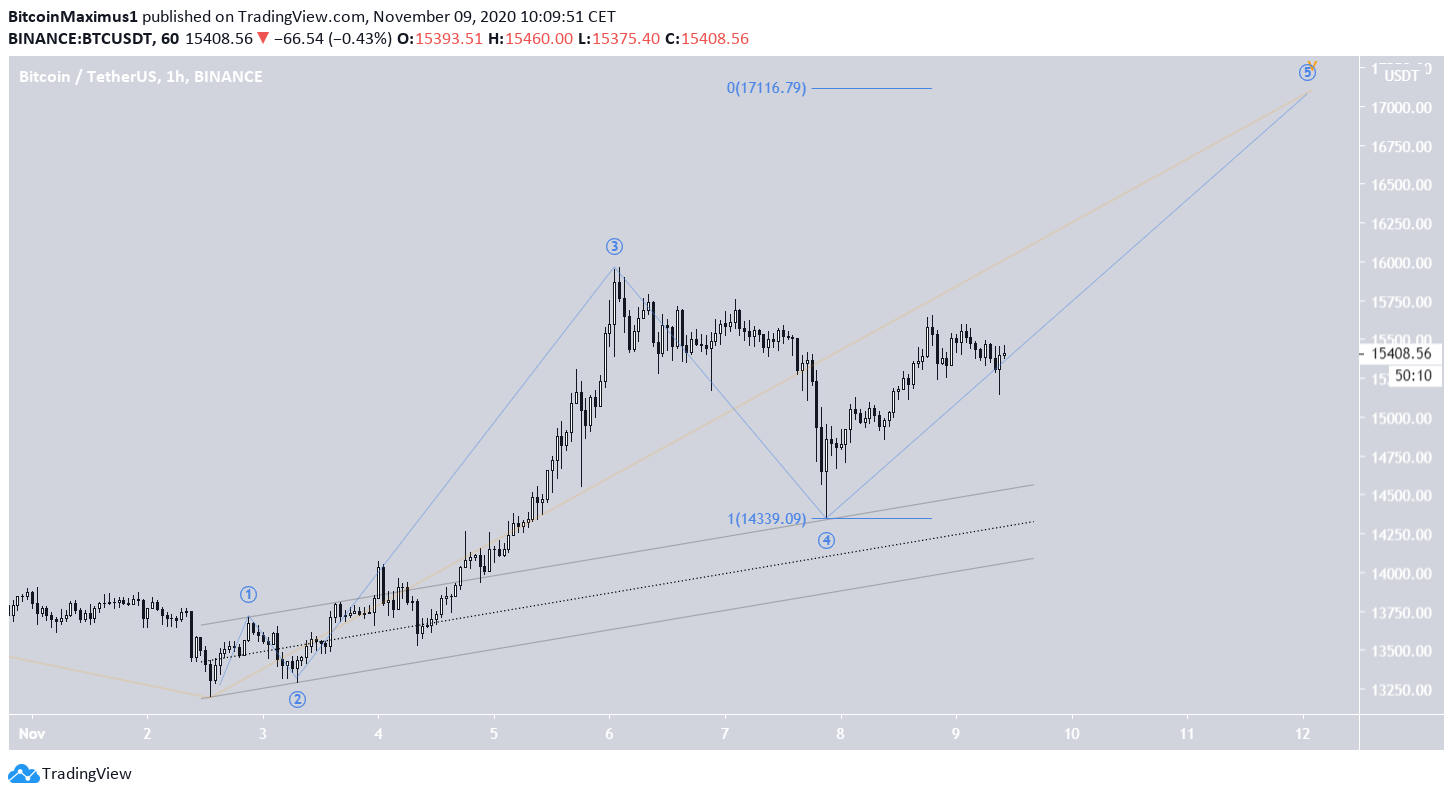
The minor sub-wave count (blue) for the aforementioned sub-wave 5 also suggests that the price is nearing the end of the movement, giving us a similar target near $17,116.
However, instead of a triangle correction, it appears that BTC has already completed minor sub-wave 4 by reaching a low of $14,439 on Nov 7. The low also served to validate a resistance line from a parallel channel in what is known as a fourth wave pullback.
Therefore, it is more likely that the price has already completed its correction rather than still trading inside a triangle.
Conclusion
While Bitcoin seems to be nearing the end of its upward move, several Fib confluence levels indicate that the price is more likely to reach a high near $17,100 before eventually decreasing.
For BeInCrypto’s latest Bitcoin analysis, click here!
Disclaimer: Cryptocurrency trading carries a high level of risk and may not be suitable for all investors. The views expressed in this article do not reflect those of BeInCrypto.


