
Bitcoin (BTC) surged roughly 6% in the last 24 hours following Trump’s announcement of a 90-day tariff pause for most countries—excluding China. However, technical indicators suggest that while buyers are stepping in, the upward trend might not be strong enough.
The DMI shows rising positive pressure but a weakening overall trend. Meanwhile, the EMA structure hasn’t confirmed a full reversal, leaving the door open for both further gains or a potential pullback if momentum stalls.
Bitcoin DMI Shows Buyers Are In Control, But The Trend Isn’t That Strong
Bitcoin’s Directional Movement Index (DMI) chart reveals a noticeable shift in momentum. The ADX (Average Directional Index), which measures the strength of a trend, has dropped to 19.48 from 29.56 just three days ago—indicating weakening trend intensity.
An ADX reading above 25 typically signals a strong trend (bullish or bearish), while readings below 20 suggest the market is either consolidating or lacking a clear direction. With ADX now below the 20 threshold, Bitcoin may be entering a period of reduced volatility and indecision.
Looking deeper into the components, the +DI (Positive Directional Indicator) is currently at 28.41, a sharp jump from 20.84 just yesterday following Trump’s 90-day tariffs suspension, excluding China.
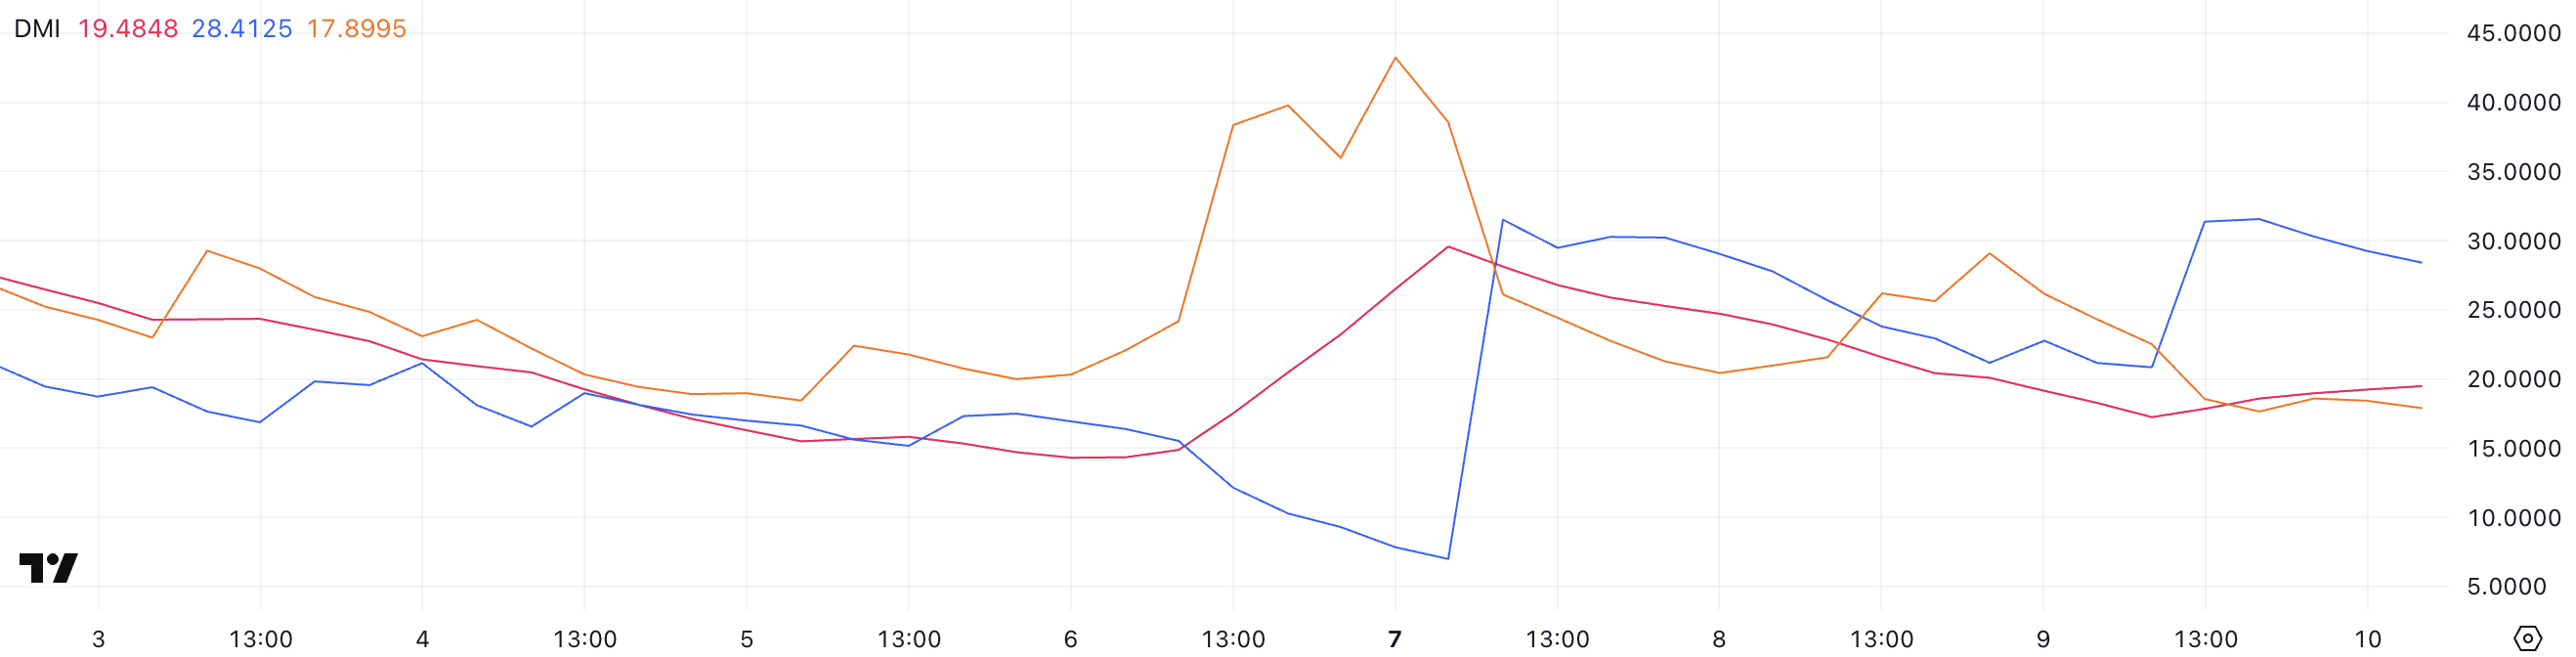
This suggests an uptick in bullish pressure. Meanwhile, the -DI (Negative Directional Indicator) has fallen to 17.89, down from 29 two days ago, pointing to fading bearish momentum.
While the surge in +DI might seem encouraging, it has since pulled back from a high of 31.55 seen just a few hours ago—hinting that the initial bullish reaction could be cooling off.
Altogether, despite signs of buying strength, the drop in ADX and the retreat in +DI may signal that BTC lacks the conviction to sustain a breakout in the near term.
BTC Ichimoku Cloud Shows Cautious Optimism
Bitcoin’s current Ichimoku Cloud setup shows a mixed but cautiously optimistic structure. The price action is sitting just above the red cloud (Kumo), suggesting a recent bullish breakout.
However, this breakout still lacks strong conviction, as the cloud ahead remains flat and relatively thin—indicating weak momentum and potential resistance.
The Leading Span A (green line forming the top of the future cloud) is slightly angled upward, but the lack of separation from Span B (red line forming the bottom of the cloud) suggests limited bullish strength for now.
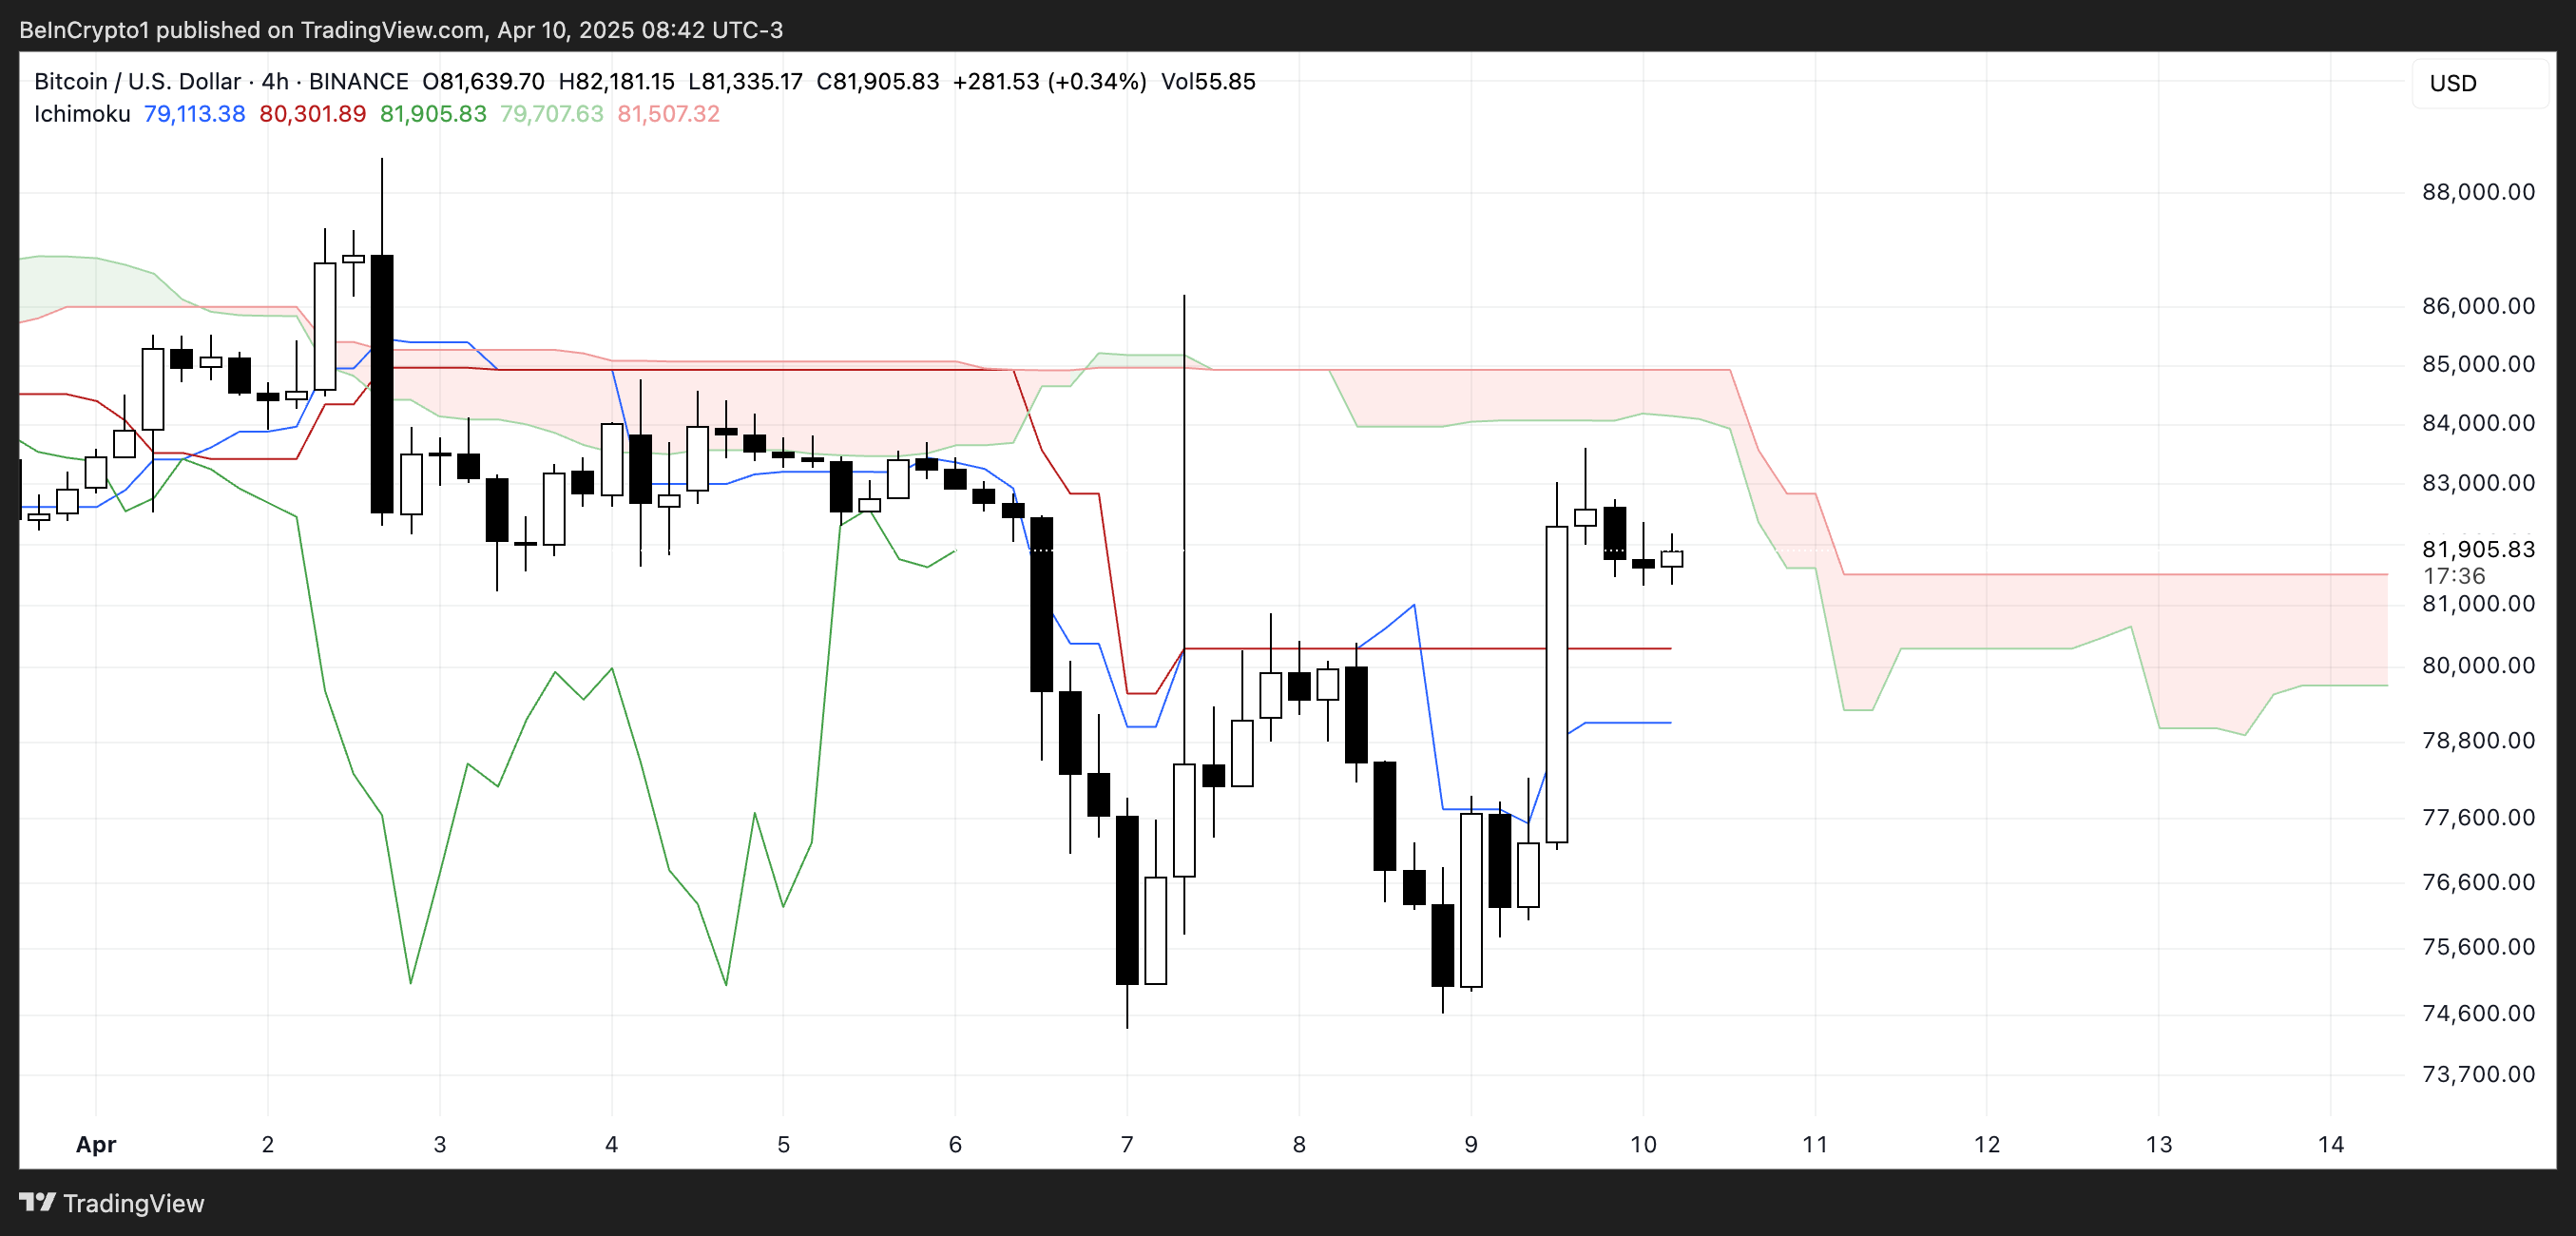
The Tenkan-sen (blue line) and Kijun-sen (red line) recently experienced a bullish crossover, with the Tenkan-sen climbing above the Kijun-sen—a positive signal in traditional Ichimoku interpretation.
However, the flat nature of the Kijun-sen and the current consolidation of price just above the cloud could indicate that Bitcoin is entering a short-term equilibrium phase rather than preparing for a strong continuation.
The Chikou Span (lagging green line) is now above the price candles and the cloud, which supports a bullish bias—but only if follow-through occurs.
Overall, while the structure is leaning bullish, the thin cloud and lack of strong momentum suggest caution until more decisive signals appear.
Will Bitcoin Continue Surging In The Next Few Days?
Despite Bitcoin’s recent upward move, its EMA structure still leans bearish, with short-term exponential moving averages remaining below the long-term ones.
This alignment typically signals ongoing downside pressure, even in the face of short-term rallies.
However, if the current momentum persists and a golden cross forms—where shorter-term EMAs cross above the longer-term ones—it could mark a shift in trend strength.

Such a breakout could open the path to testing resistance levels, with potential upside targets around $85,124. If broken, further upside could be to $88,839 and even $92,920.
Despite that, Bitcoin remained flat after US CPI (Consumer Price Index) showed inflation cooled last month.
On the other hand, analysts remain cautious about whether the recent bounce is just a temporary relief rally. If Bitcoin fails to confirm a trend reversal, the price could retreat to test support around $79,955.
Losing that level would likely expose Bitcoin price to a deeper pullback toward $76,642. If macro uncertainty re-emerges—such as renewed tariff pressures from the Trump administration—it could exacerbate risk-off sentiment and drive BTC down as far as $74,389.
