
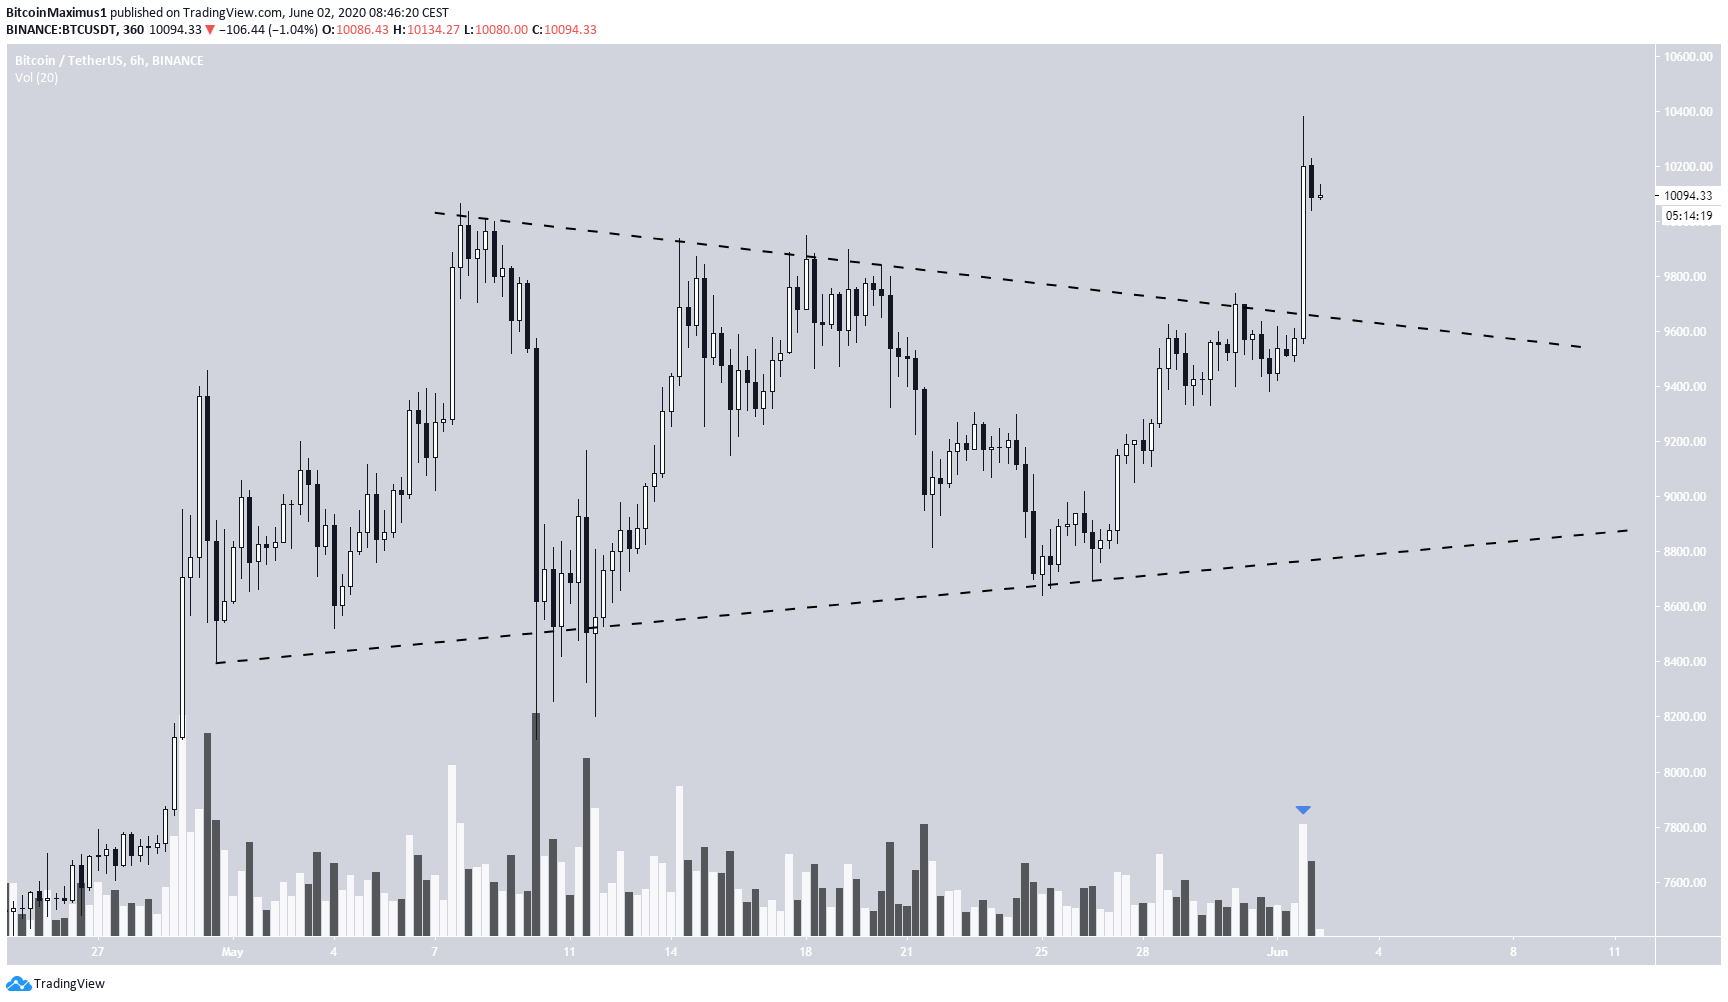
On June 1, the Bitcoin price broke out from a long-term symmetrical triangle that had been in place since April 30.
This caused the price to increase all the way to a long-term resistance area found at $10,400.
Bitcoin Breakout
On June 1, the Bitcoin price broke out from a long-term symmetrical triangle and created a bullish engulfing candlestick with considerable volume. The price reached a high of $10,400 before decreasing slightly towards $10,100, where it is trading at the time of writing.
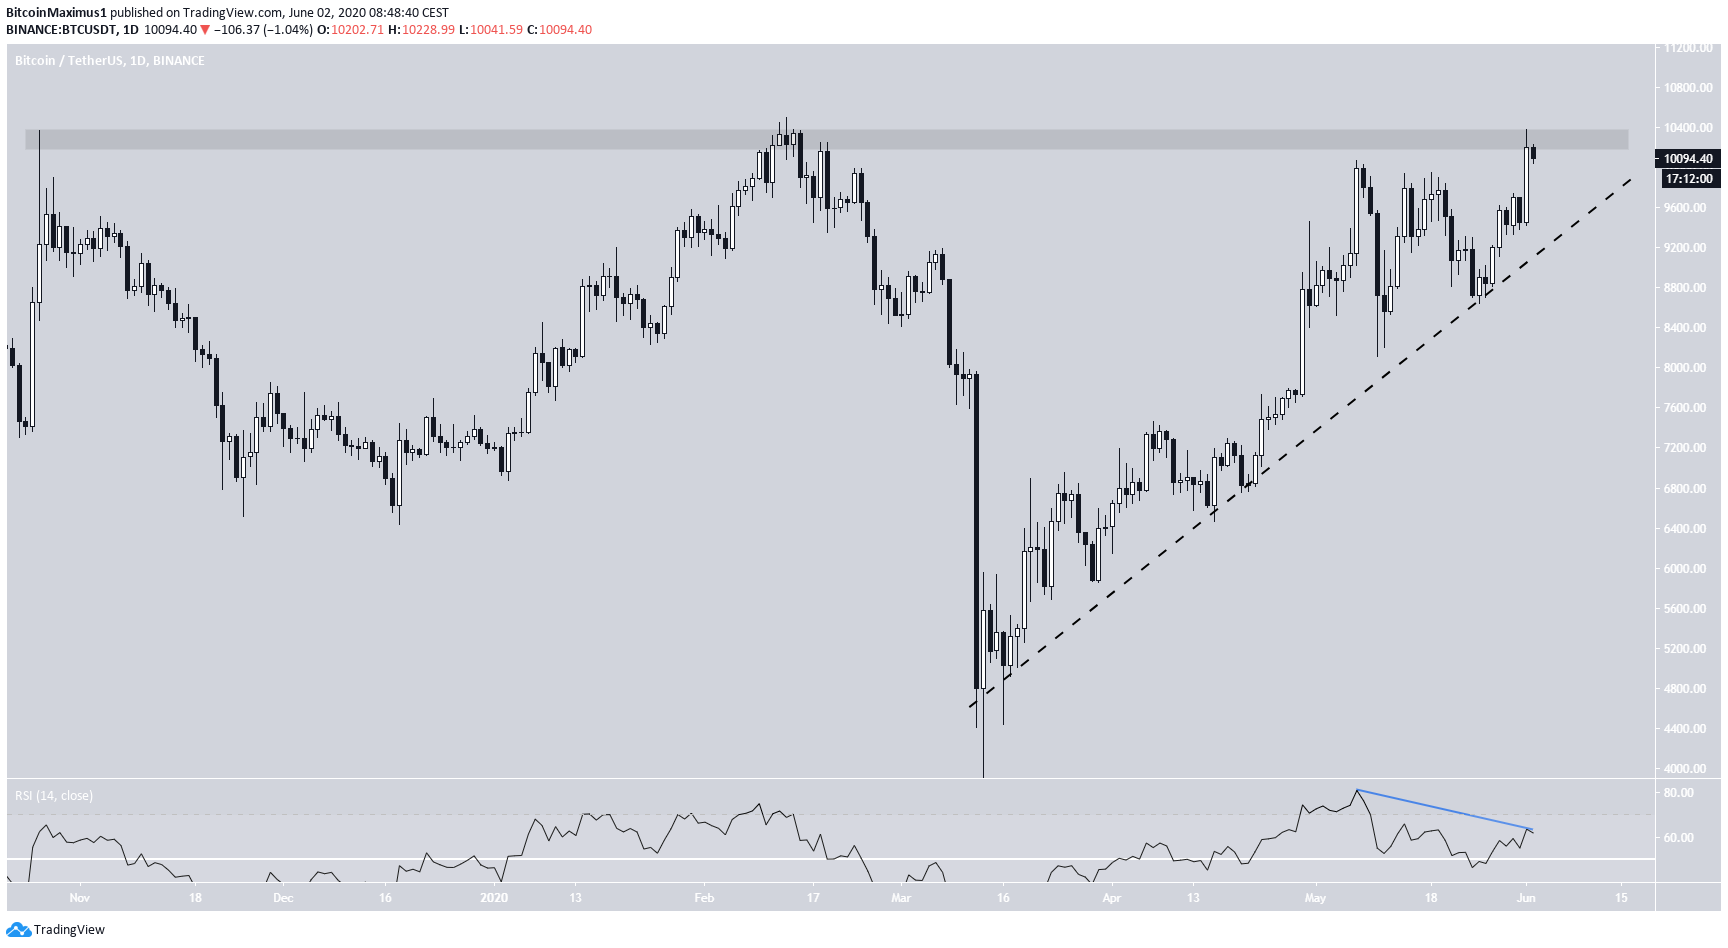
Long-Term Resistance
In the longer-term, we can see that the main resistance area is found at $10,400, and the price has possibly created a triple-top inside of it. The price has not traded above this level since September 2019. The price is also following a very steep ascending support line, which is currently providing support near $9,500.
Besides the fact that BTC is trading inside a resistance area, there is a considerable bearish divergence developing in the RSI. Along with the possible triple-top, which is considered a bearish reversal pattern, this is a sign that BTC is likely to move downwards.
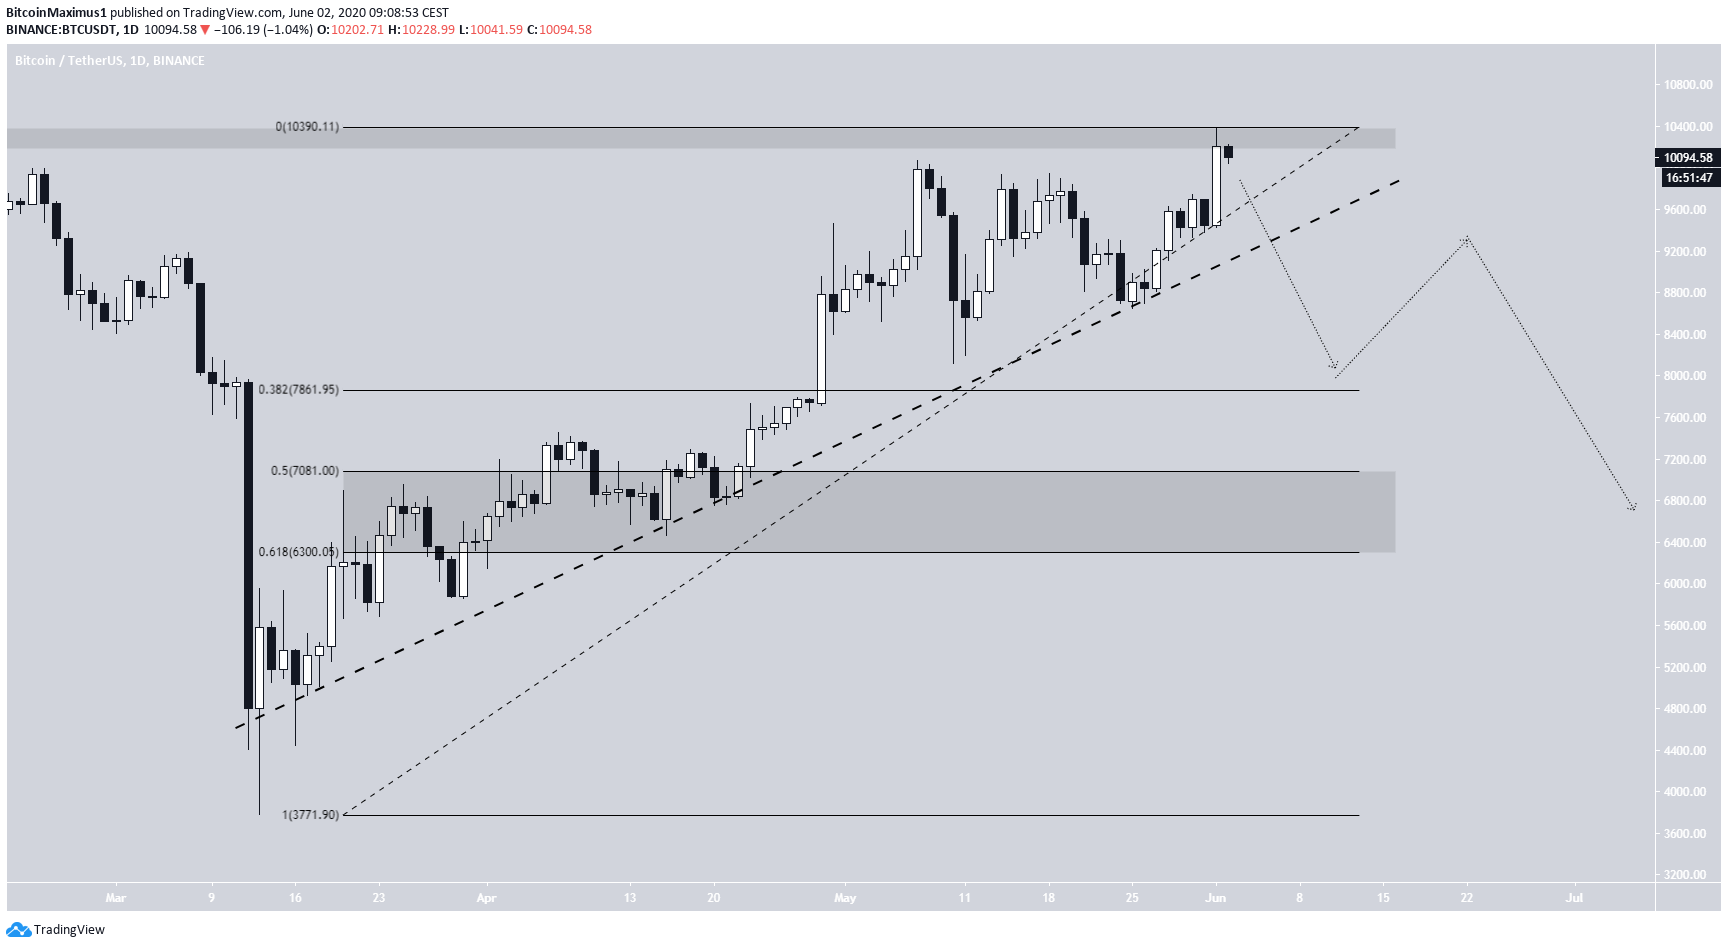
If a breakdown were to occur, the price would likely bounce at the 0.382 Fibonacci level of the entire upward move at $7,800 before increasing to validate the ascending support line and eventually settling between $6,000-$7,000.
While the exact future movement for BTC cannot be so easily determined, it is very likely that whenever the ascending support line breaks, a long corrective period is likely to ensue.
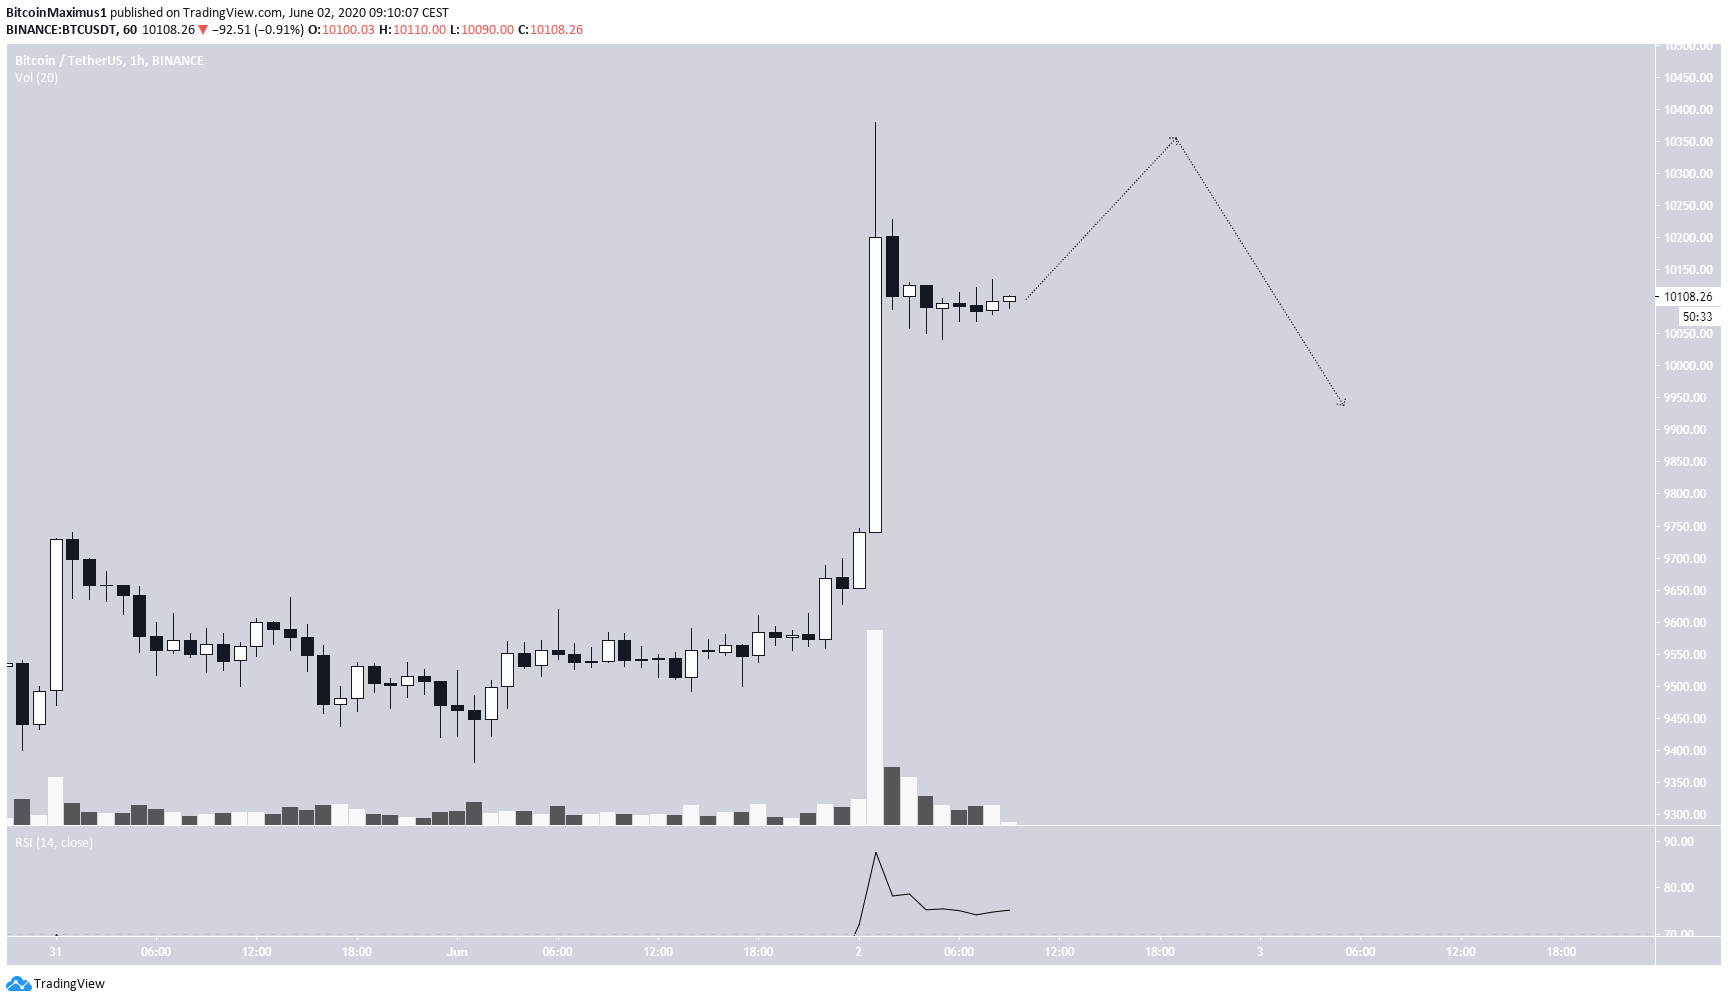
Short-Term Movement
In the short-term, the price is gradually decreasing after yesterday’s rapid increase. There is no bearish divergence in the RSI yet.
Therefore, it is very likely that the price will make another attempt at $10,400. The presence of divergence if/when the price gets should determine if BTC will move downwards.
For our previous analysis, click here.
