


During the week of May 25-31, the Bitcoin price increased considerably, increasing from the mid $8,000s to a high of $9,742 and closed at $9,440.
However, the price has yet to break out from its current pattern.
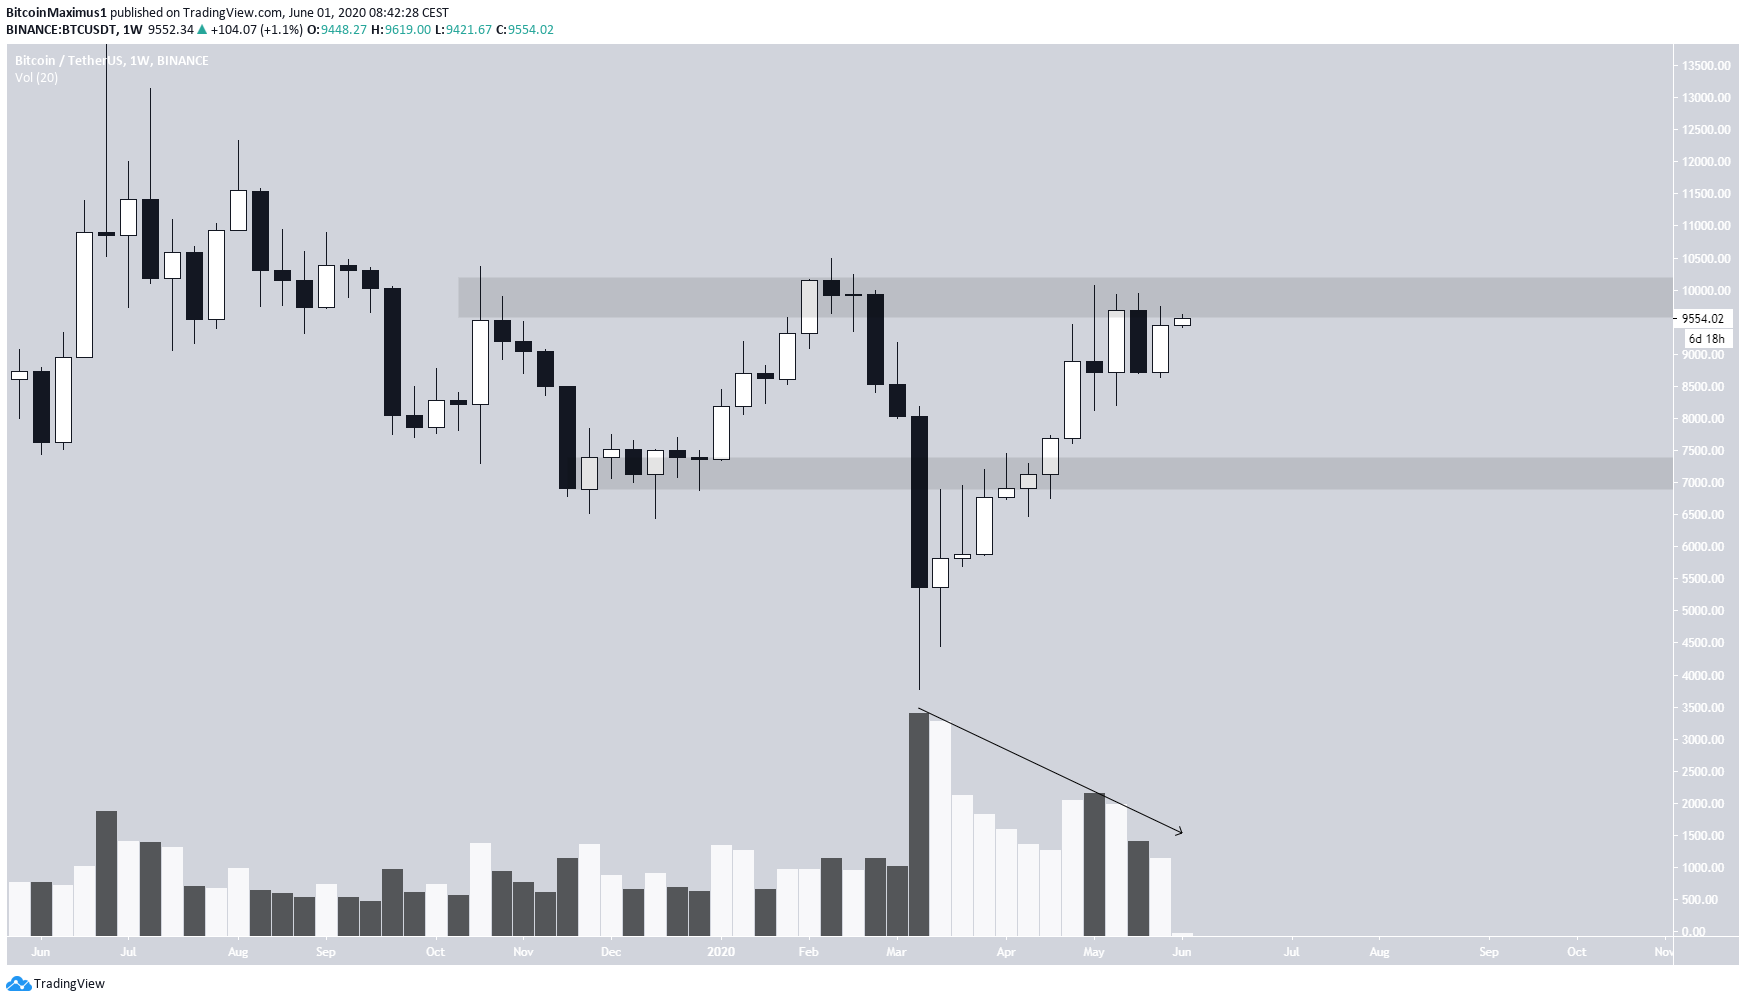
Bitcoin Weekly Outlook
The Bitcoin price increased considerably last week, creating a bullish candlestick in the process. However, the candlestick was contained within the body of the previous bearish engulfing candlestick. Furthermore, the price created a small upper-wick, a sign of selling pressure.
The closest resistance and support levels are found at $10,000 and $7,000, respectively. It is worth noting that the volume has been decreasing consistently since the March 13 bottom.
Until the price breaks out/down from the outlined resistance and support levels, we cannot state with certainty the direction of the trend. However, due to the reasons outlined, it seems that BTC will not be able to break out above the resistance area in its current attempt.
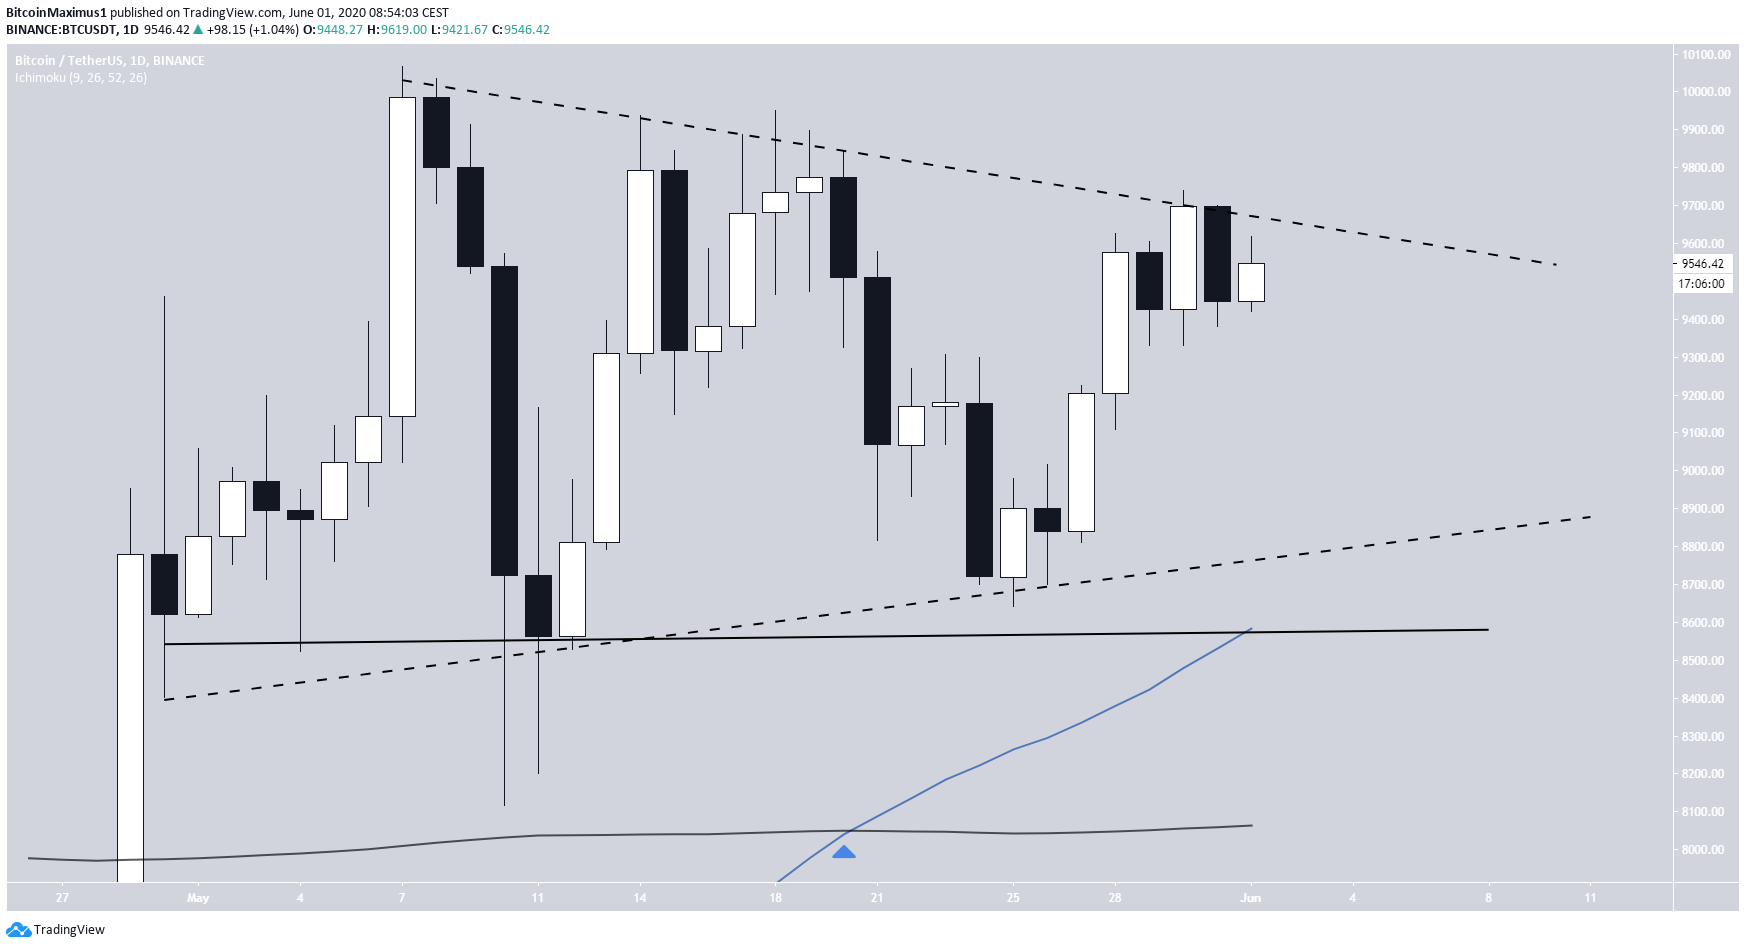
Daily Outlook
The daily outlook reveals that the price is trading either inside a symmetrical or descending triangle, due to the fact that the slope of the support line is not entirely clear.
However, the resistance line has been validated four times, most recently on May 30, causing a strong rejection and a decrease.
The symmetrical triangle is considered a neutral pattern, making both a breakout and a breakdown likely. However, since the triangle is transpiring after an upward move, a breakout would be more likely.
The 50 and 200-day moving averages (MA) have previously made a bullish cross, and the 50-day MA is currently very close to the support line. Therefore, it is possible that we will see a downward move towards the support line that also serves to validate the MA.
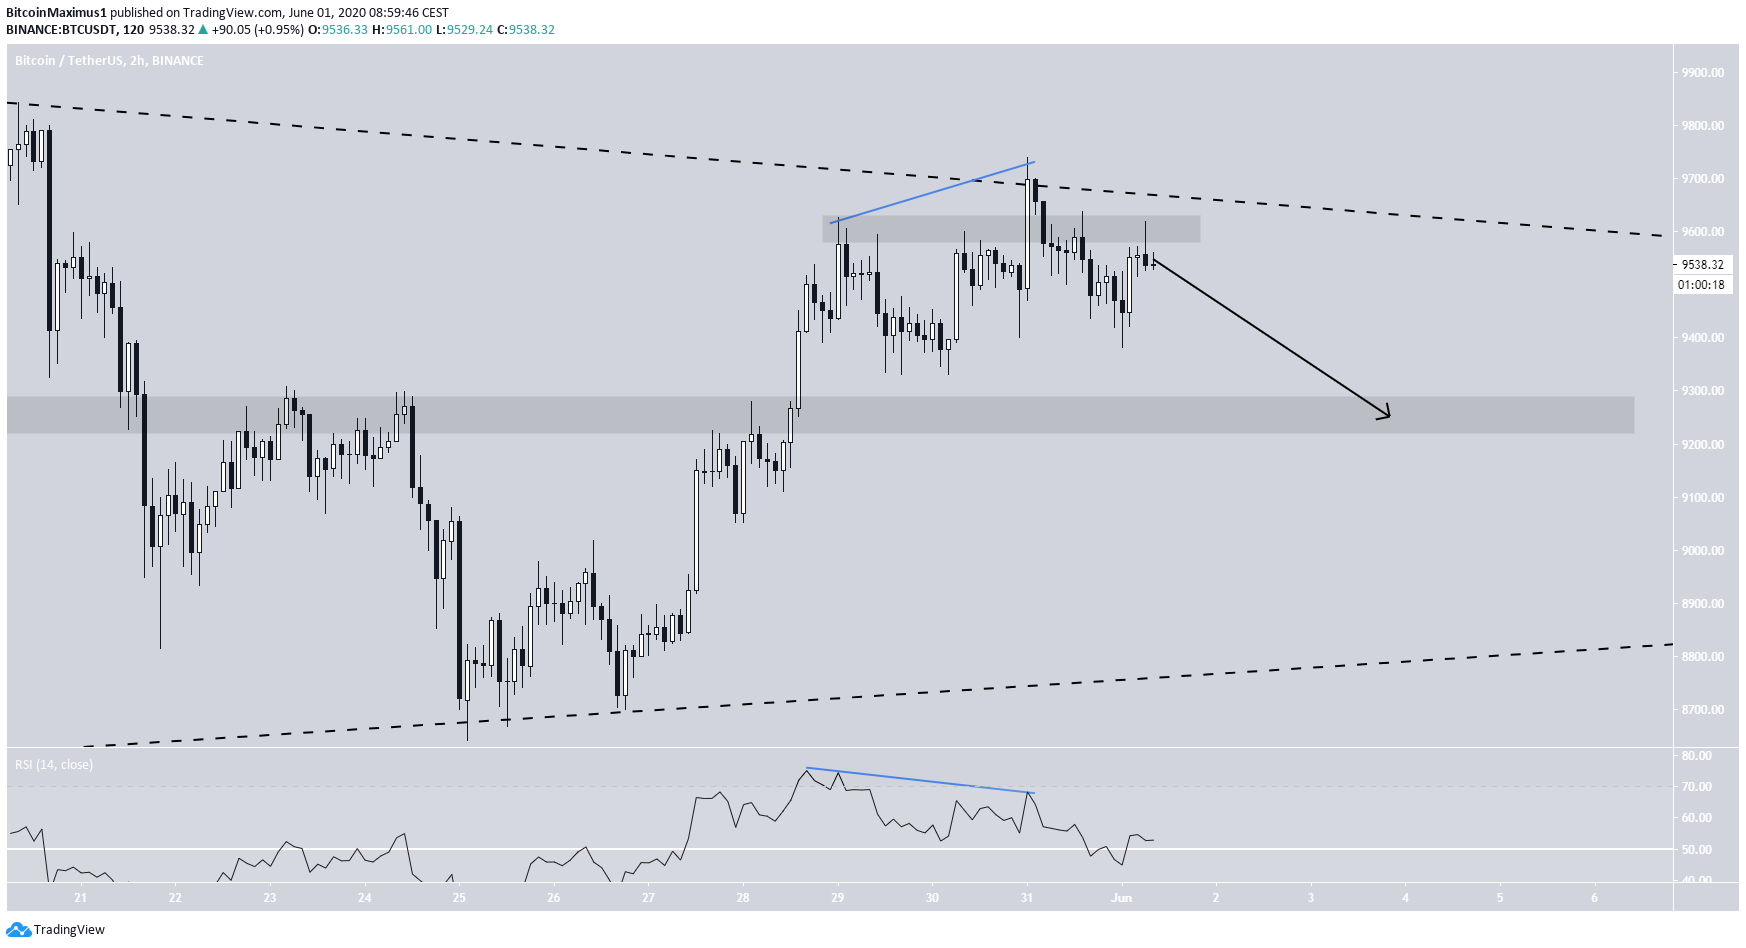
Double-Top
In the shorter-term, the price has created a double-top at the resistance line of the triangle that has been combined with bearish divergence. Furthermore, the price has lost the support of the $9,600 area, which has now turned to resistance. BTC is expected to decrease towards the $9,250 area, near the middle of the triangle.
For our previous analysis, click here.


