
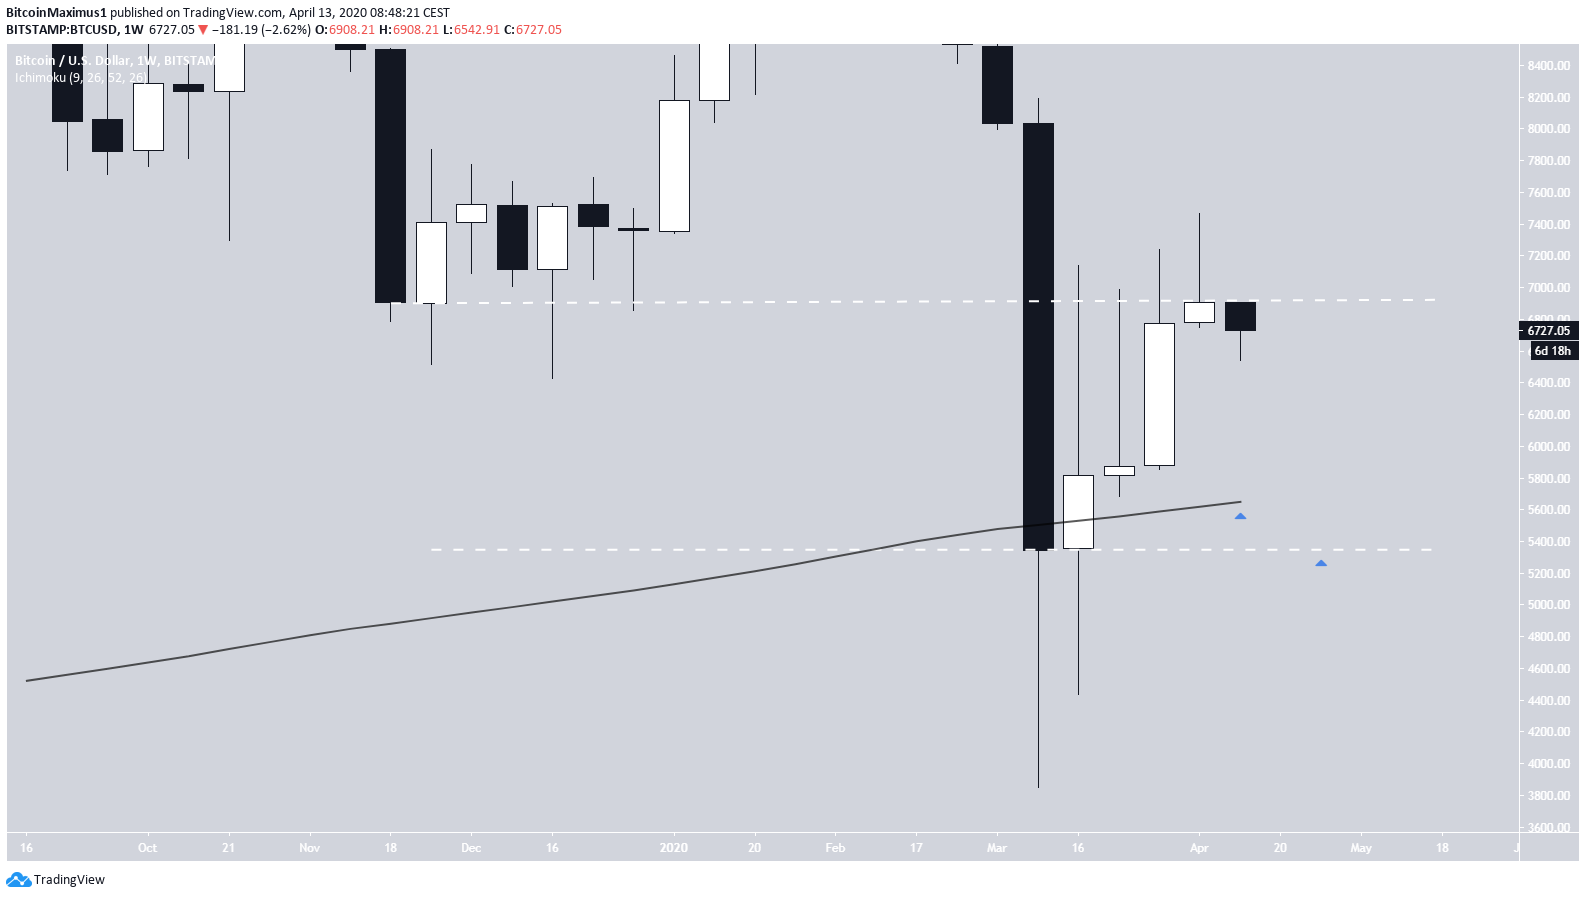
During the week of April 5-12, the BTC price failed to reach a close above a significant resistance level found at $6,800.
Even though it initially climbed above this resistance, it proceeded to create a long upper-wick and close below. This occurrence has bearish implications for the medium-term trend.
Bitcoin’s Weekly Outlook
The BTC weekly candlestick has reached a close for the week of April 5-12 below the most important support level turned resistance at $6,800. Furthermore, BTC has created a long upper-wick and a very small real body, a bearish sign when viewed together.
The failure to move above the previous support level suggests that the price is likely to go down. If it does so, the 200-week moving average (MA) is found at $5,650, while the next support level is around $5,350.
Future Movement
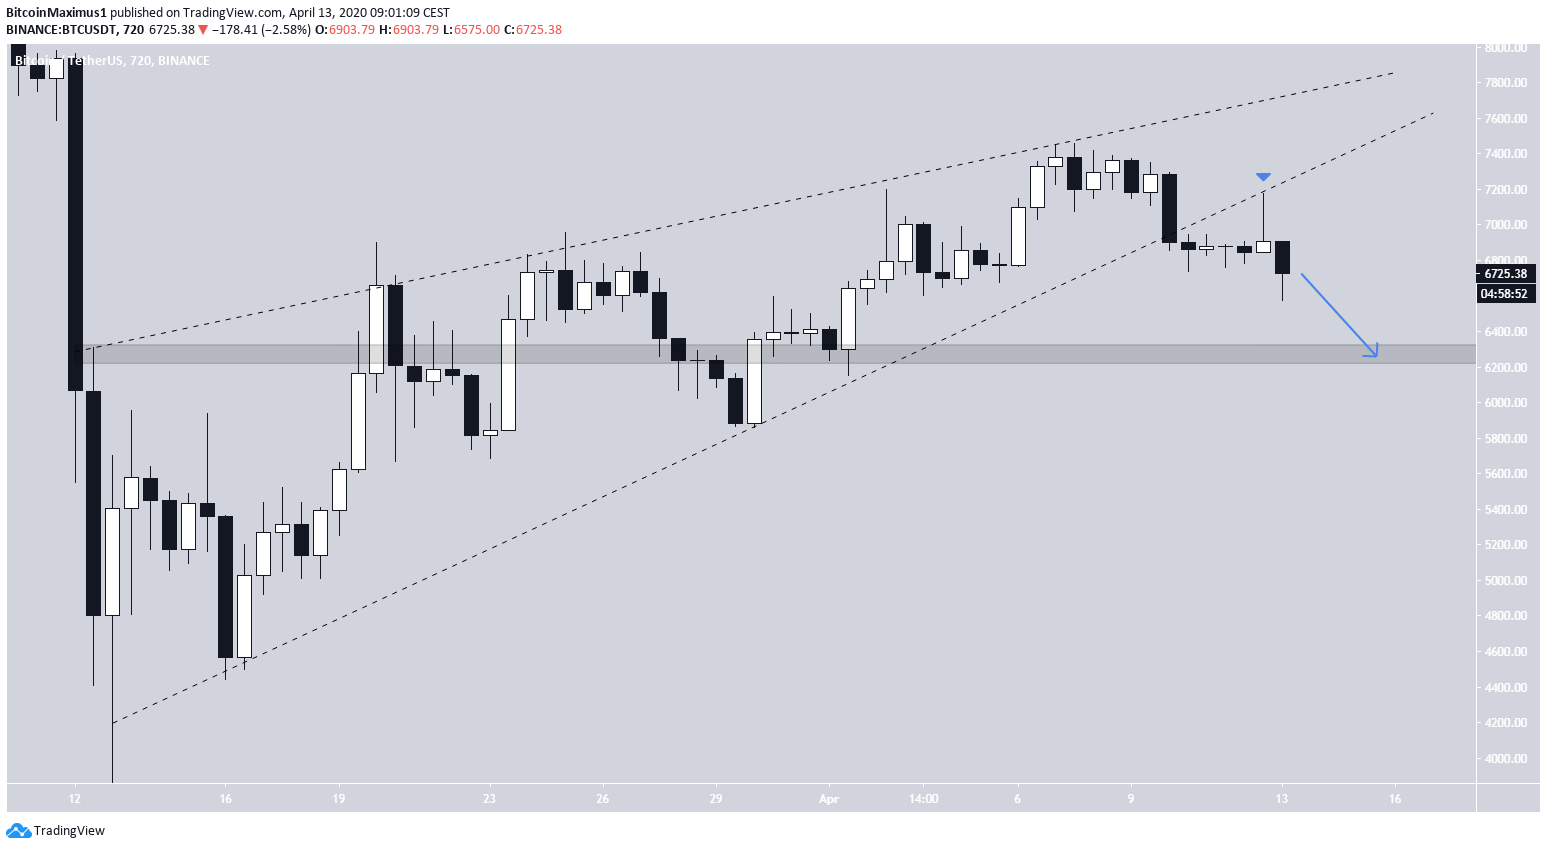
Looking at a lower time-frame, we can see that the BTC price has broken down from an ascending wedge. Yesterday’s movement only served to validate the wedge’s support line as resistance, and the price left an inverted hammer candlestick in place.
If the price begins to go down, the closest support area from here is found at $6,300.
Looking at an even lower time-frame, we can see that the price has fallen back within its previous range of $5,700-$6,900.
In this context, the increases of April 6-9 above $7,000 seems to be just a minor deviation above this range, which the price has now nullified by falling back within. The midpoint (EQ) of the range also coincides with the previously outlined support area.
Considering the price has also broken down below a short-term support level, a decrease towards $6,300 is expected.
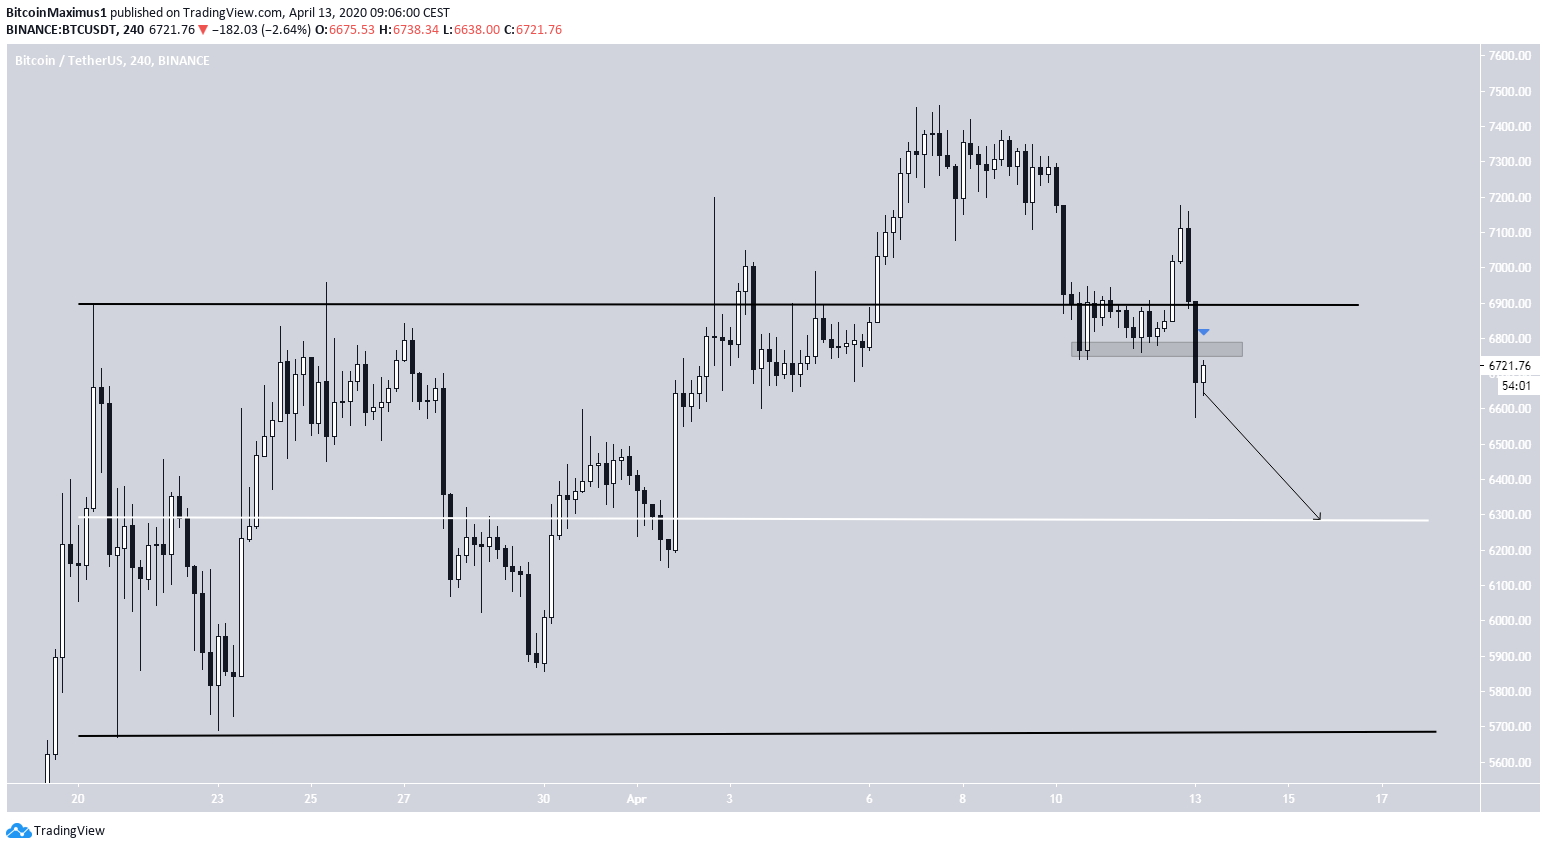
To conclude, the BTC price has broken down from an ascending wedge and validated it as resistance afterwards. We believe the price will continue to decrease at least until it reached $6300.
For those interested in BeInCrypto’s previous Bitcoin analysis, click here.
