


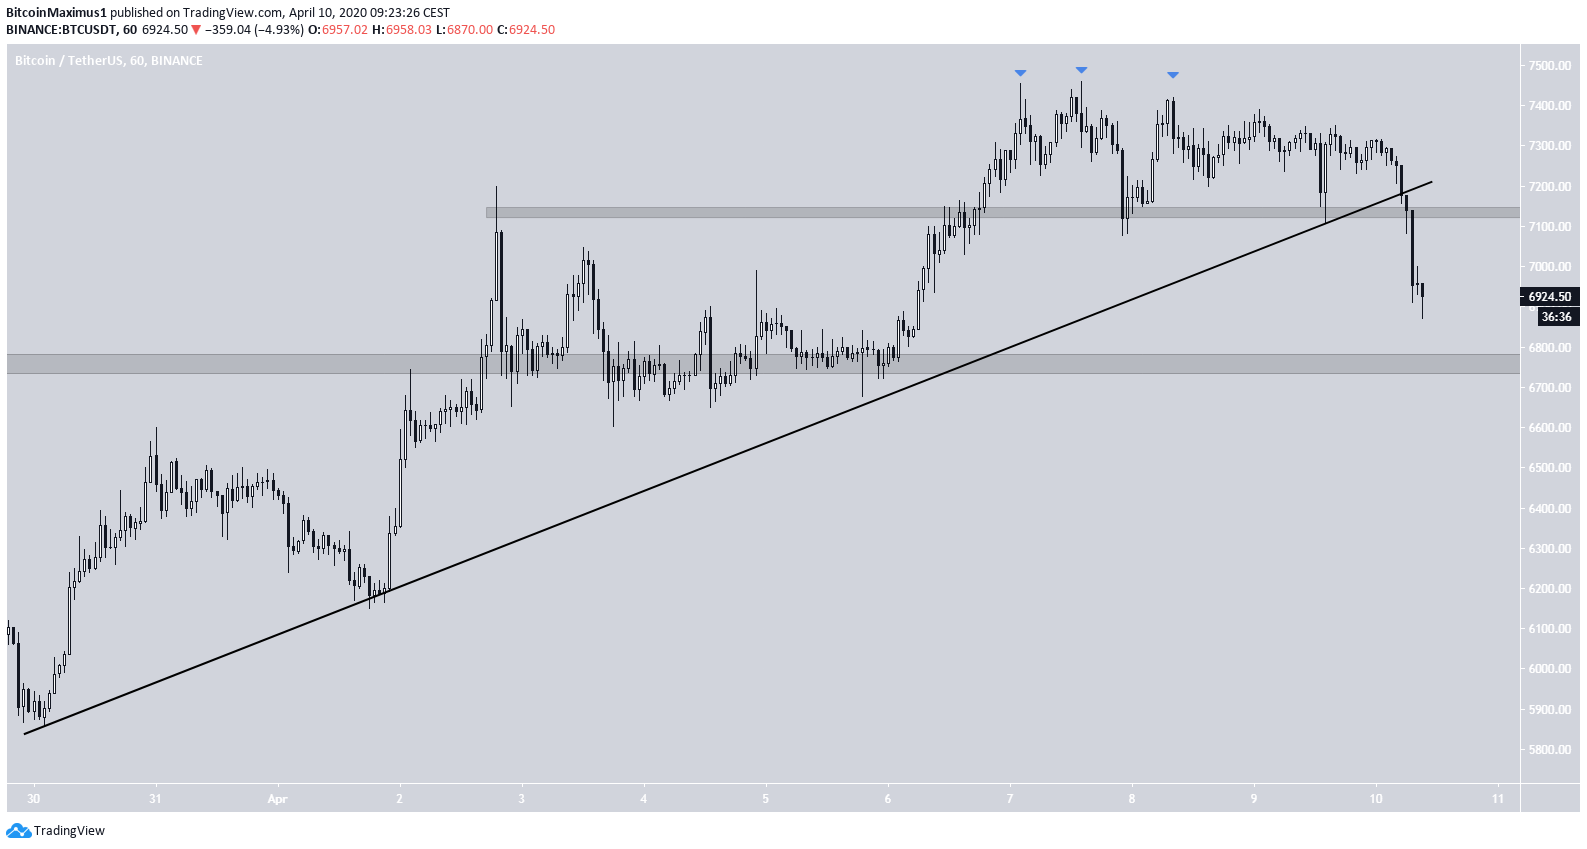
On April 8, the Bitcoin price reached a high of $7,420. The price began to gradually decrease the next day and on April 10 it broke down below the ascending support line it has been following since March 30.
Bitcoin Support Breakdown
The BTC price had been following an ascending support line since March 30.
Last night, the price broke down below this support line and with it the $7,050 support area. The next closest support area is found at $6,750.
The downward move began once the price created a triple-top across April 6-8. The triple-top is known as a bearish reversal pattern, and when it comes after an upward trend, it very often leads to a trend reversal.
Ascending Wedge
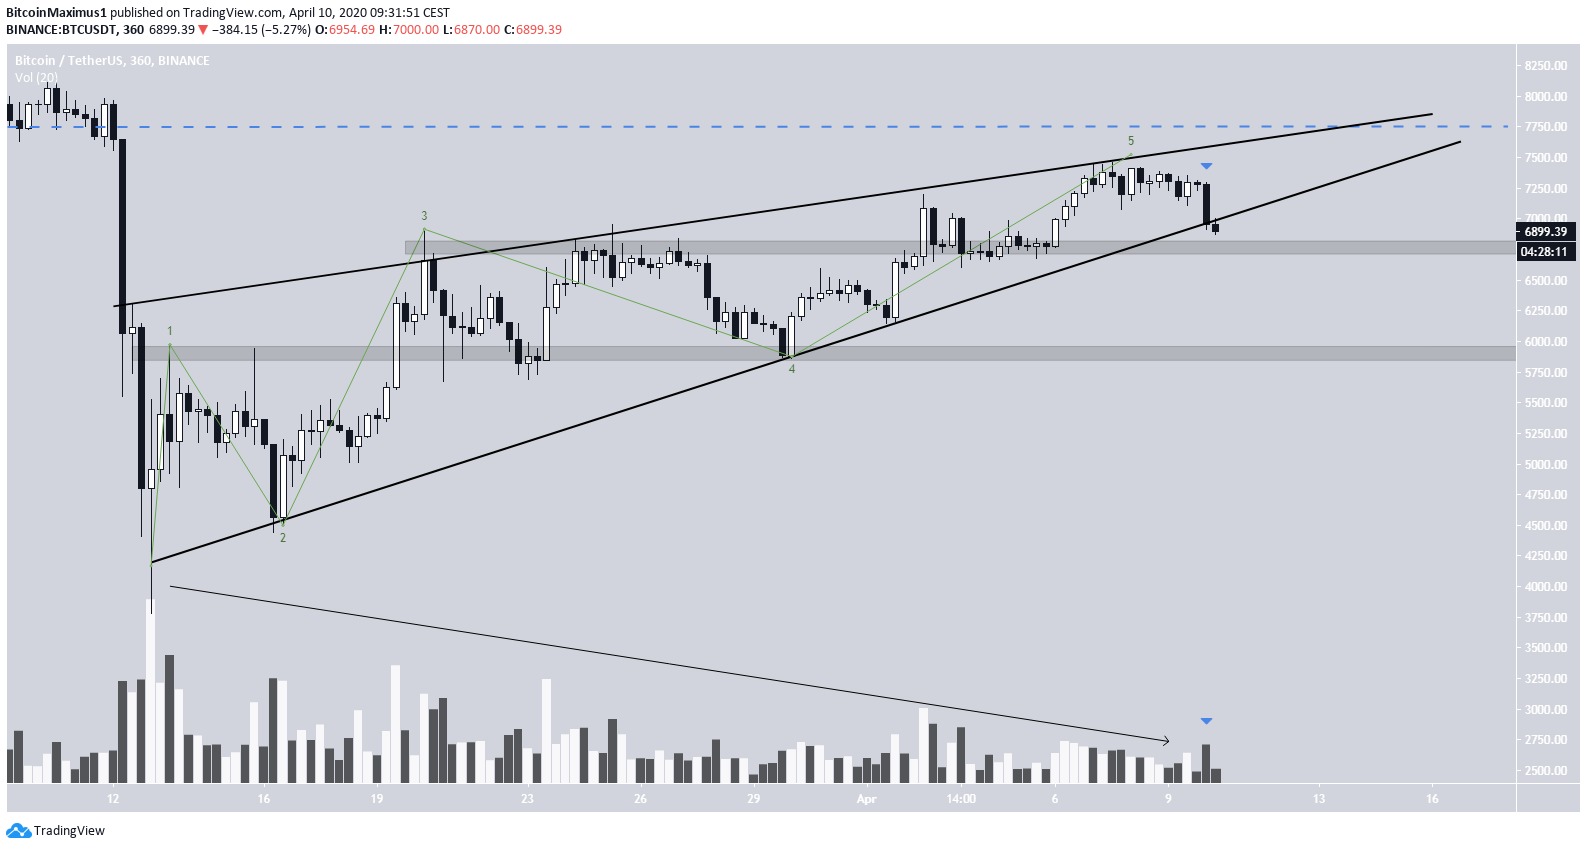
In the longer-term, it is possible that BTC is still trading inside the same ascending wedge it has been in since the bottom on March 13. The price is currently right under the support line (depending on how it’s drawn), so it’s still unclear whether the price has already broken down or not.
If so, BTC has already completed a five-wave Elliott formation. The breakdown is also supported by the gradually decreasing volume throughout the wedge. However, the ‘breakdown’ candlestick did not have extreme volume and the price has yet to reach a close below the support line.
Therefore, it is entirely possible that the price reverses and trades back within the wedge, and makes another attempt at $7,800. However, an eventual breakdown seems inevitable.
Daily Levels
The daily time-frame reveals a similarly bearish outlook. The price was rejected hard by the 50-day moving average (MA). It has fallen below the yearly open, reached the next significant support level, and is in the process of creating a bearish engulfing candlestick.
A decisive daily close below $6,800 could trigger a very rapid price decrease that takes BTC below $6,000.
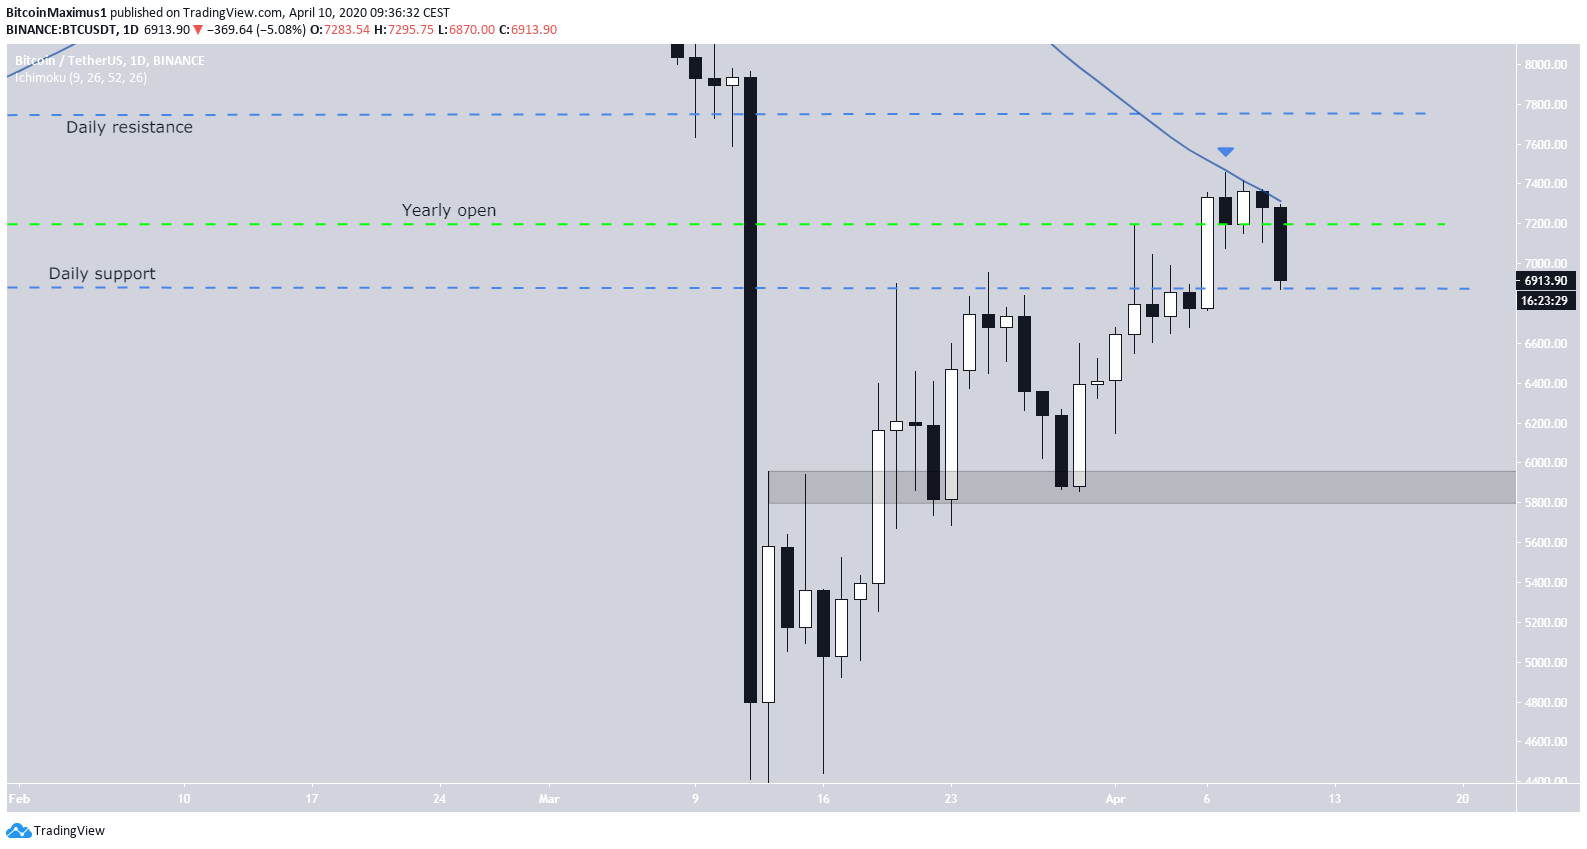
To conclude, the BTC price broke down below a short-term ascending support line and is in the process of breaking down from the longer-term ascending wedge. If it does, a rapid decrease towards $5,800 could follow.
For those interested in BeInCrypto’s previous Bitcoin analysis, click here.



