


Bitcoin, Ethereum, and XRP prices seemed to be making lower highs after seeing a bit of positive momentum last week.
Bitcoin price action has been in a larger downtrend while Ethereum and XRP prices struggle to gain some bullish momentum. While short-term bullish momentum pushed BTC price above $17,000, that price level was soon lost. Nonetheless, the BTC price rise above $17,000 ignited hopes of a recovery as analysts analyzed a bottom.
On a daily chart, BTC price was down by 0.98%, while ETH saw a 2.15% pullback. XRP, on the other hand, showed a 0.67% price rise. Despite the upticks and pullbacks, on-chain data suggested some peculiar trends for these three coins.
Most Active Bitcoin Accumulation Phase Begins
A look at the Bitcoin Realized Loss as a percentage of Market Cap helps interpret the coin’s macro landscape. The realized loss as percentage of the market cap shows two historically great bear market buying opportunities in Dec. 2018 and Feb. 2020.
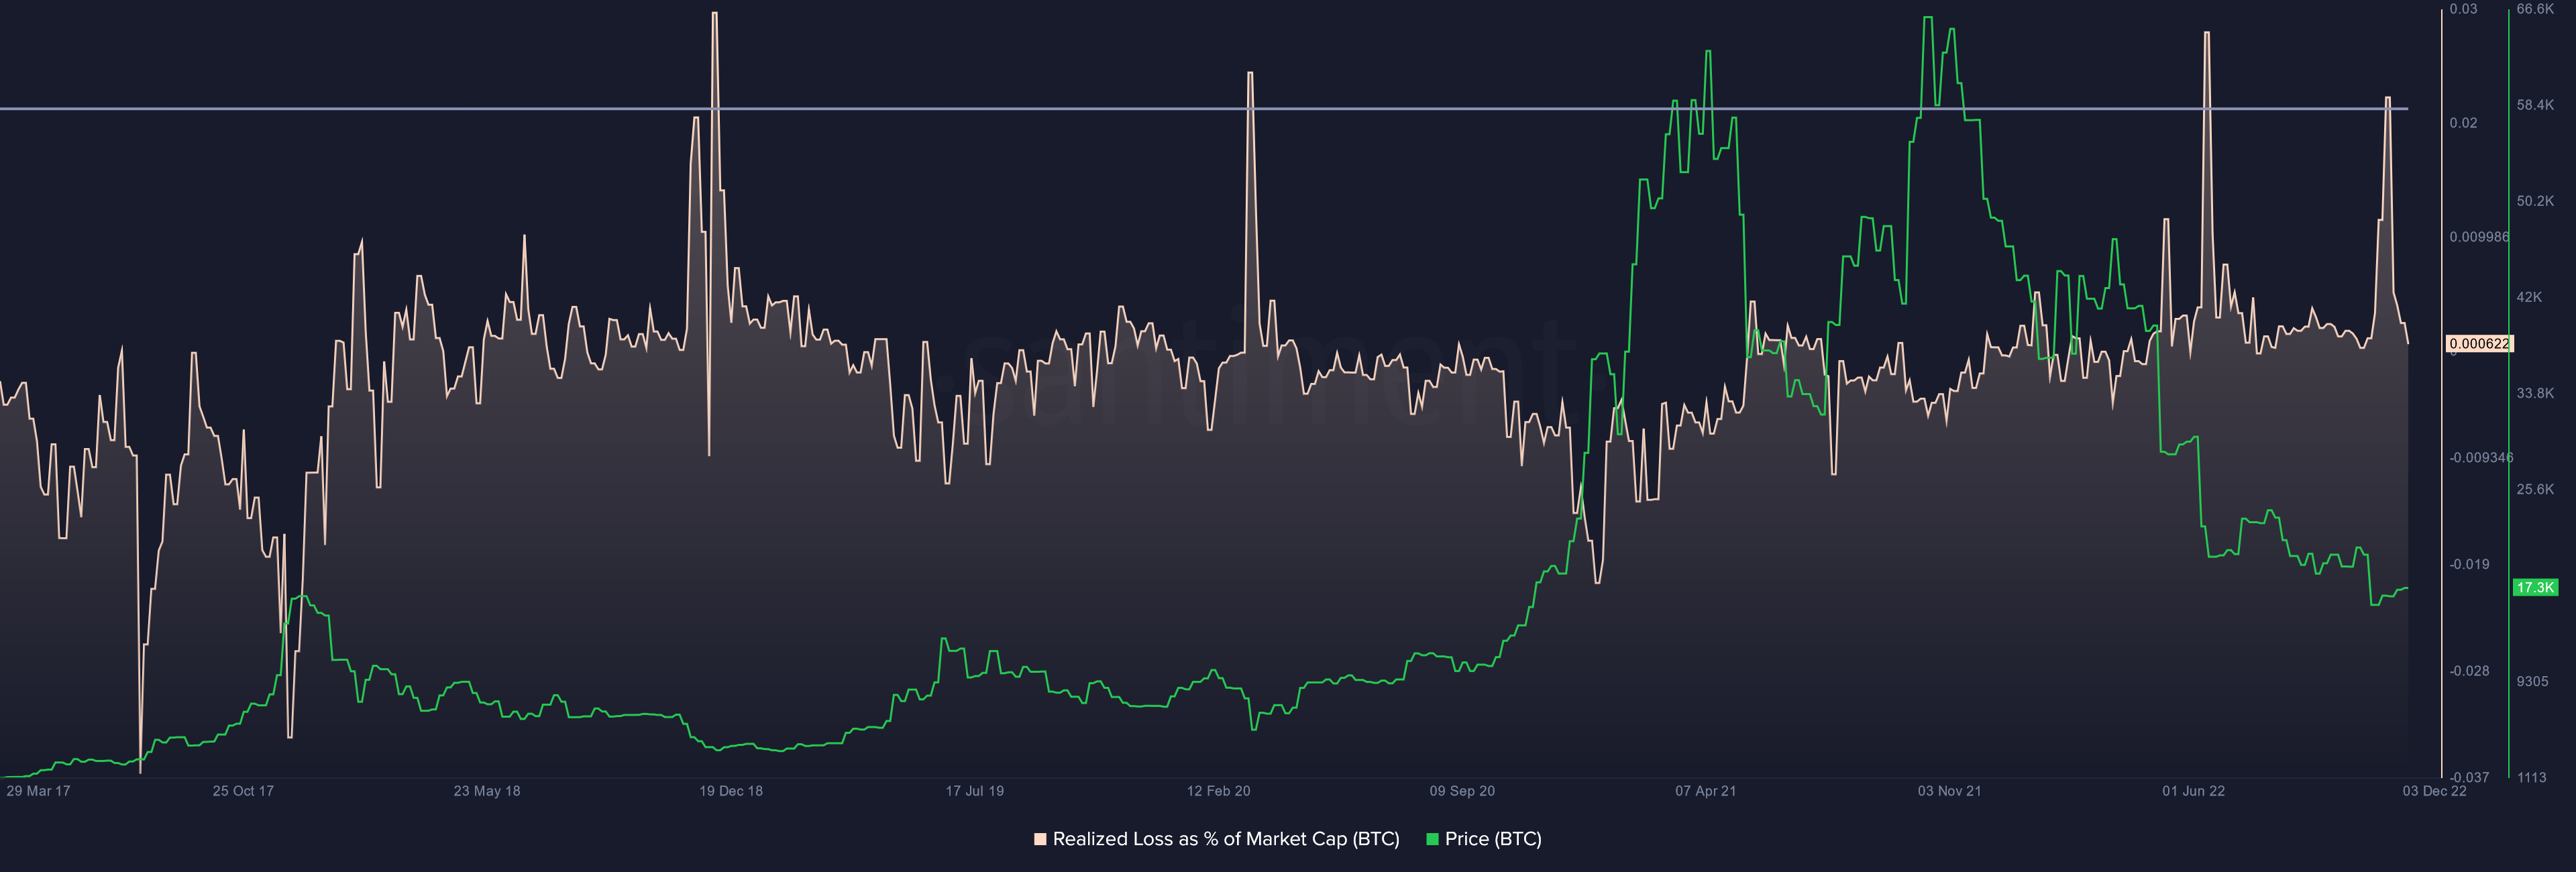
However, the indicator peaked recently, which indicated good buying opportunities in the market. Despite the indicator peaking twice this year, price action has continued to slump. It would be interesting to watch whether the realized loss as a percentage of market cap presents more historic buy opportunities.
In addition to that, the Whale Exchange Ratio data sharply dropped in the last quarter of this year. A look at the data from 2018 to now corresponds to long-term upside or downside.
In 2018, when the BTC price began to fall, and a bear market began, the 7D moving average and 90D momentum steadily increased, peaked, and then began to cool as the price bottom appeared. The same repeats for a short while and tends to cool down completely when BTC nears the last cycle’s peak.

After reaching its peak in 2021, the indicator accelerated the ascending trend and only stopped at the end of Q3 this year. It cooled down even during the FTX swan event phase. The major drop in the Whale Exchange Ratio shows that large entities also deny risks and shrink trading volumes.
While the level of volatility will decline as the indicator cools down, it can’t be said for sure whether the BTC price has bottomed. However, the indicator reaching the lower levels can mark the most active accumulation phase for a new beginning.
Ethereum Whales and Shark Accumulate
At the time of writing, the Ethereum price lost a mere 0.20% on the daily window as ETH traded at $1,232.30. ETH price has struggled to establish above the $1,300 resistance mark.
Daily on-chain exchange flow suggested that net flows were negative for ETH, with around $1.6 billion outflows on Dec. 8. With outflows dominating the ETH market, it was evident that Ethereum holders had a positive price outlook and confidence in ETH price.
The ETH whales and sharks kept adding more ETH to their bags despite the price moving in a range bound trajectory. The key shark and whale addresses holding 100 to one million ETH own two-thirds of the coin’s overall supply.
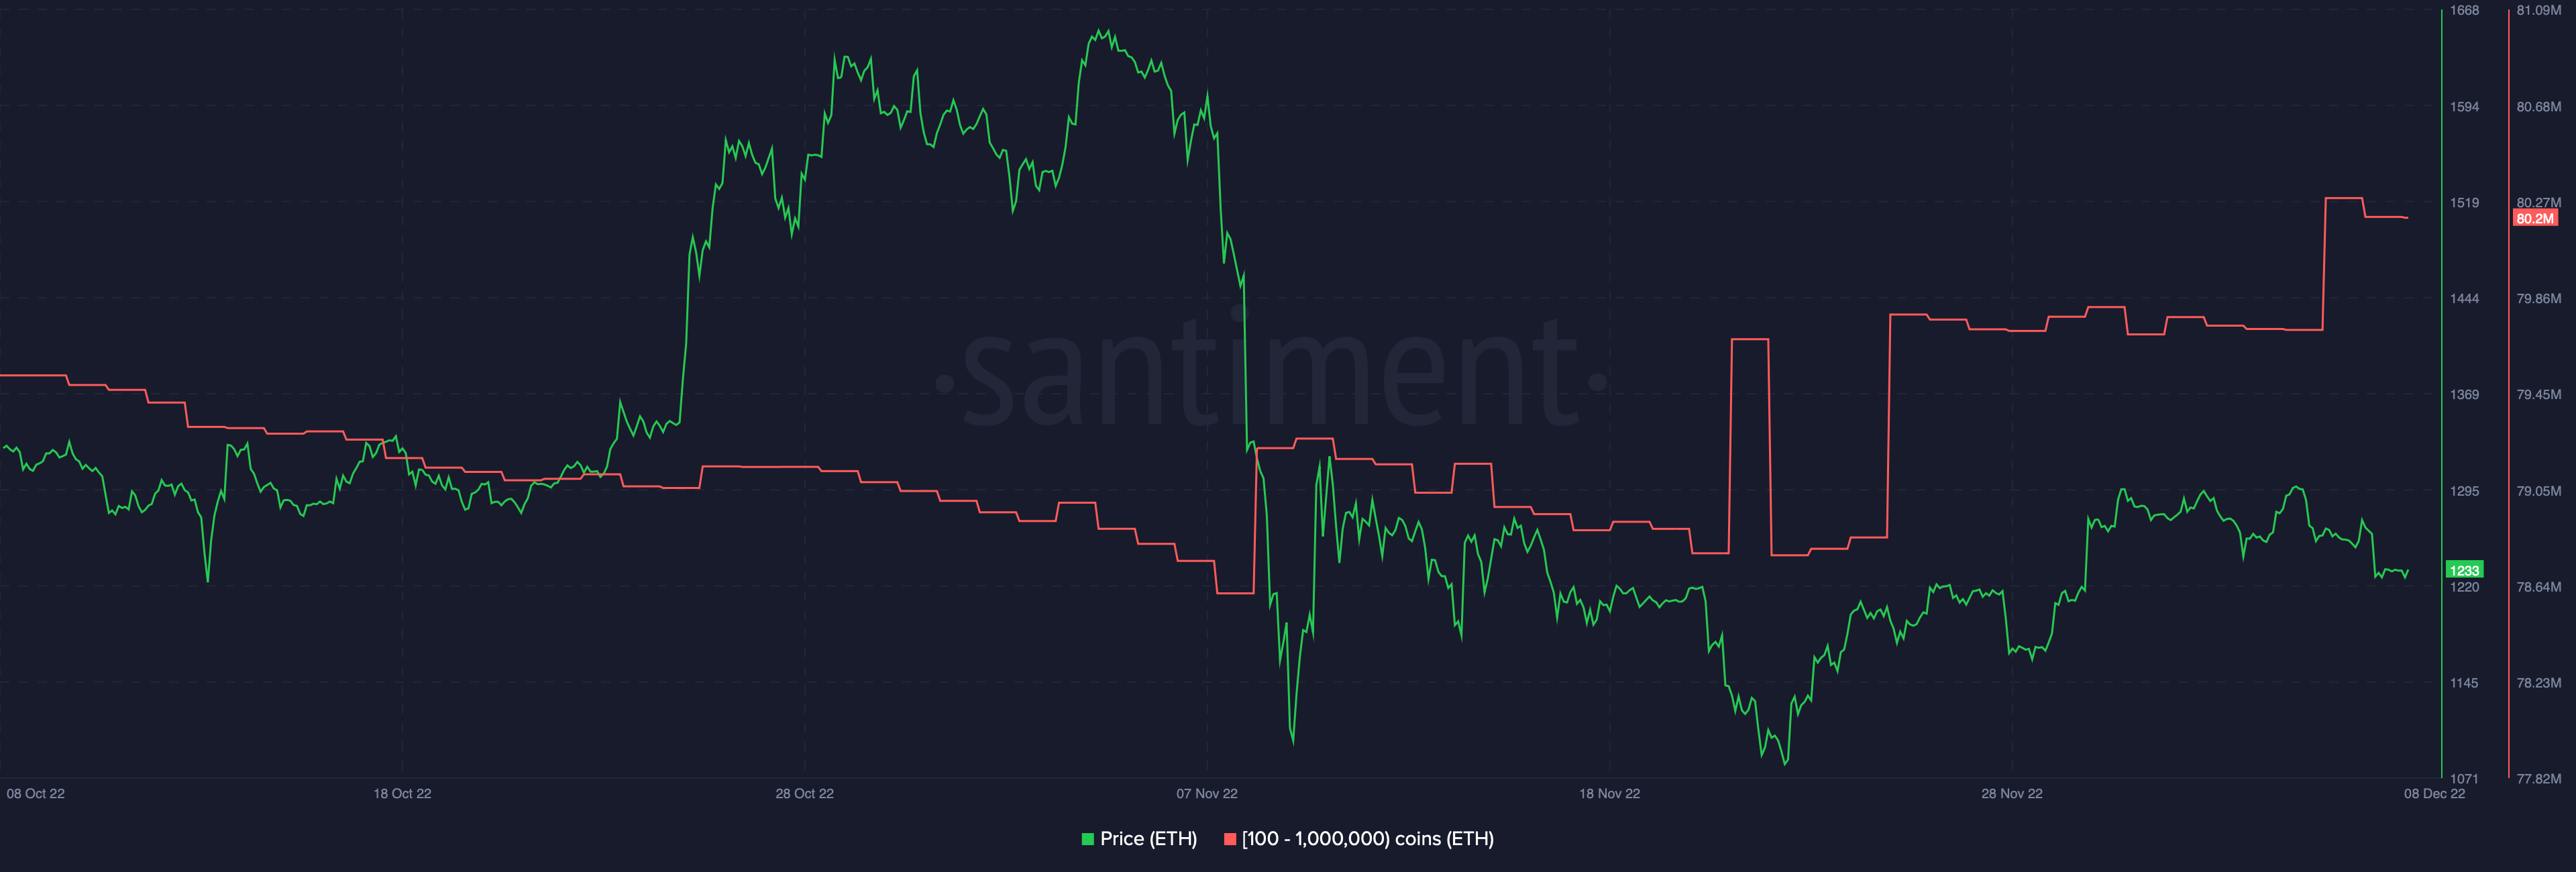
This cohort has collectively added 2.1% more coins to their bags in the past month. Whale and shark address increasing holding are generally a long-term bullish trend.
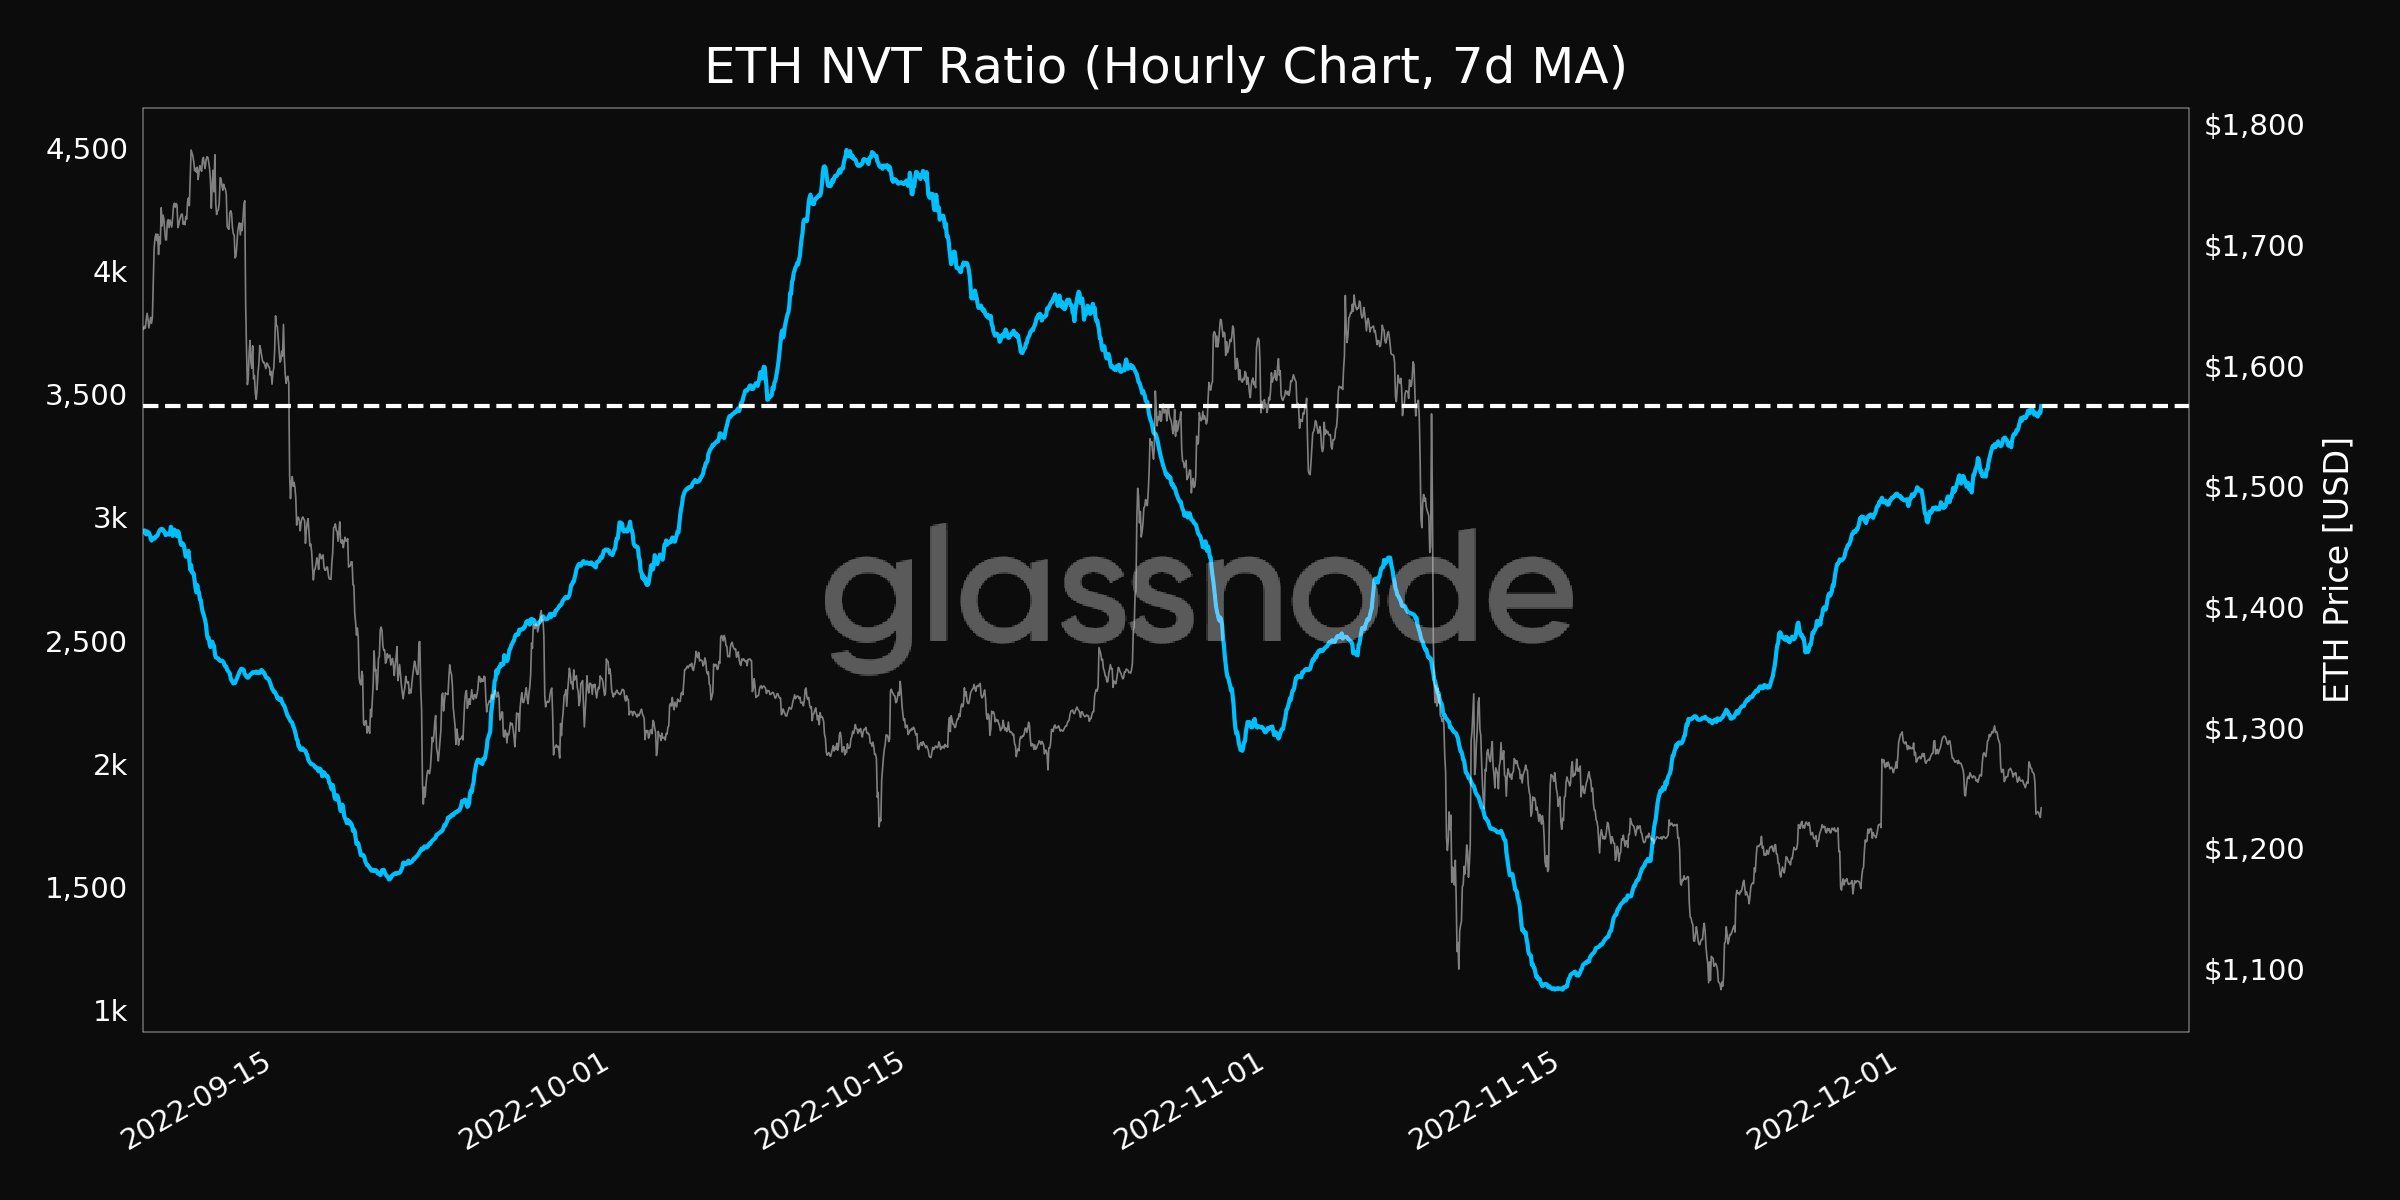
ETH Network Volume Transaction (NVT) was at monthly highs meaning investors were pricing ETH at a premium as market cap growth outpaced utilization of on-chain transactions.
In the short-term ETH bulls could target the $1,300 and then the $1,350 resistance/support level. However, a Bitcoin price pullback in the near term could further extend losses for ETH and the rest of the market.
5.86 Trillion XRP Moved
At press time, XRP price gained a bit of bullish momentum. XRP traded at $0.3881, presenting a 2.83% rise on the daily chart. From a price perspective, XRP bulls needed to eye the $0.40 mark for a significant recovery.
However, some major on-chain moves turned investor eyes to XRP. Data from WhaleAlerts suggested that over 110 million XRP were moved in the last 12 hours. The most recent transfer was of 40,000,000 XRP worth $15,379,362 from Bitso to an unknown wallet.
One day ago, over 850 million XRP were transferred from exchanges to unknown wallets.
The Age Consumed indicator for XRP suggested that around 5.86 trillion XRP have been moved in the last day. With Age consumed noting one of its biggest rises, it will be crucial to see how the XRP price will react to the old coins moving.
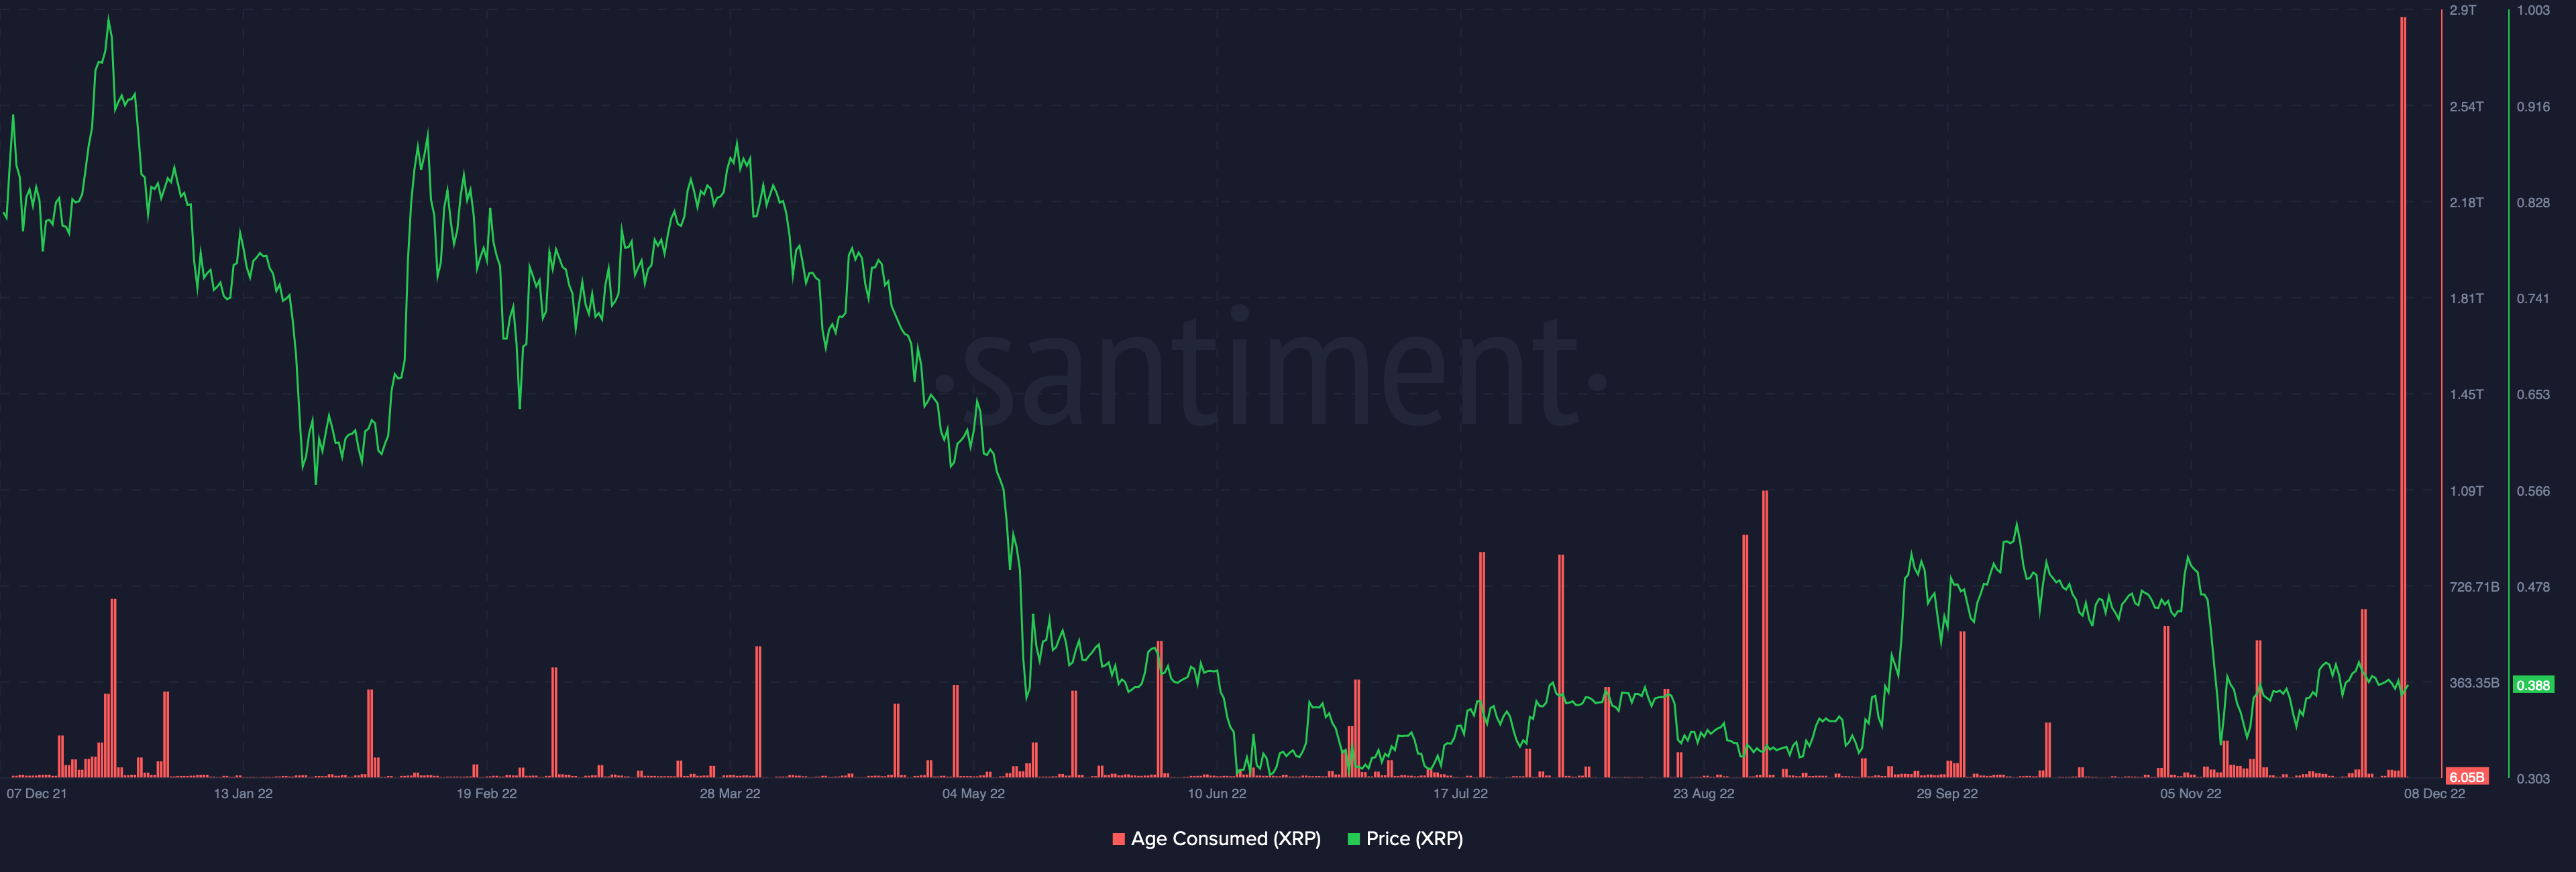
Old XRP moving could point toward possible redistribution or an attempt by whales to push short-term prices.
While whales moving the XRP price action can aid the coin’s positive momentum, with the ongoing regulatory battle nothing can be said for sure.
Disclaimer: BeInCrypto strives to provide accurate and up-to-date information, but it will not be responsible for any missing facts or inaccurate information. You comply and understand that you should use any of this information at your own risk. Cryptocurrencies are highly volatile financial assets, so research and make your own financial decisions.


