
The Bitcoin Dominance Rate (BTCD) has bounced at an ascending support line, while the daily RSI has generated bullish divergence.
Between May and Dec 2021, BTCD created a triple bottom pattern at the 40% long-term support area. Since the triple bottom is considered a bullish pattern, it is expected to lead to breakouts the vast majority of the time.
The weekly RSI reading support this possibility, since it generated bullish divergence in the period since May 2021. Moreover, the bullish divergence trend line (green) is still intact. Since the RSI is currently right at this support line and the 50 line, it is at a suitable place for a bounce.
If the upward movement continues, the next closest resistance area would be at 52.30%, created by the 0.382 Fib retracement resistance level.
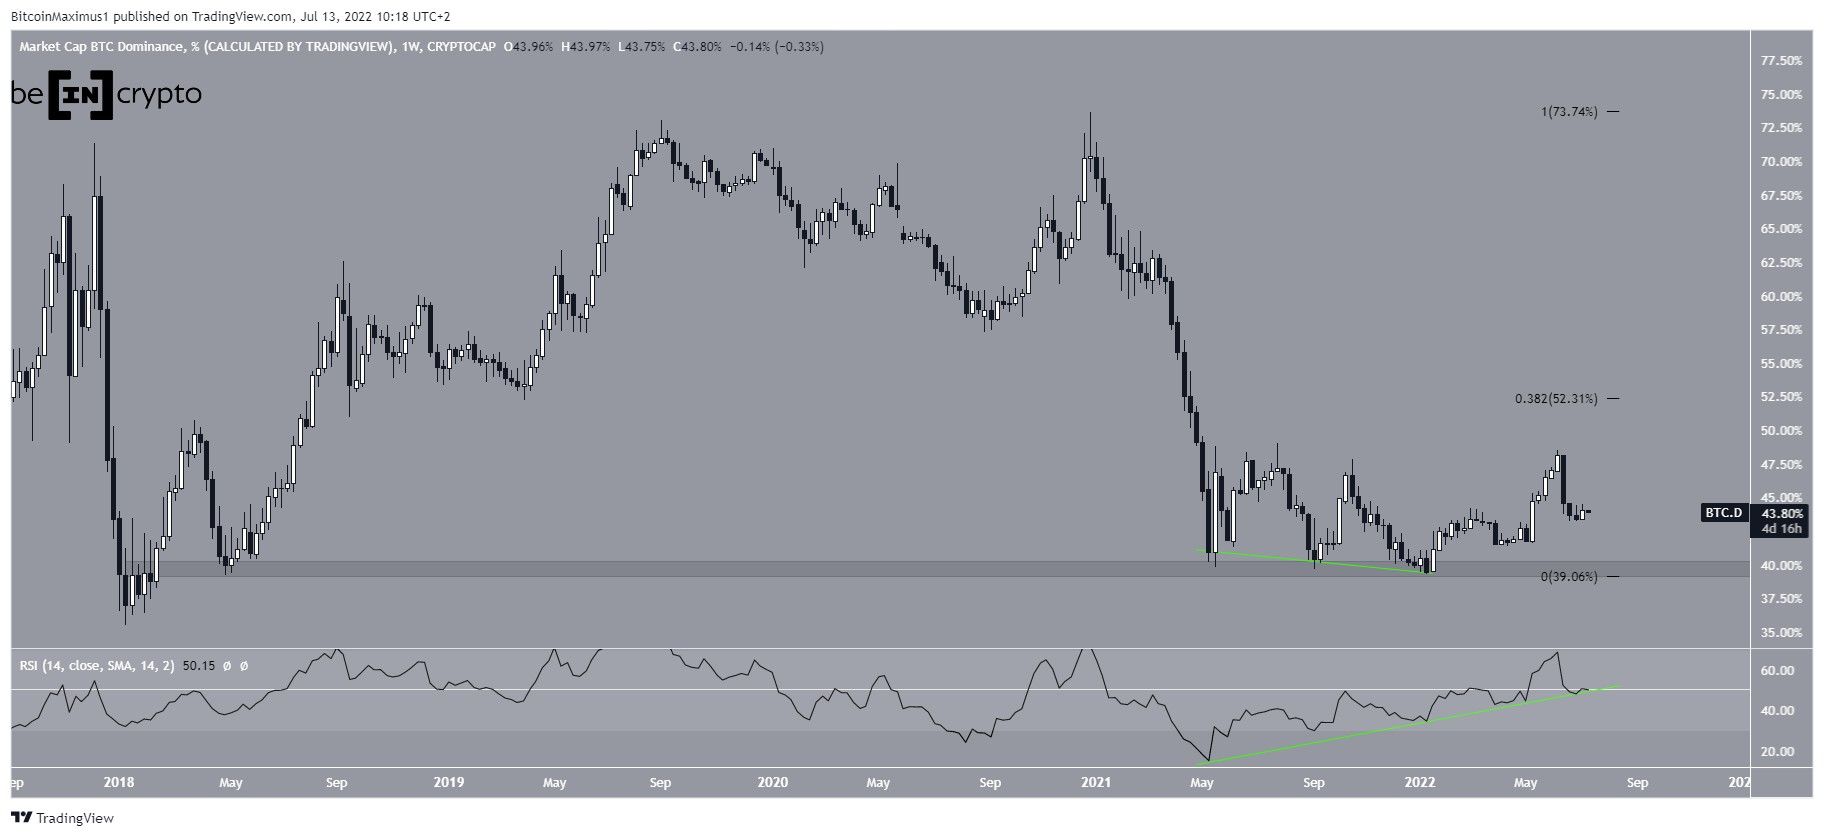
Potential BTCD bounce
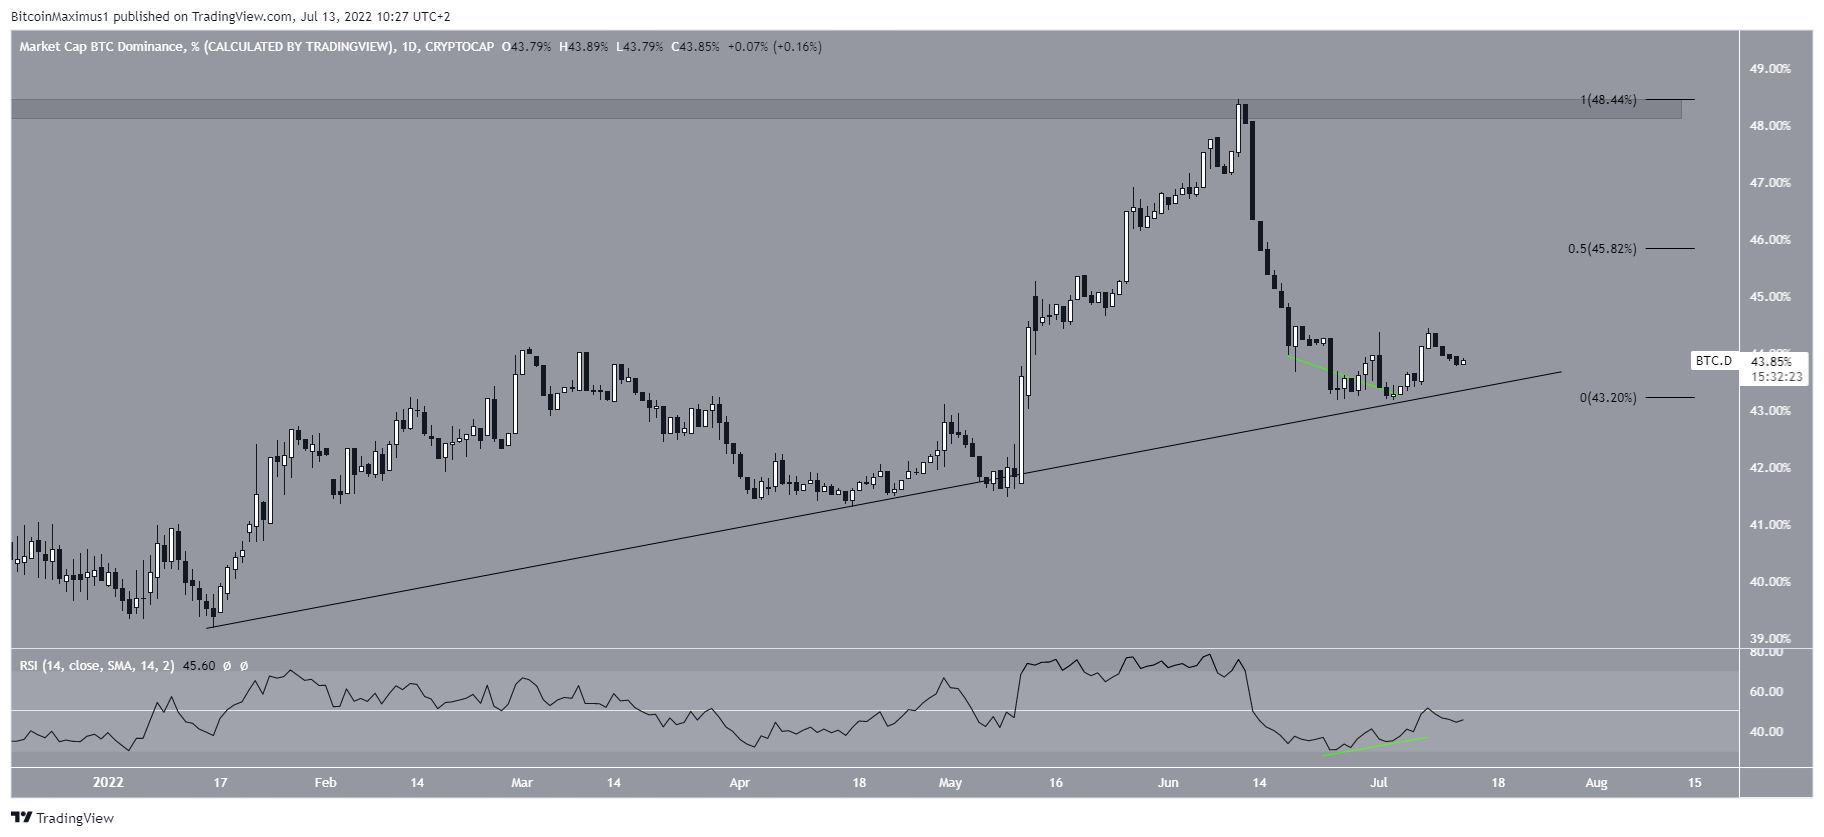
The daily chart shows that BTCD has been increasing alongside an ascending parallel channel since Jan 17. More recently, it bounced at the support line in the beginning of July.
Similar to the weekly time frame, this bounce was preceded by bullish divergence in the daily RSI (green line). However, unlike the weekly time frame, the RSI has yet to move above 50.
If the upward movement continues, the first minor resistance level would be at 45.82%, while the main resistance area would be at 48%.
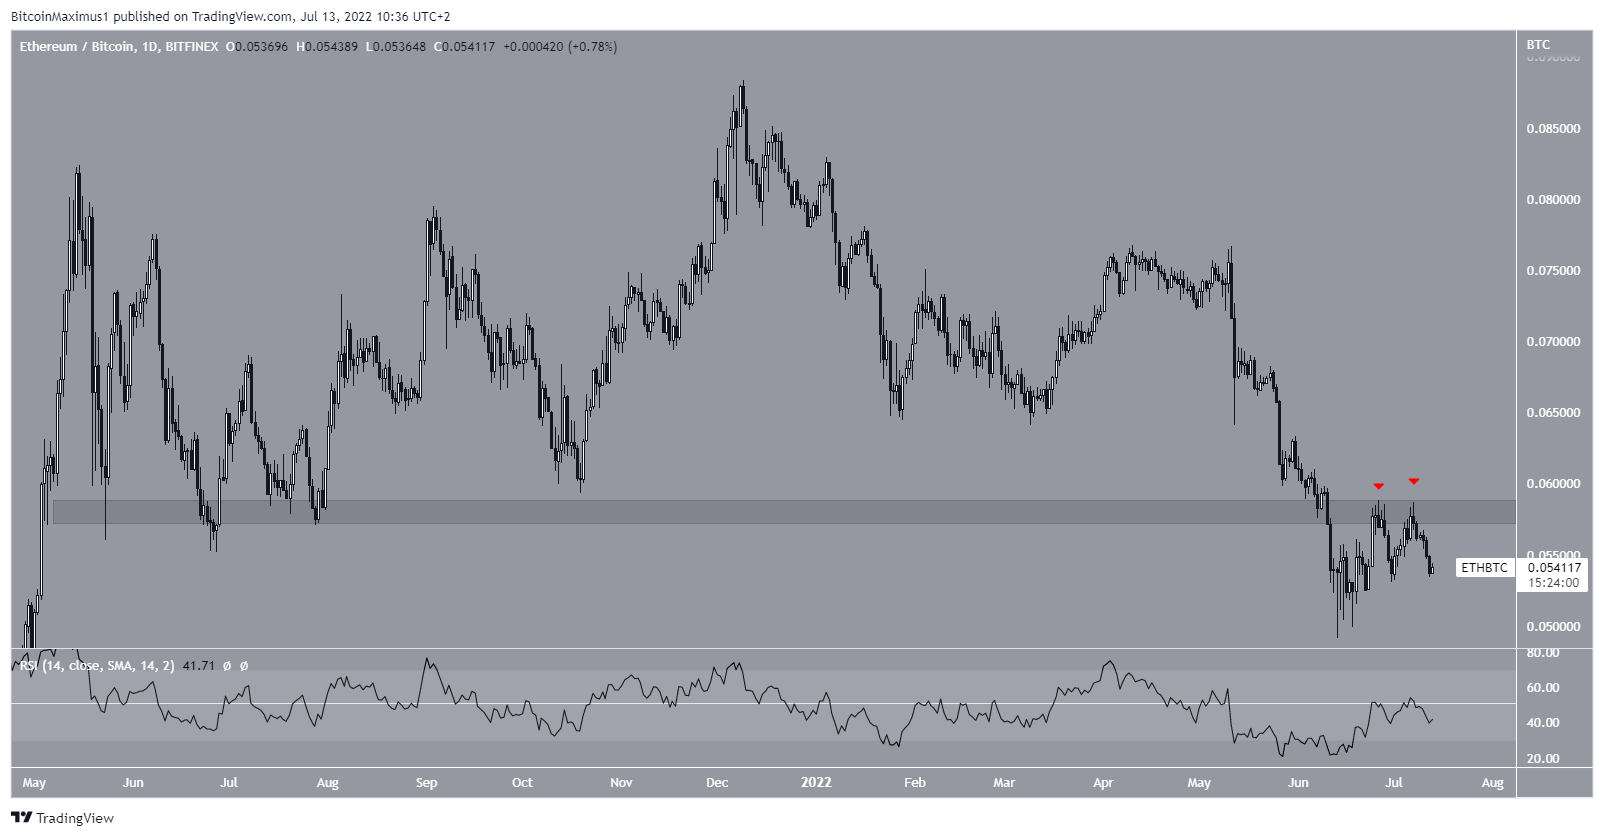
ETH/BTC
Since Ethereum (ETH) is the largest altcoin by market cap, its movement is a big factor in changes in BTCD.
The daily chart shows that ETH has been falling after two rejections from the ₿0.058 resistance area. This is an important horizontal level, since it previously acted as support throughout May to July 2021.
Additionally, the daily RSI is below 50, a sign of a bearish trend.
So, the ETH/BTC readings align with those from BTCD, suggesting that a decrease in the former and an increase in the latter are expected.
For Be[in]Crypto’s latest bitcoin (BTC) analysis, click here.
