


Bitcoin (BTC) is close to breaking down from a corrective pattern that had been in place since June 18. If this occurs, it would be expected to lead to new lows.
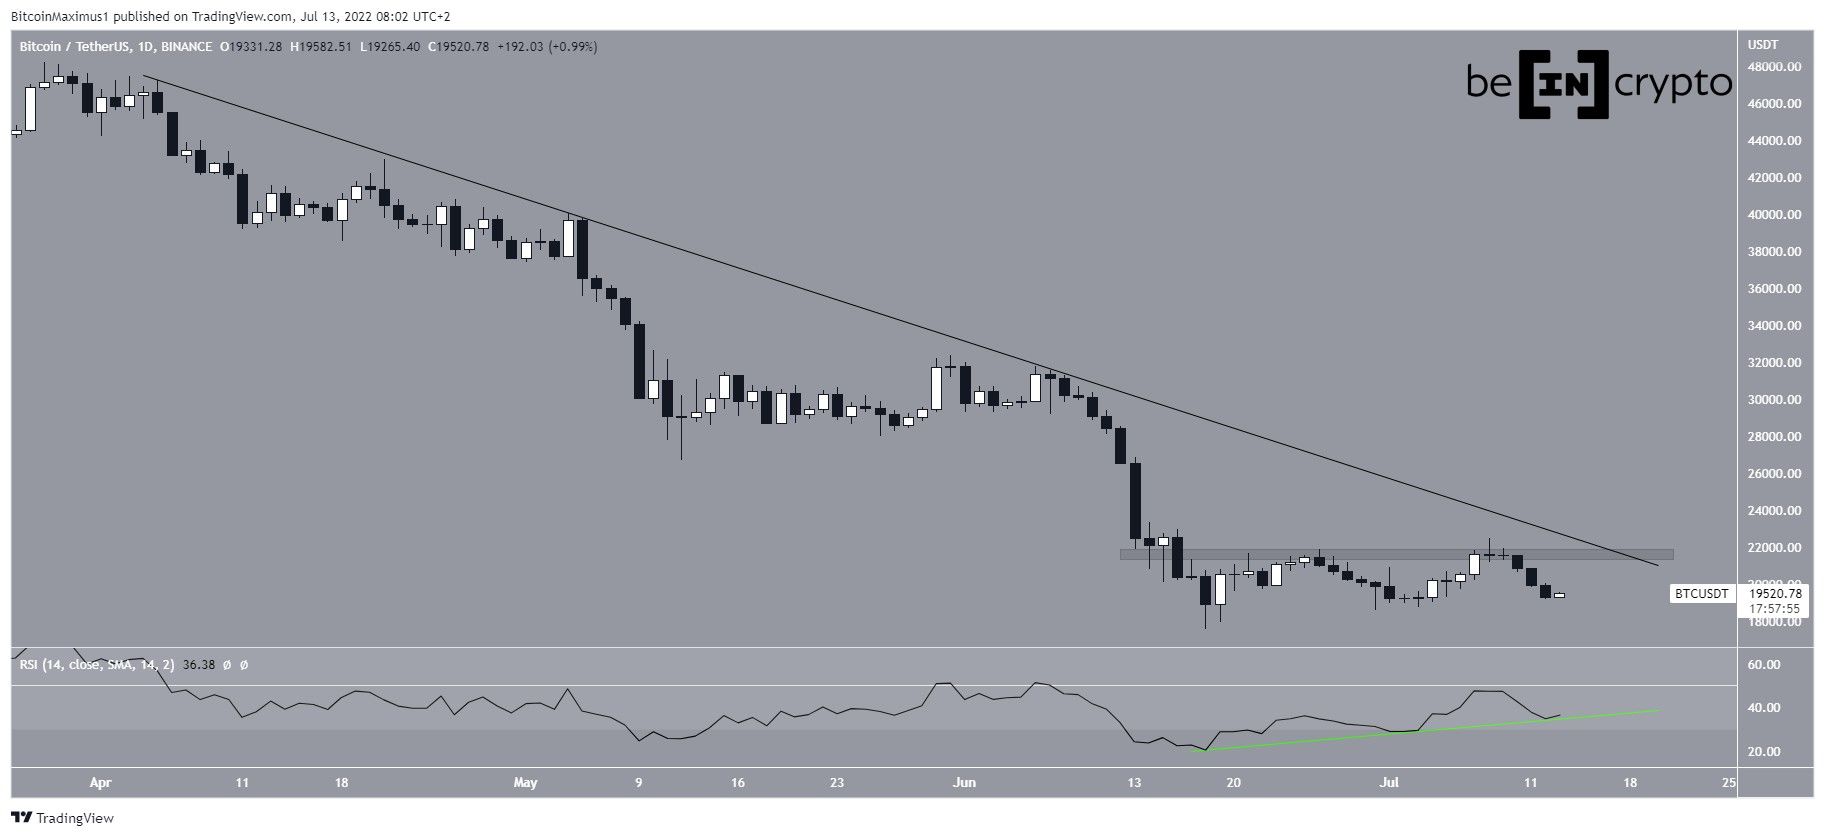
Bitcoin has been falling underneath a descending resistance line since the end of March. The line caused a rejection on June 7, which led to a local bottom of $17,622 on June 18.
The price increased slightly since and created two higher lows. However, it failed to even reach the descending resistance line and was instead rejected by the $21,700 horizontal resistance area.
The daily RSI has yet to move above 50 and was rejected by the line the same time as the price was rejected by the $21,700 horizontal level. On the other hand, the RSI is still holding on above its ascending trendline (green). A breakdown from the line would likely confirm that the price is heading lower.
Short-term breakdown
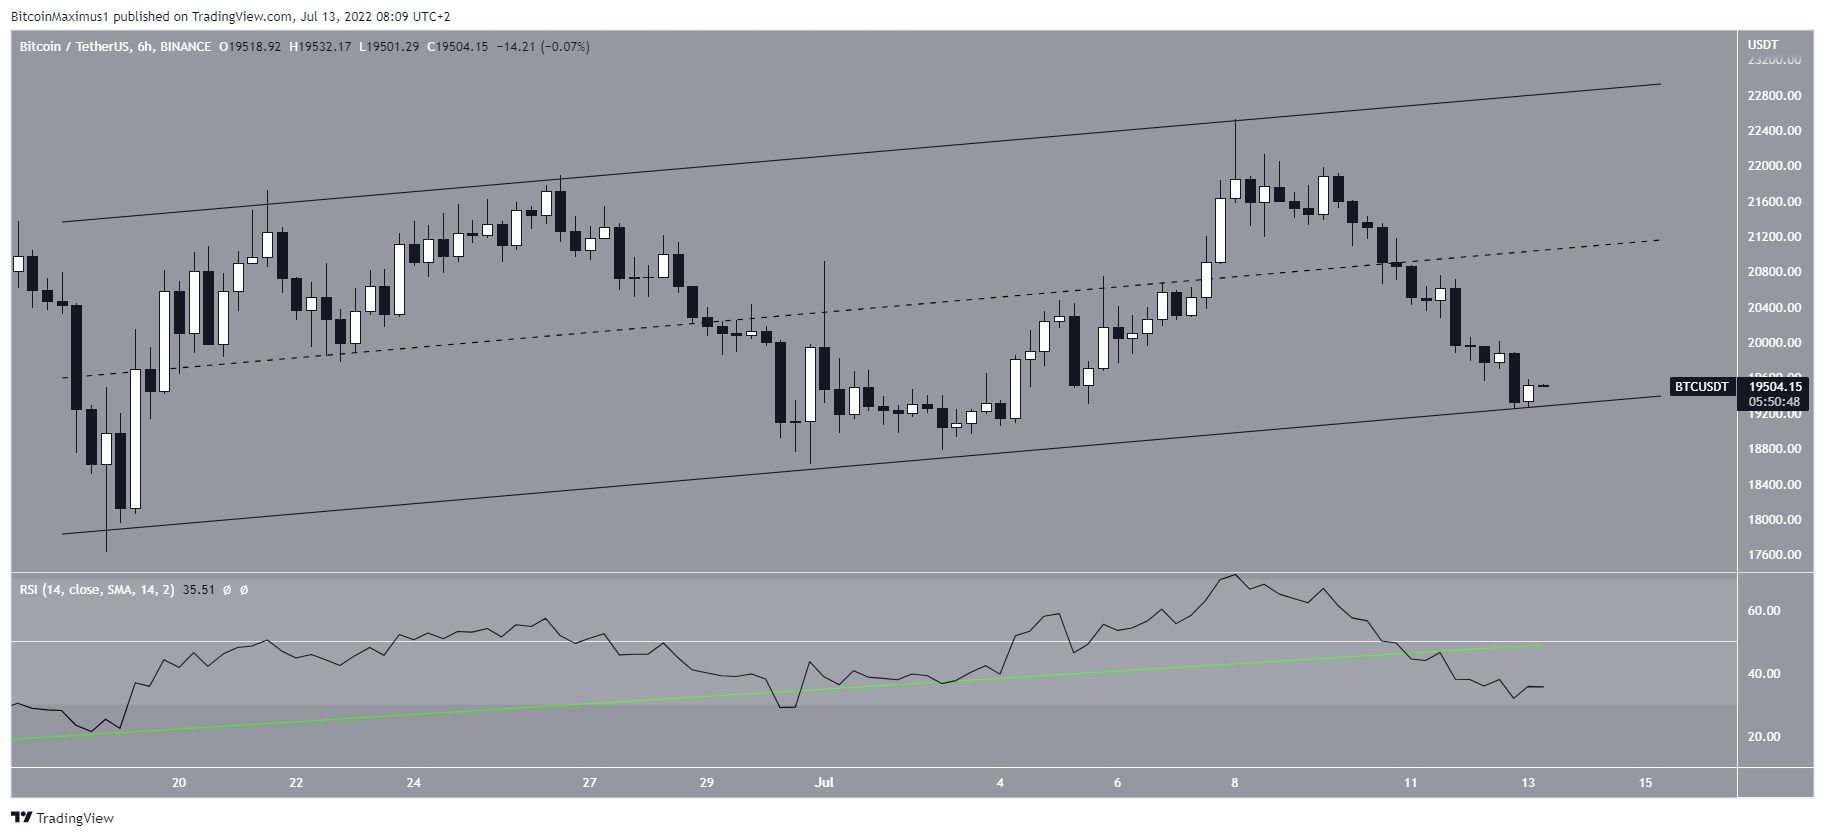
A closer look at the six-hour chart paints a mostly bearish outlook.
Firstly, the price has been trading inside an ascending parallel channel since June 18. Such channels usually contain corrective structures, meaning that an eventual breakdown would be expected.
Secondly, the six-hour RSI has broken down from its ascending trendline and is below 50.
BTC wave count
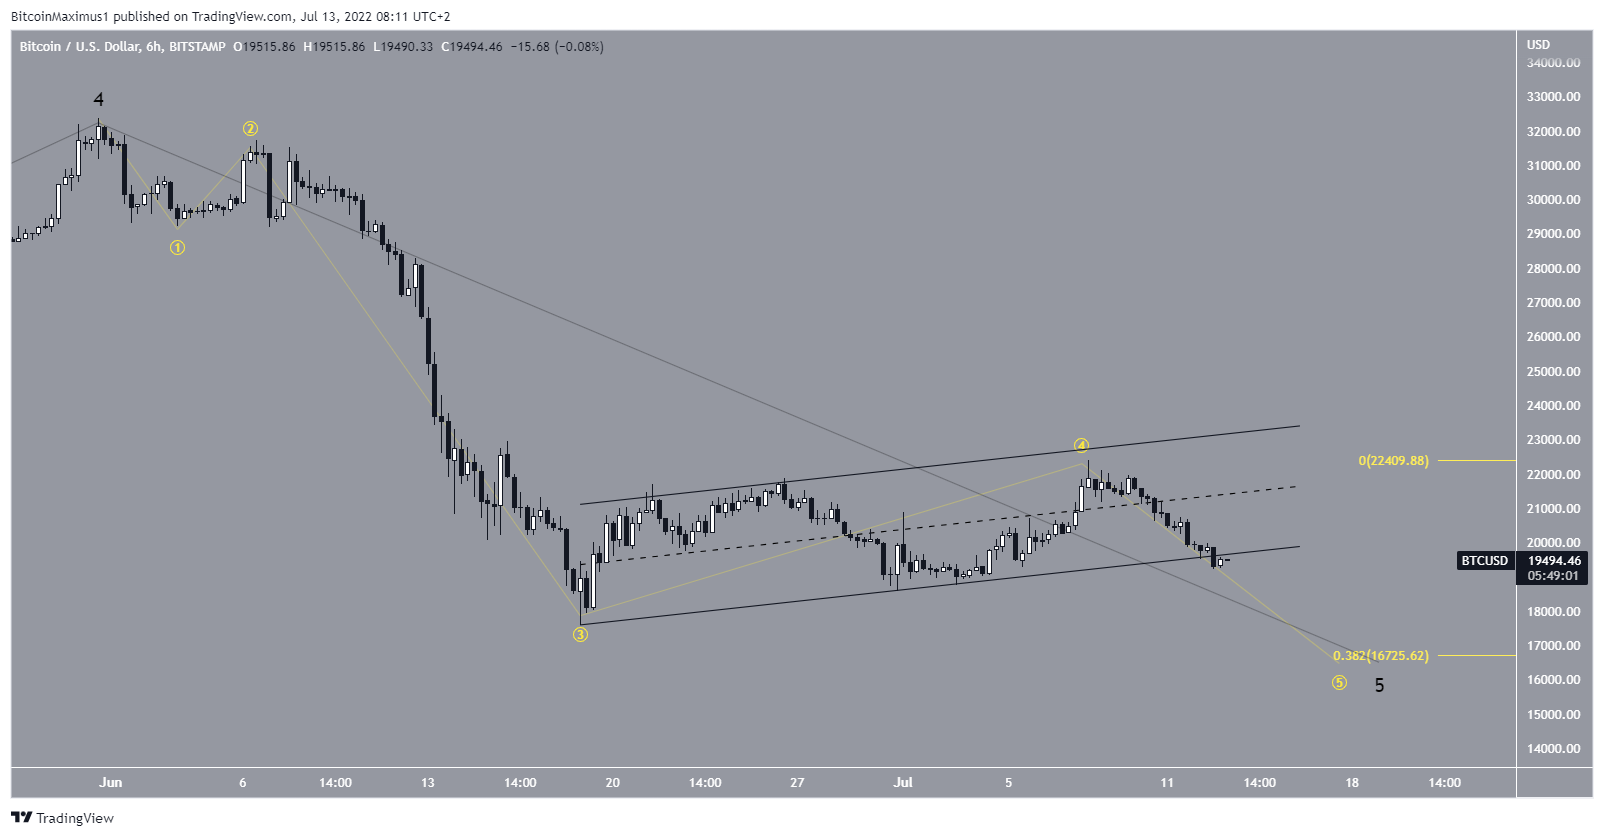
The wave count suggests that BTC has been trading in a five-wave downward move (yellow) since the end of March. The presence of this structure makes it likely that BTC is currently in wave four.
If it breaks down, a likely target for the bottom would be found at $16,725. This target is found using the 0.382 length of waves 1-3.
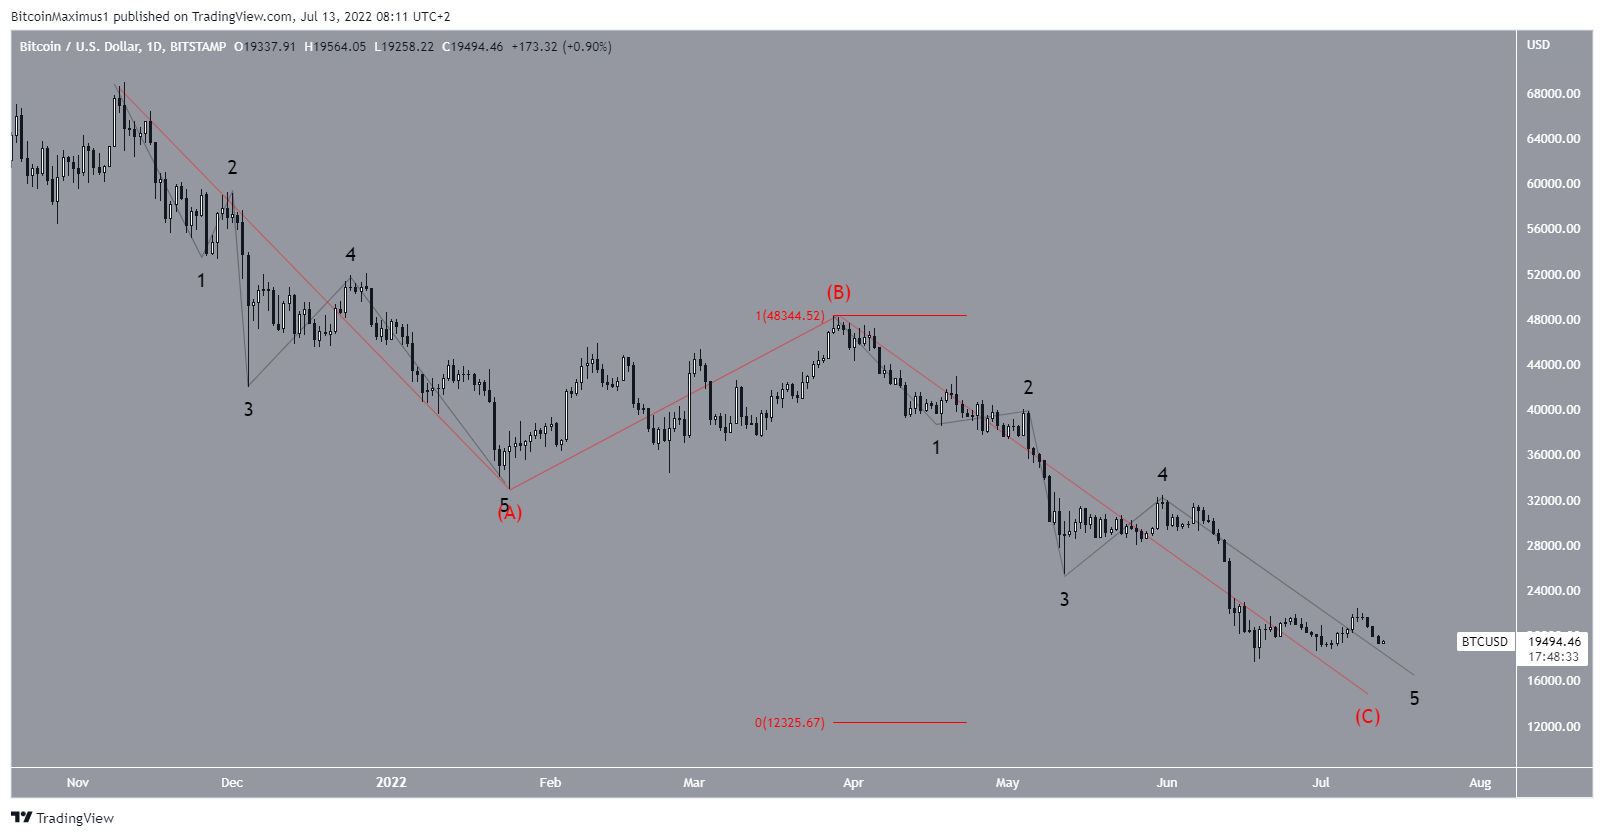
The long-term wave count suggests that BTC is in the C wave of an A-B-C corrective structure (red) that has been developing since the all-time high of $69,000 was reached in November 2021.
Giving waves A and C a 1:1 ratio would lead to a long-term low of $12,100, given that the $16,726 level fails.
For Be[in]Crypto’s previous bitcoin (BTC) analysis, click here.


