


The Bitcoin Dominance Rate (BTCD) has been decreasing since December 2020 and is currently approaching a long-term support area at 57.5%.
The Bitcoin Dominance Rate is expected to continue falling toward this area and could potentially dip even lower.
Bitcoin Dominance Rejected
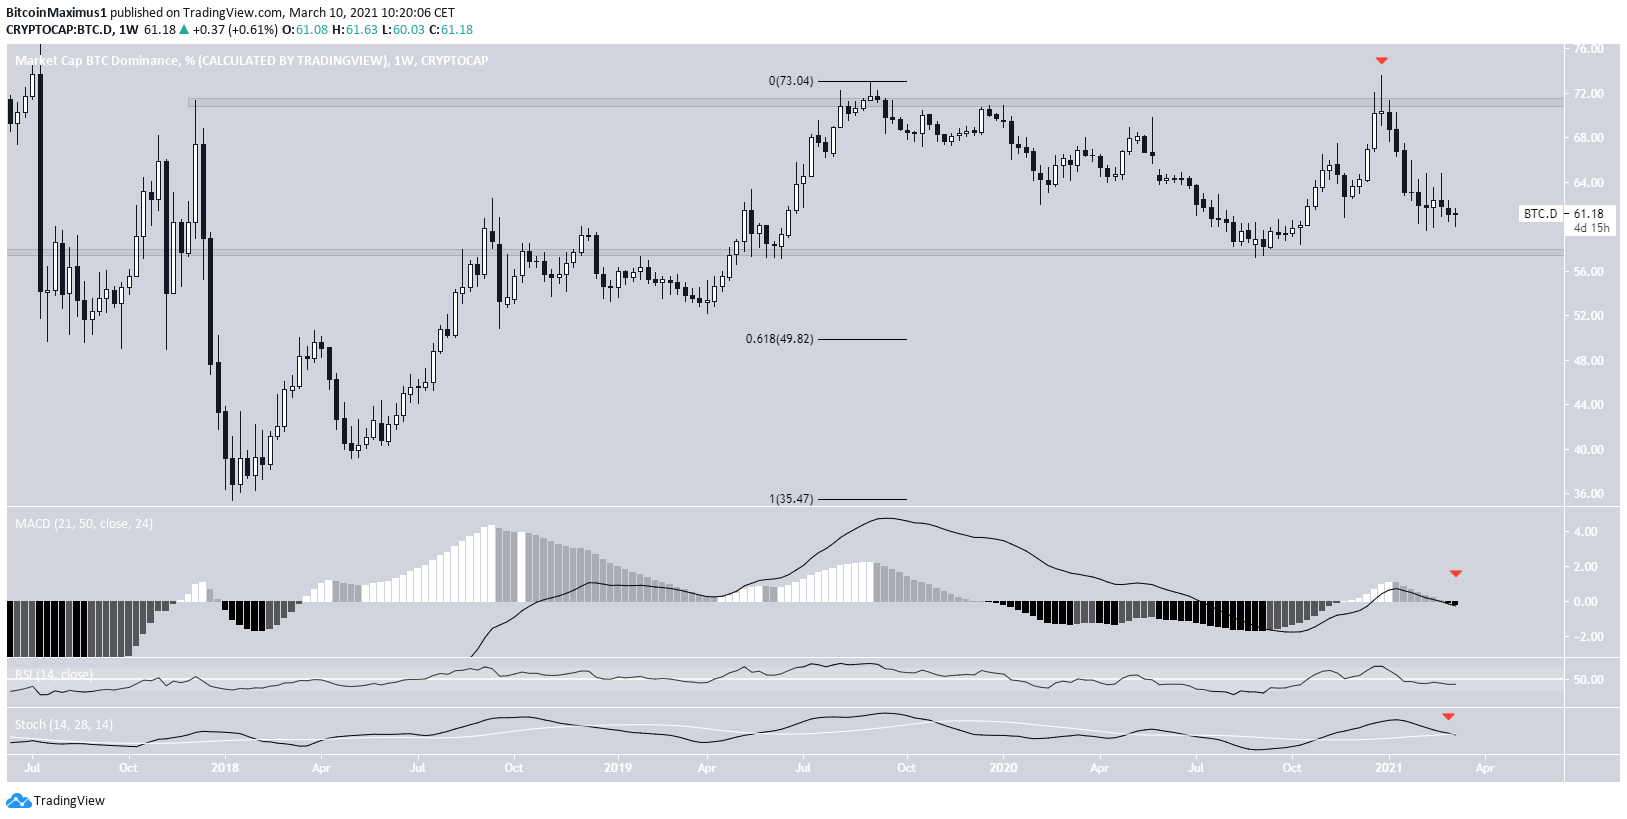
Bitcoin dominance has been decreasing since December 2020 when it attained a local high of 73.65%. A long upper wick was created after a failed breakout attempt from this level.
The descent that followed has taken the BTCD near the main support area at 57.5%. Currently, BTCD is trading near 61%. A breakdown below the 57.5% area would likely trigger a sharp drop.
Technical indicators in the weekly time-frame are bearish. This is evidenced by the bearish momentum bar in the MACD and bearish cross in the Stochastic oscillator.
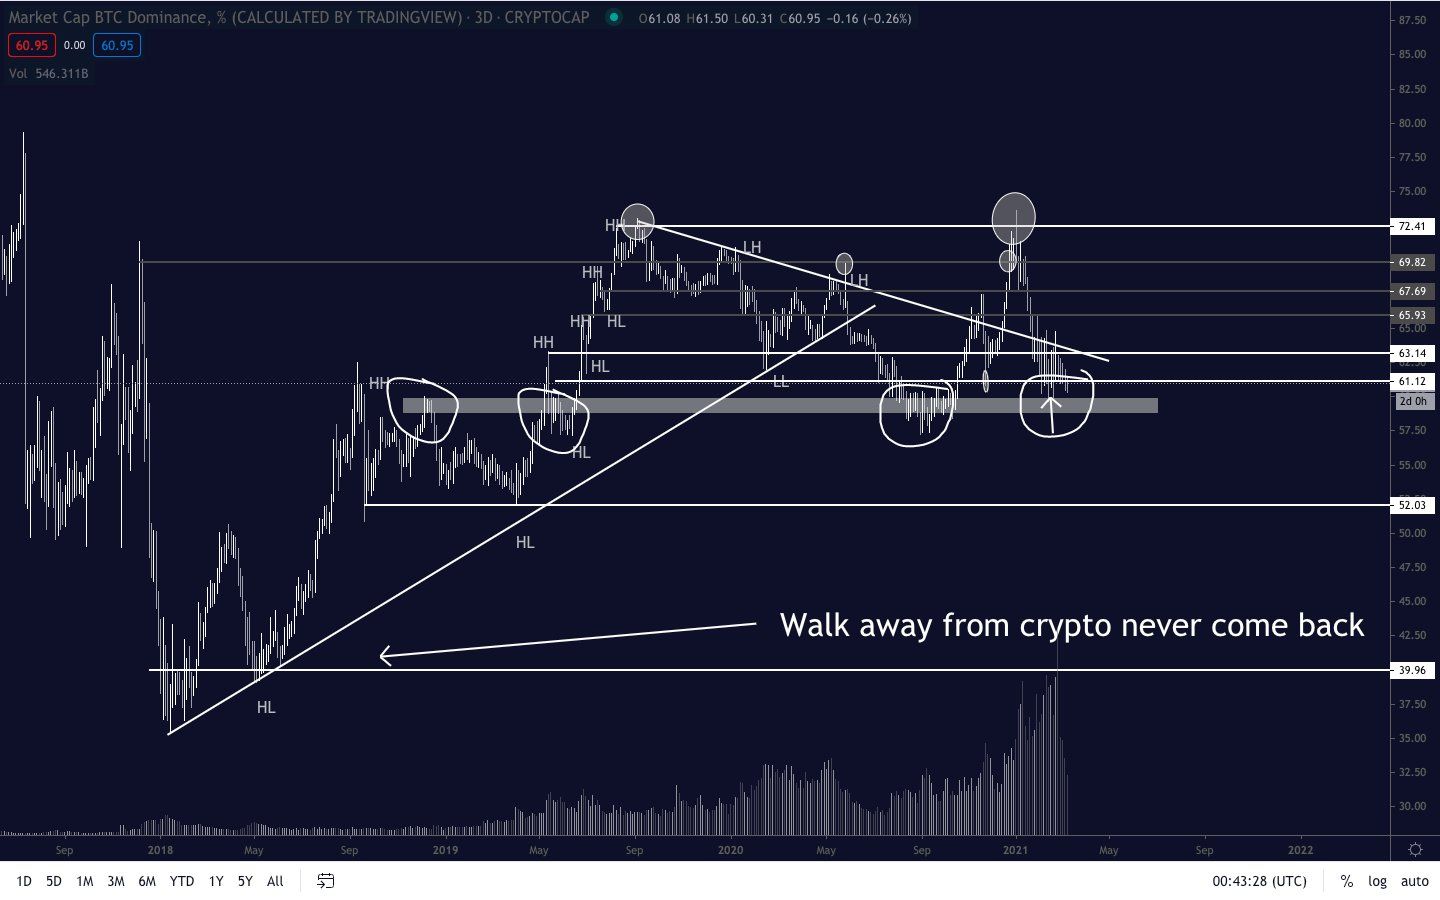
Cryptocurrency trader @Pentosh1 outlined a BTCD chart, stating that it’s likely to fall while altcoins increase.
Similar to the chart presented above, Pentosh1 outlines the main support area at 57.5%, suggesting that a breakdown below it could trigger an accelerated fall.
Current BTCD Movement
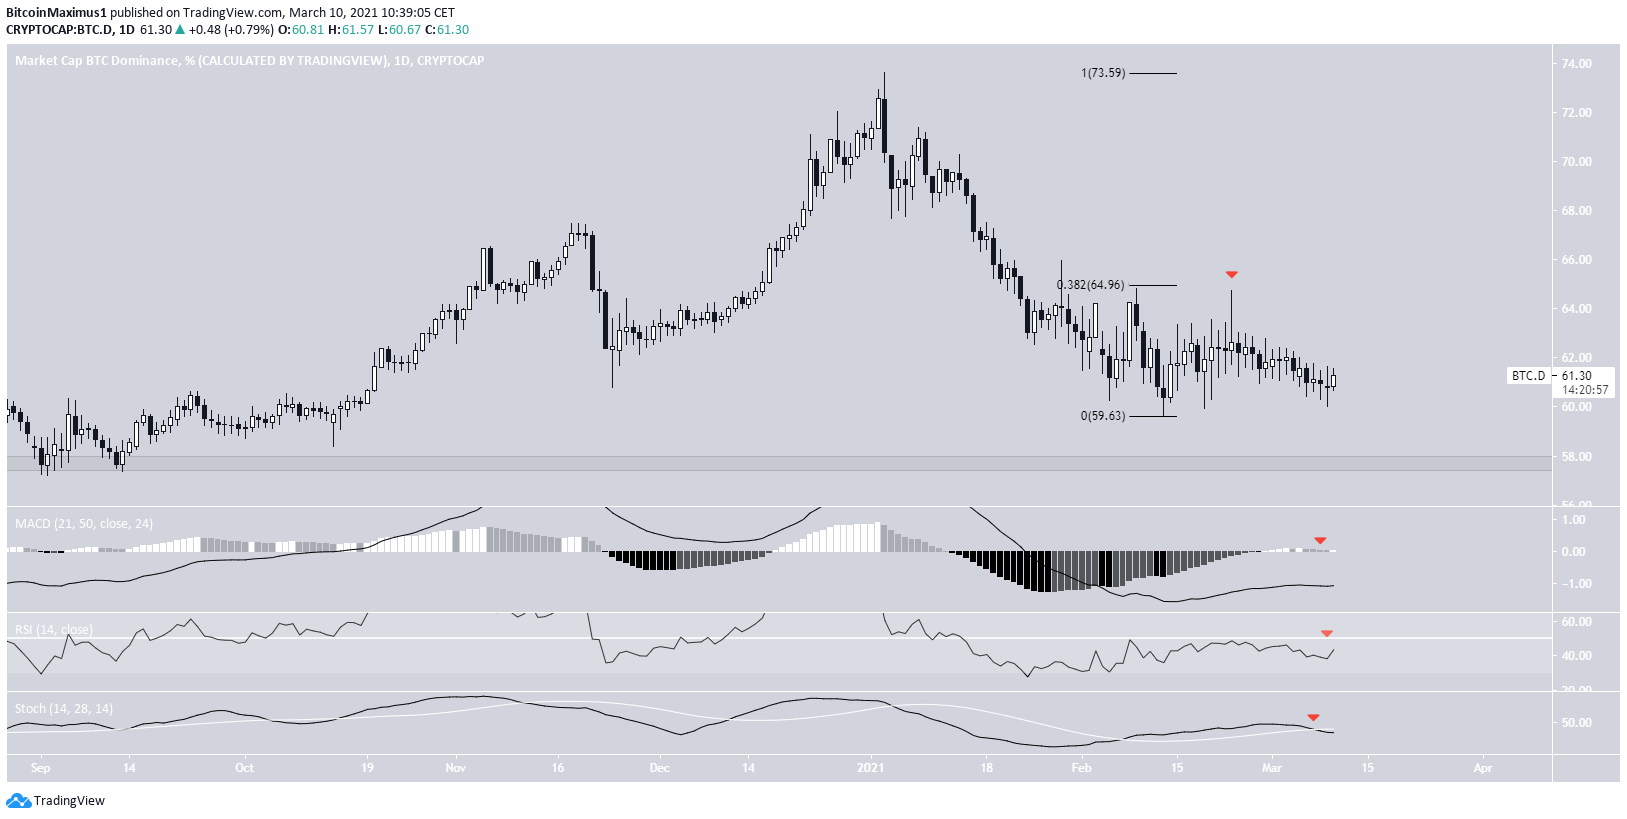
The daily chart supports the reading from the weekly outlook. BTCD has been rejected by the 0.382 Fib retracement and moving downwards.
Technical indicators are bearish. Similar to the weekly time-frame, the Stochastic oscillator has made a bearish cross.
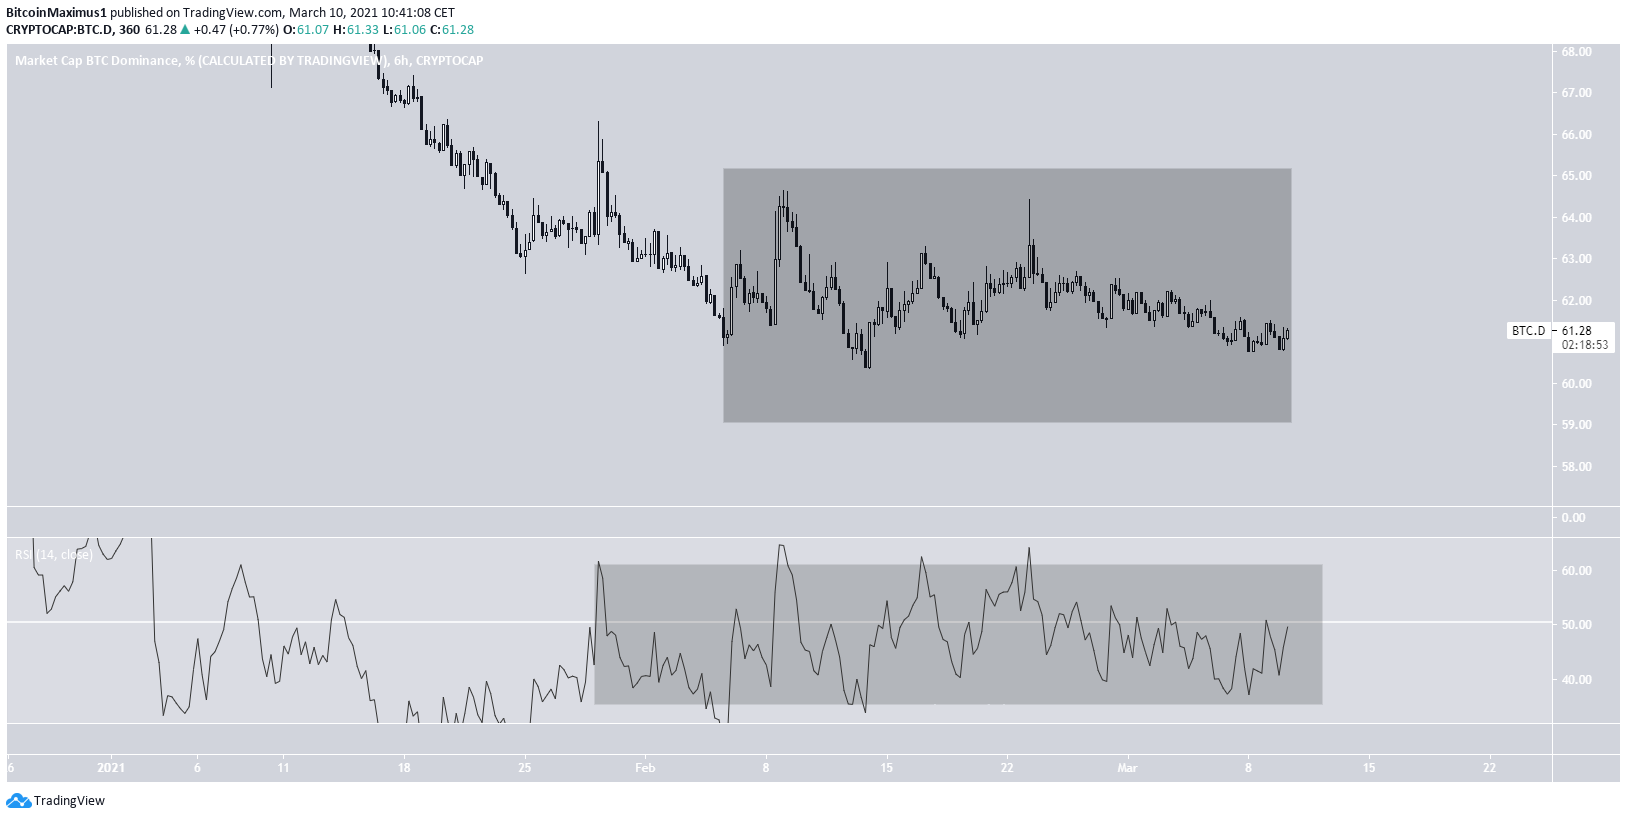
The six-hour chart shows movement that is akin to consolidation. This is because the RSI is freely moving above and below the 50-line.
Therefore, a movement outside of this range is required for the previously outlined drop to commence.
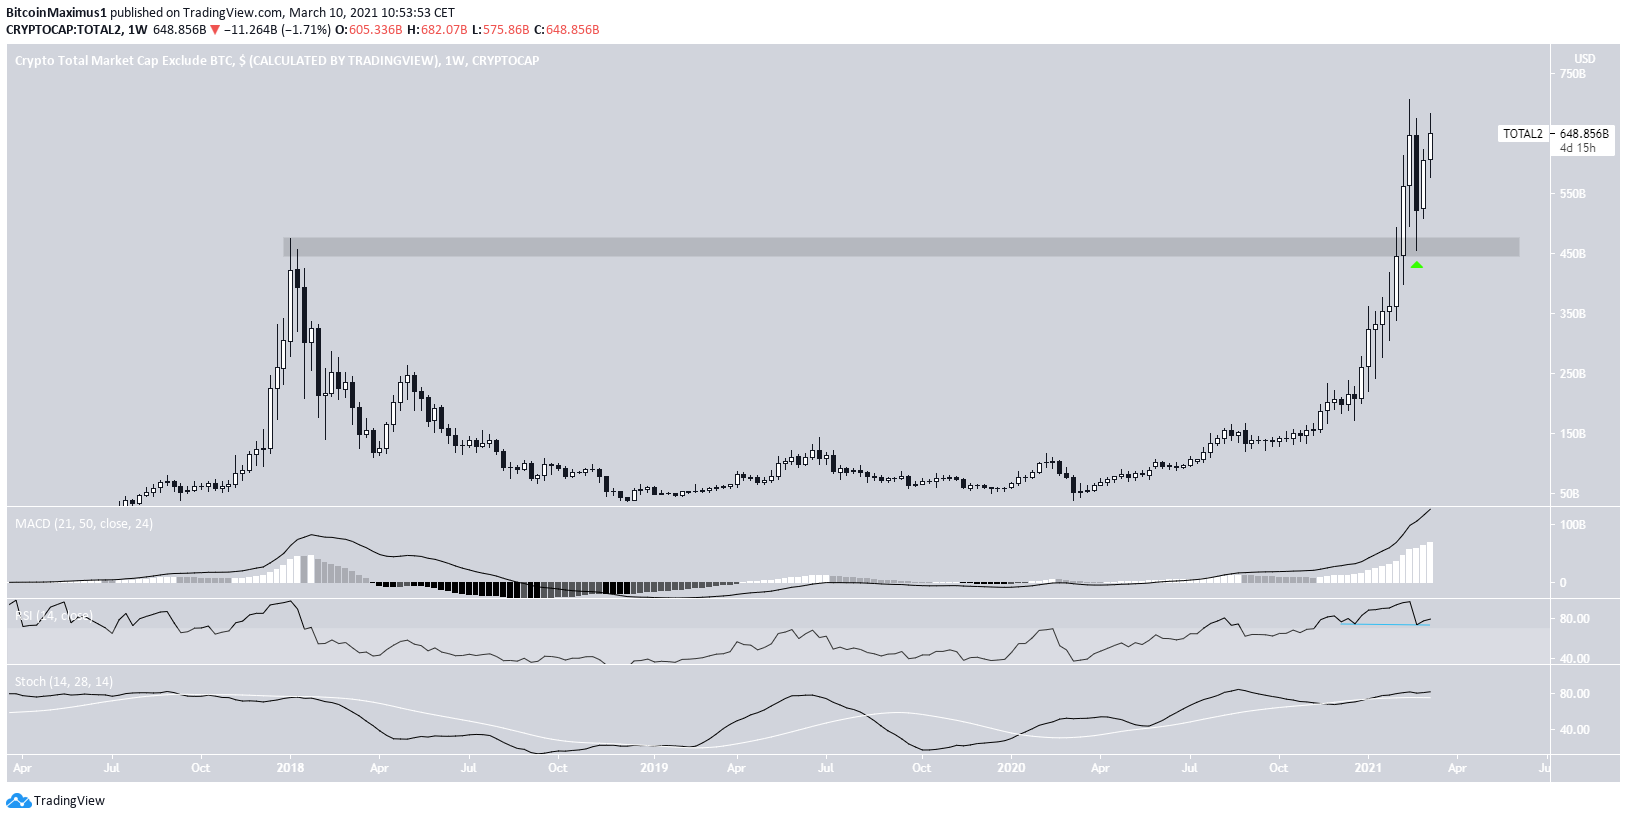
Altcoin Market Cap
The Altcoin Market Cap (ALTCAP) has been moving upwards since Feb. 22. On this date, it validated the previous all-time high resistance area as support.
The upward move was preceded by a hidden bullish divergence in the RSI.
The ALTCAP has nearly broken the previous all-time high. Furthermore, a weekly close at the current level would invalidate the previous bearish engulfing candlestick.
Both the MACD and Stochastic oscillator are increasing. This supports a scenario where the ALTCAP reaches a new all-time high price.
Conclusion
The Bitcoin Dominance Rate is expected to continue its descent toward 57.5%.
On the other hand, the ALTCAP is expected to reach a new all-time high.
For BeInCrypto’s latest Bitcoin (BTC) analysis, click here.


