

On March 29, bitcoin (BTC) broke out from a short-term parallel channel, indicating that the correction is complete.
The BTC price has increased nearly 15% since March 25.
Bitcoin Resumes Bounce
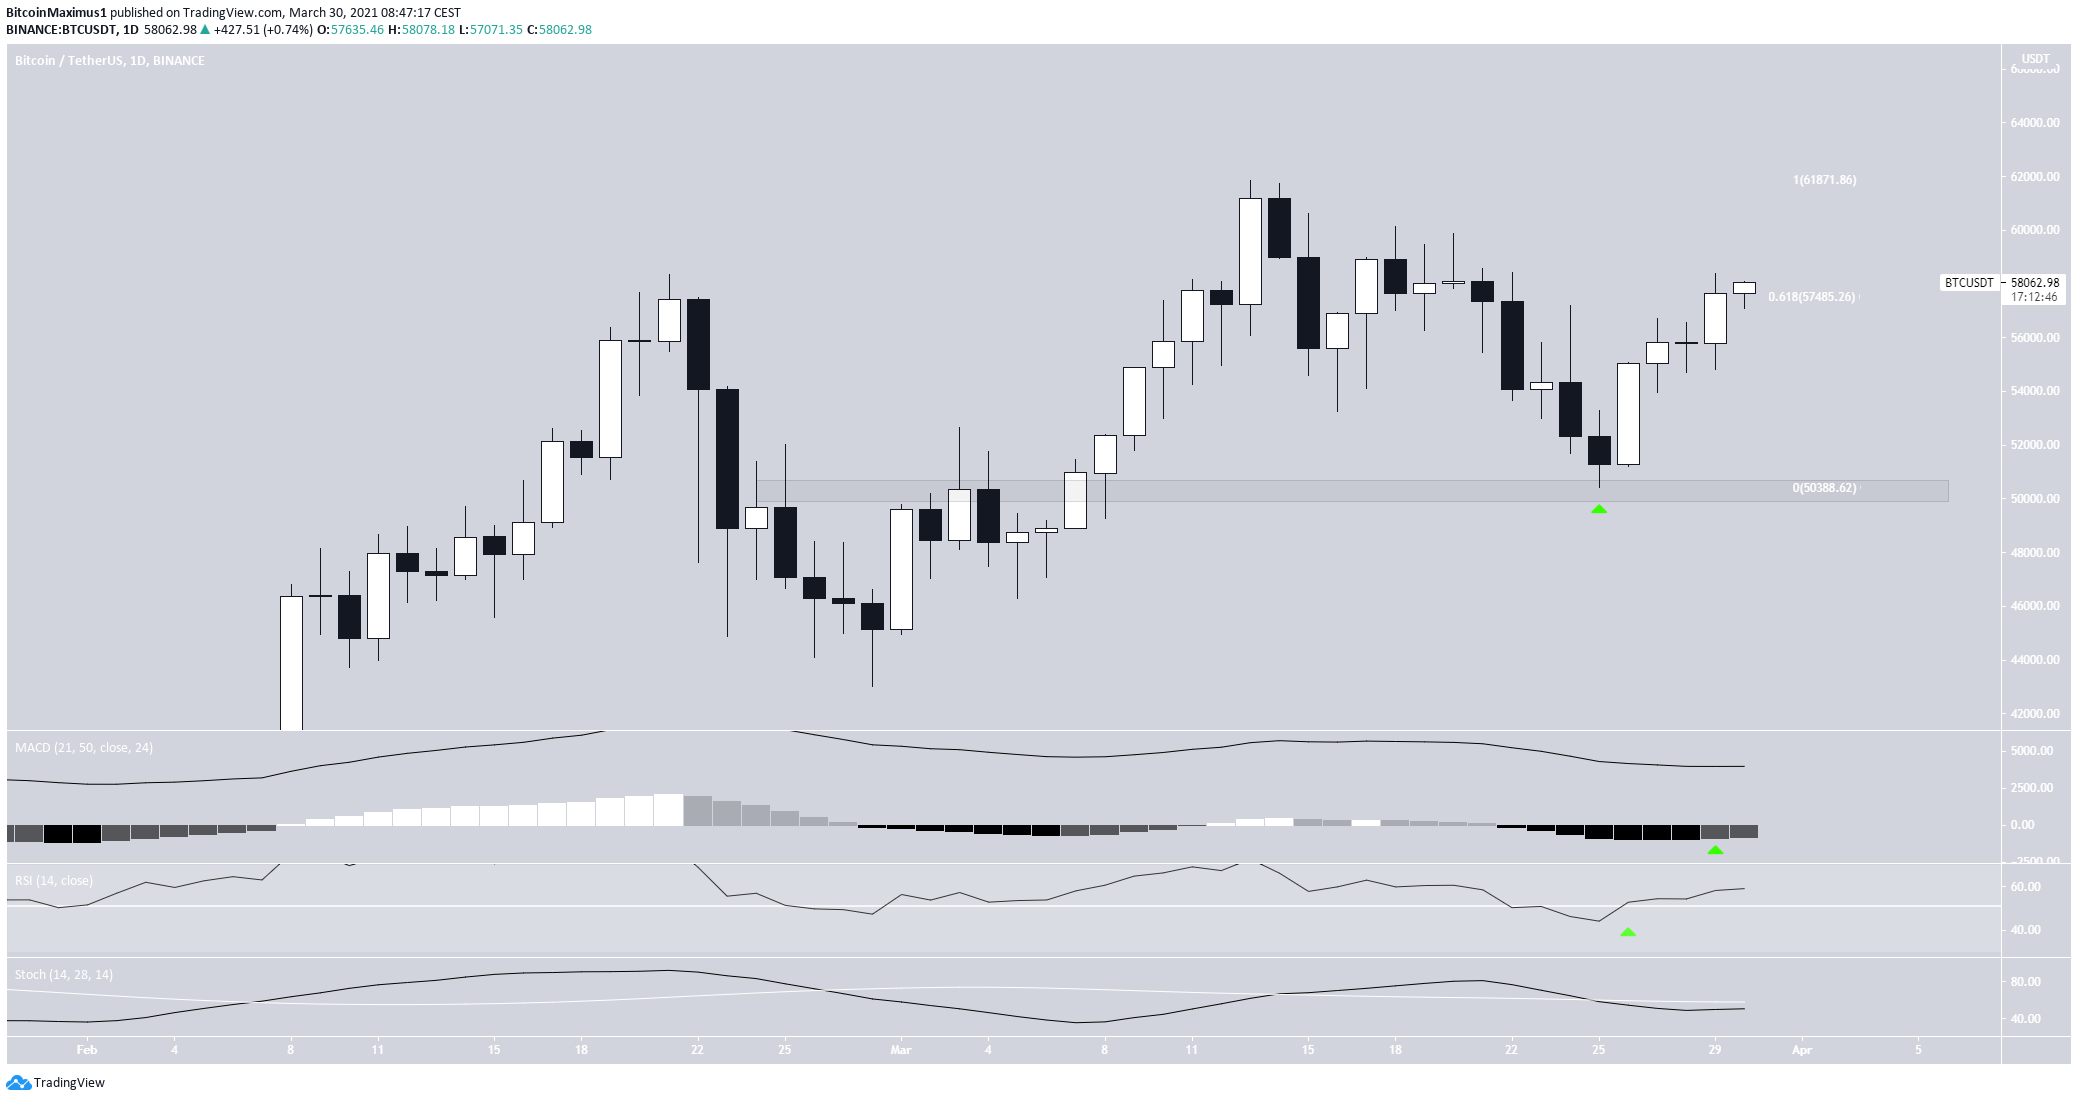
BTC has been moving upwards since March 25, when it bounced at the $50,250 support area.
On March 29, it created another bullish candlestick, reaching a high of $58,405. The high was important since it took BTC above the 0.618 Fib retracement level of the previous decrease — a level that often acts as a reversal.
This is also supported by the movements from technical indicators. The MACD has created one higher momentum bar and the RSI has crossed above 50.
The Stochastic oscillator has yet to make a bullish cross but is very close to doing so. This would likely confirm that the trend is bullish.
Channel Break Out
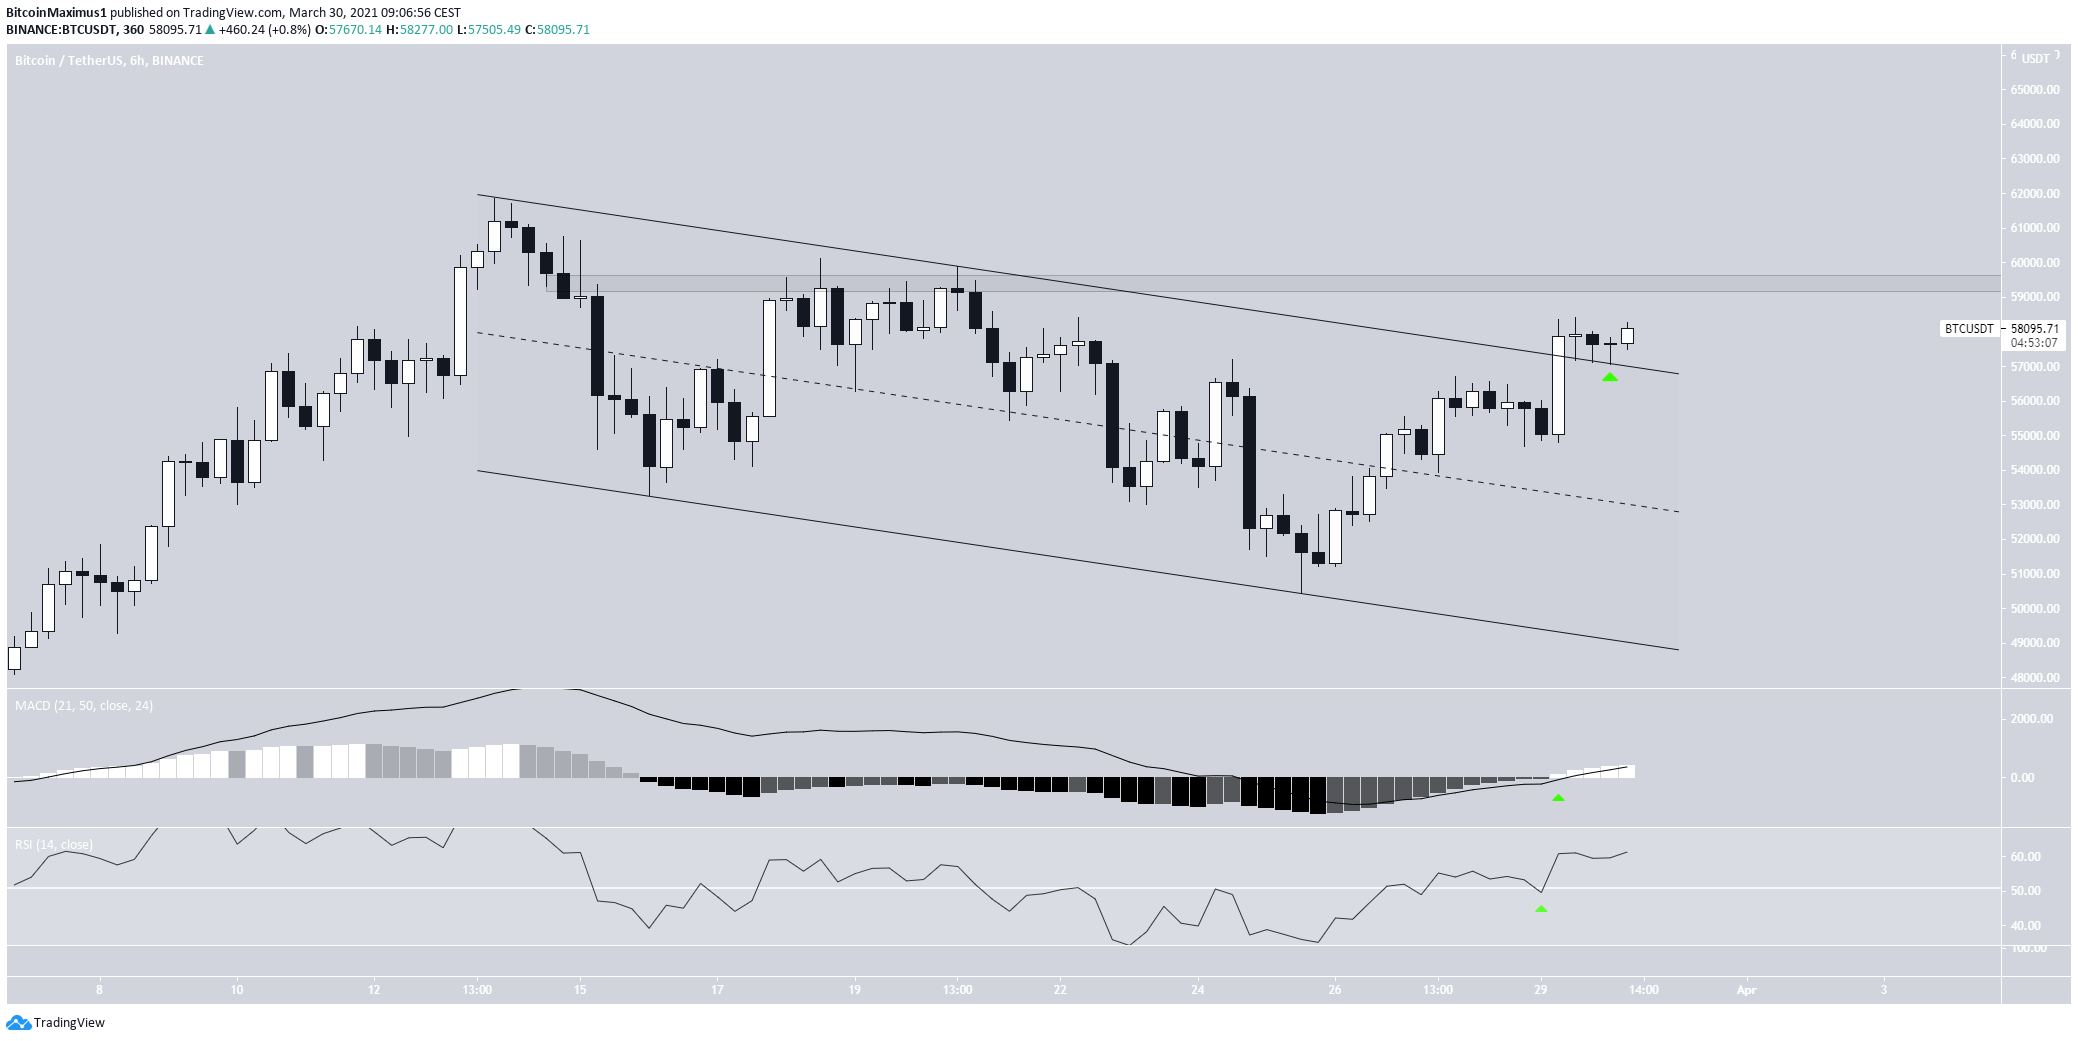
The six-hour time-frame shows that BTC has broken out from a short-term descending parallel channel.
Afterward, it validated the channel as support (green arrow). This is a bullish sign that suggests that the ongoing correction since the all-time high on March 13 has ended.
The next closest minor resistance area is found at $59,500,
Wave Count
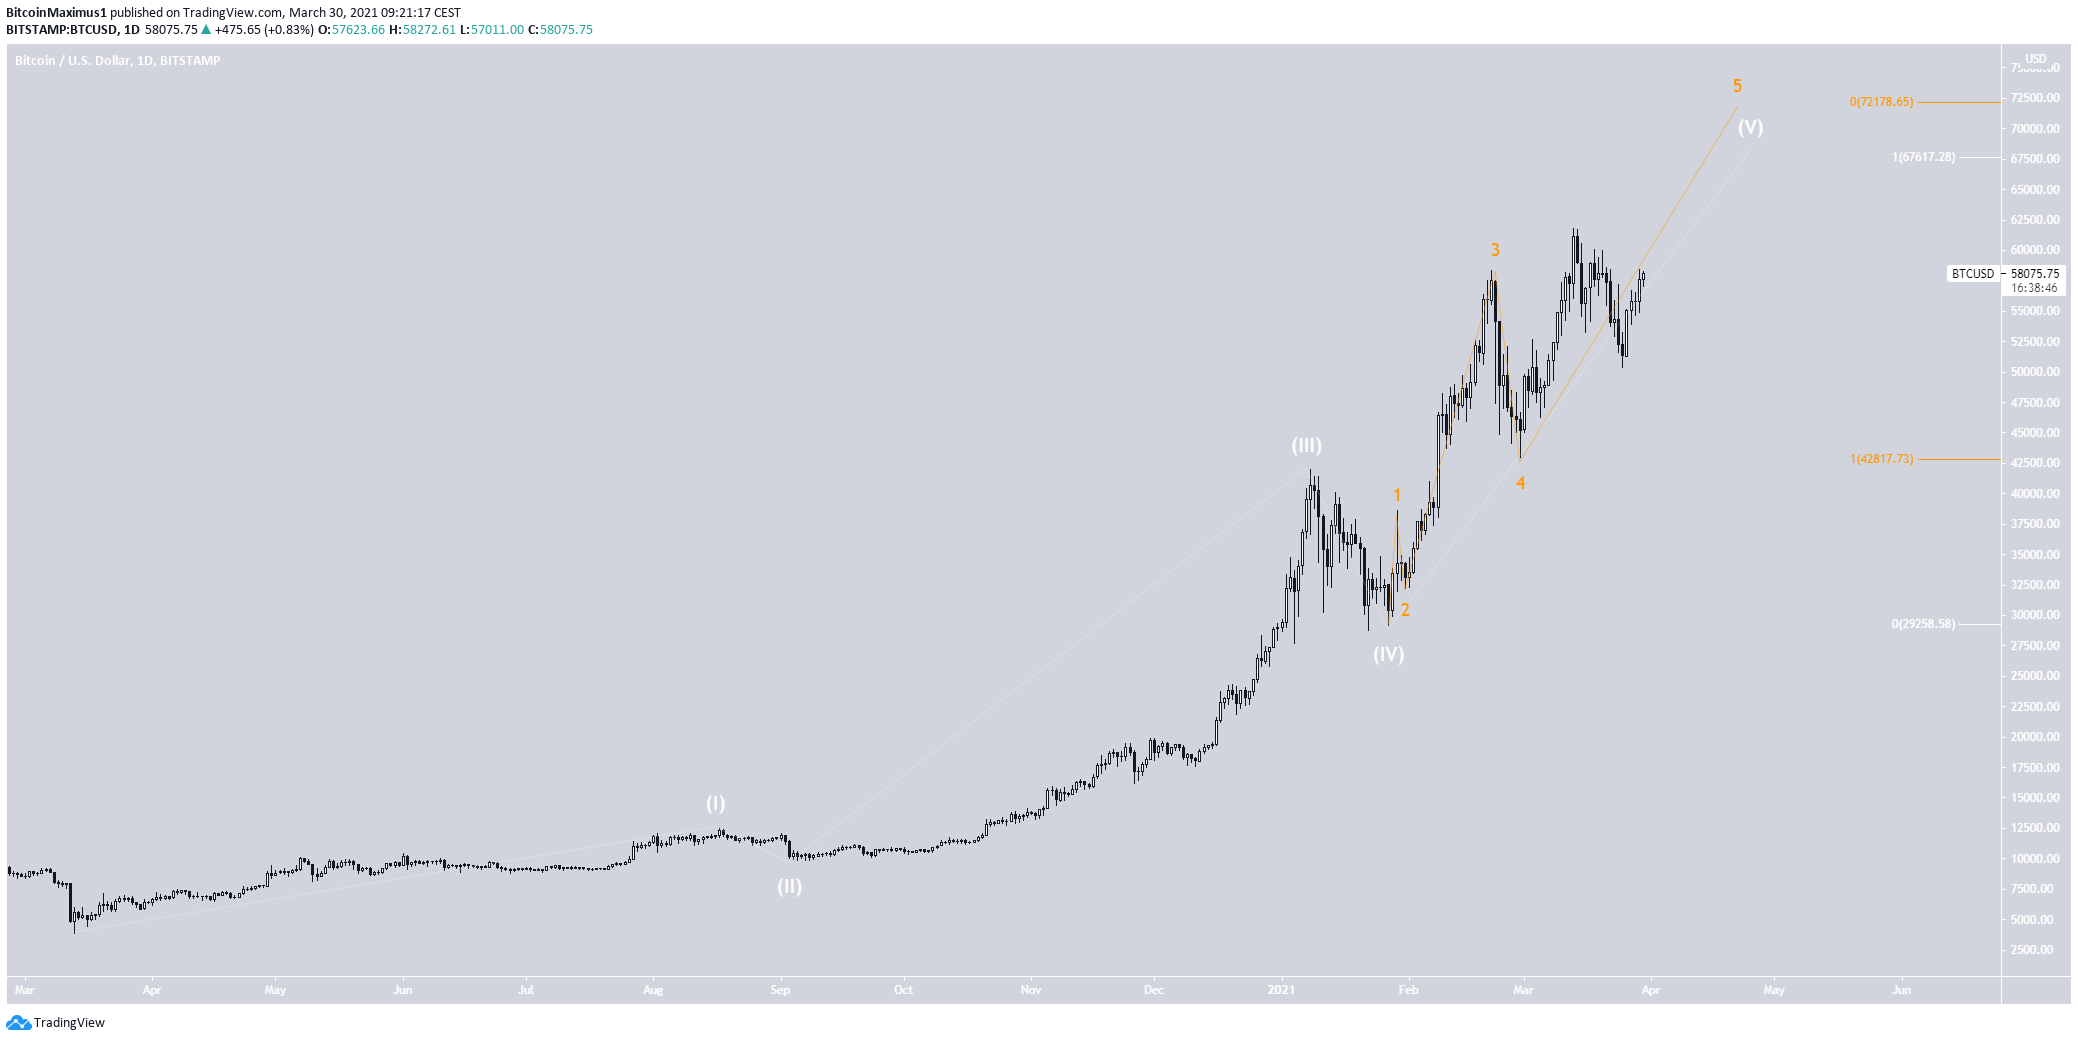
The wave count indicates that BTC is nearing the top of wave five (white) of a bullish impulse that began in March 2020.
The sub-wave count is shown in orange. It indicates that BTC is in sub-wave five.
A potential target for the top of the upward movement is found between $67,600-$72,100.
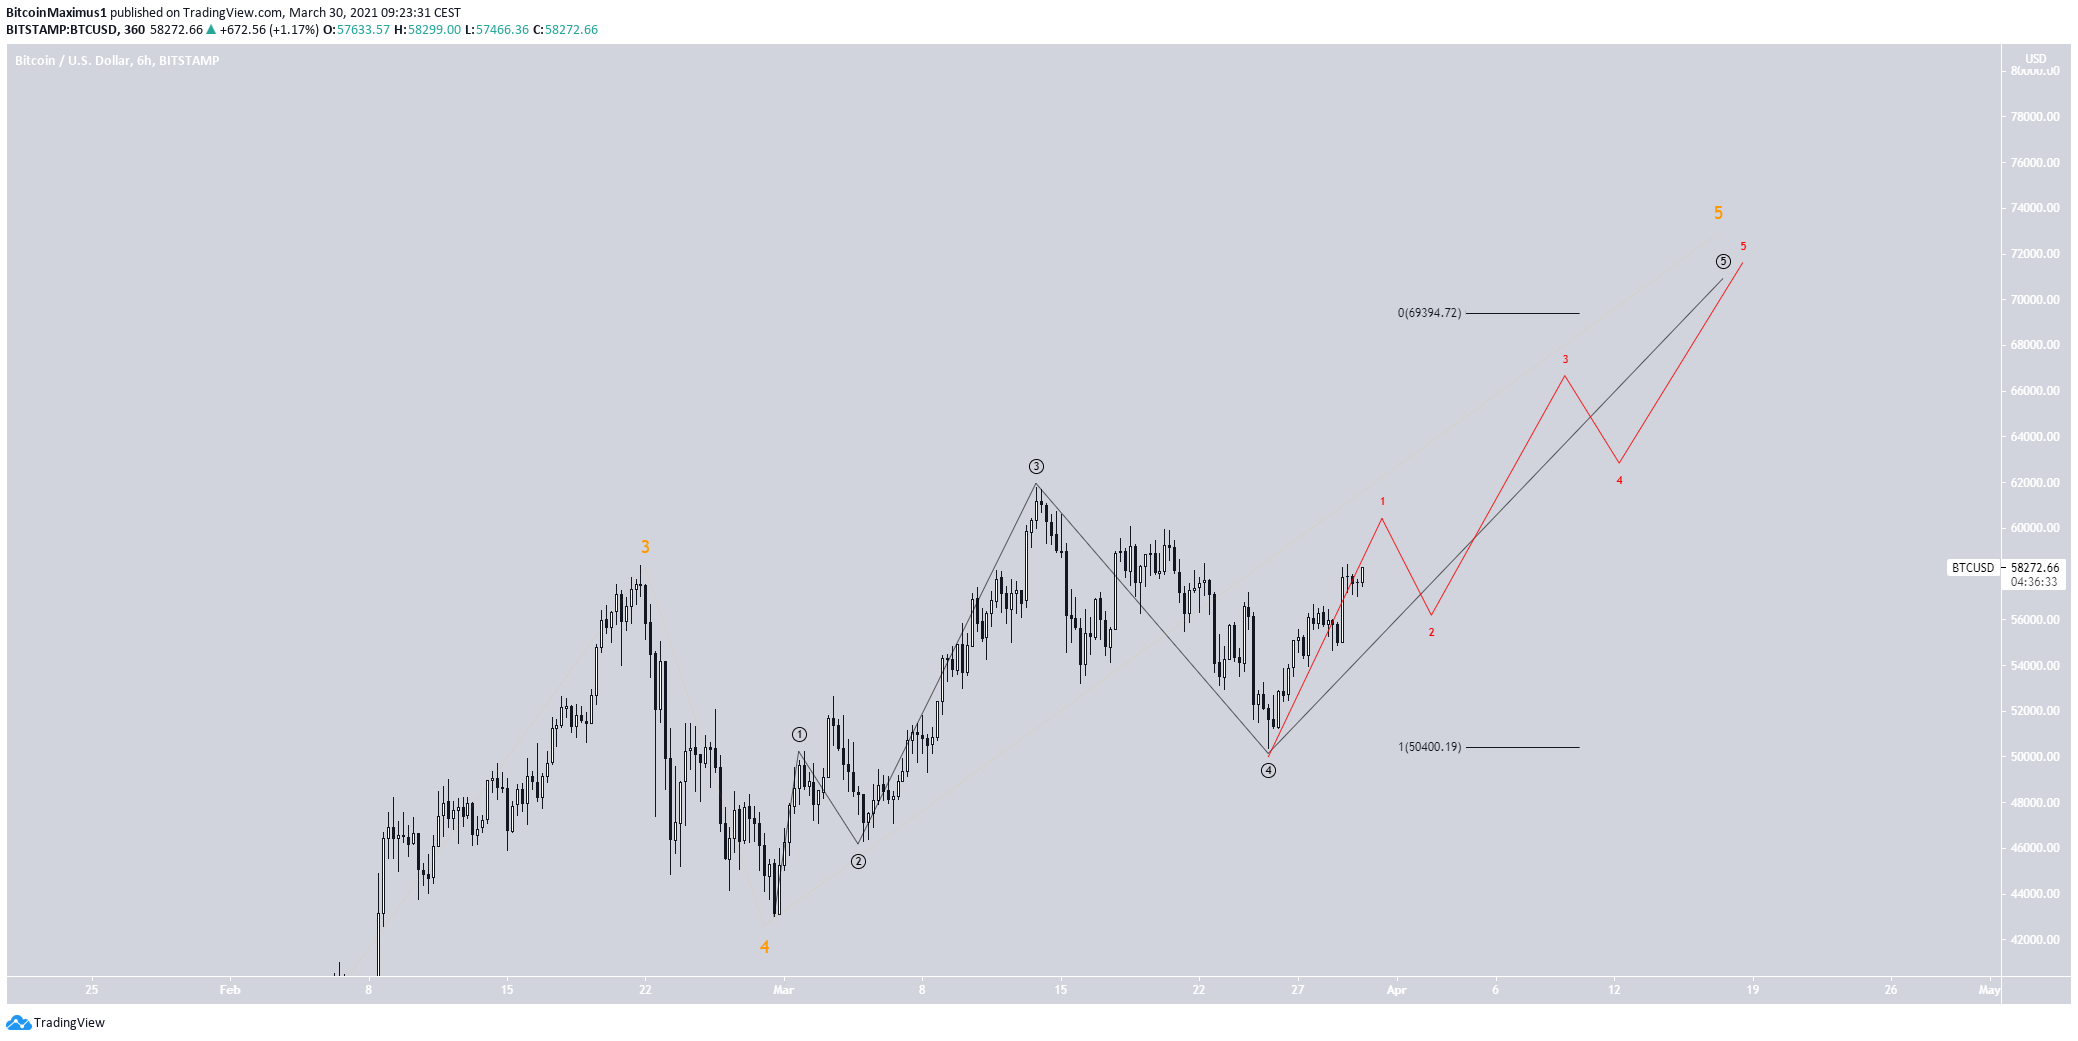
An even closer look at the movement (more speculative) shows that BTC is likely in minor sub-wave five (black), which has extended.
This provides a target near $69,000 for the top of the upward move.
Conclusion
Bitcoin is expected to gradually increase towards a new all-time high price. A short-term rejection could occur at $59,500 prior to the continuation of the upward movement.
For BeInCrypto’s previous bitcoin (BTC) analysis, click here.
Trusted
Disclaimer
In line with the Trust Project guidelines, this price analysis article is for informational purposes only and should not be considered financial or investment advice. BeInCrypto is committed to accurate, unbiased reporting, but market conditions are subject to change without notice. Always conduct your own research and consult with a professional before making any financial decisions. Please note that our Terms and Conditions, Privacy Policy, and Disclaimers have been updated.
