


The Bitcoin Cash (BCH) price has not traded above $300 in more than 190 days but is currently attempting to do so.
The price trades inside a short-term corrective pattern and a long-term horizontal resistance area.
Bitcoin Cash Trades at Range High
The weekly time frame technical analysis shows that the BCH price has increased since breaking out from a long-term descending resistance line at the start of 2023. The line had persisted for more than 600 days before the breakout.
The BCH price created a higher low in June and accelerated its rate of increase, leading to a high of $329 later in the month. The high still stands.
After a brief decrease, BCH showed resilience by bouncing at a horizontal support area (green icon) and now attempts to move above its previous highs (red icon).
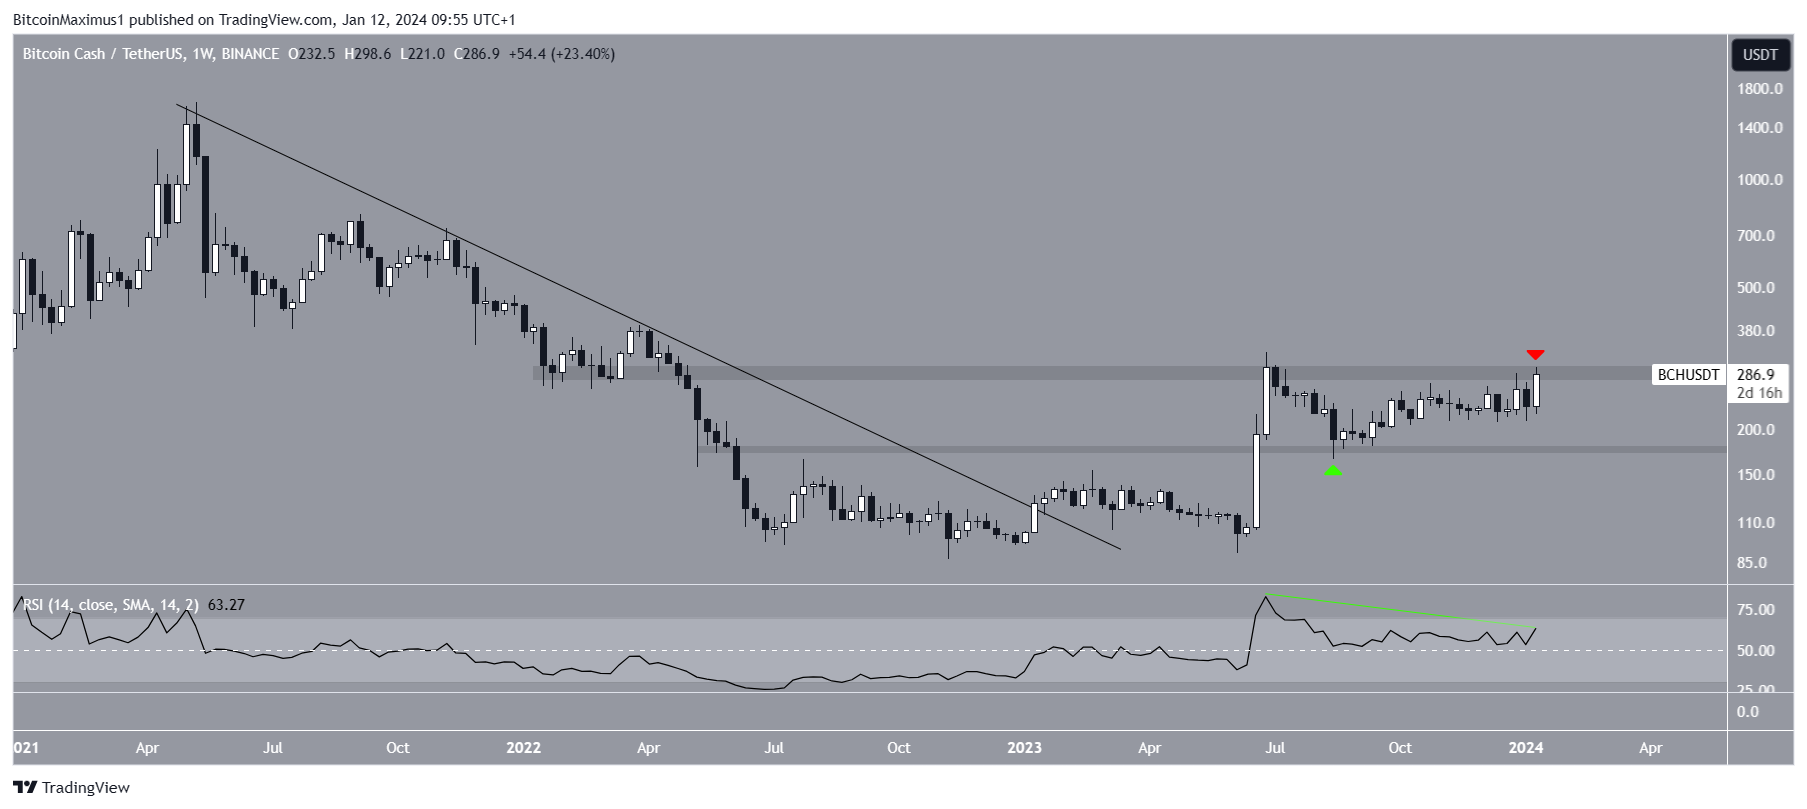
The weekly RSI gives a mixed reading. The RSI is a momentum indicator traders use to evaluate whether a market is overbought or oversold and whether to accumulate or sell an asset.
Readings above 50 and an upward trend suggest that bulls still have an advantage, while readings below 50 indicate the opposite. The RSI is increasing and is above 50, both bullish signs. However, the indicator could generate a bearish divergence based on the weekly close, considered a sign of weakness.
Read More: How to Buy Bitcoin Cash (BCH)?
BCH Price Prediction: When Will BCH Reclaim $300?
Similarly to the weekly time frame, the daily one does not determine the trend’s direction. This is because of the price action.
Since August 2023, BCH has traded inside an ascending parallel channel. These channels usually contain corrective movements, meaning that a breakdown from them is the most likely scenario.
Read More: 8 Best Bitcoin Cash (BCH) Wallets
However, the BCH price shows resilience by moving into the channel’s upper portion. It is currently attempting to break out from its resistance trend line. Bill Noble believes that this strength comes from the Bitcoin (BTC) ETF approval.
The daily RSI has shown bullish signs since it moved above 50. So, whether the BCH price breaks out from the channel or gets rejected will determine the future trend’s direction.
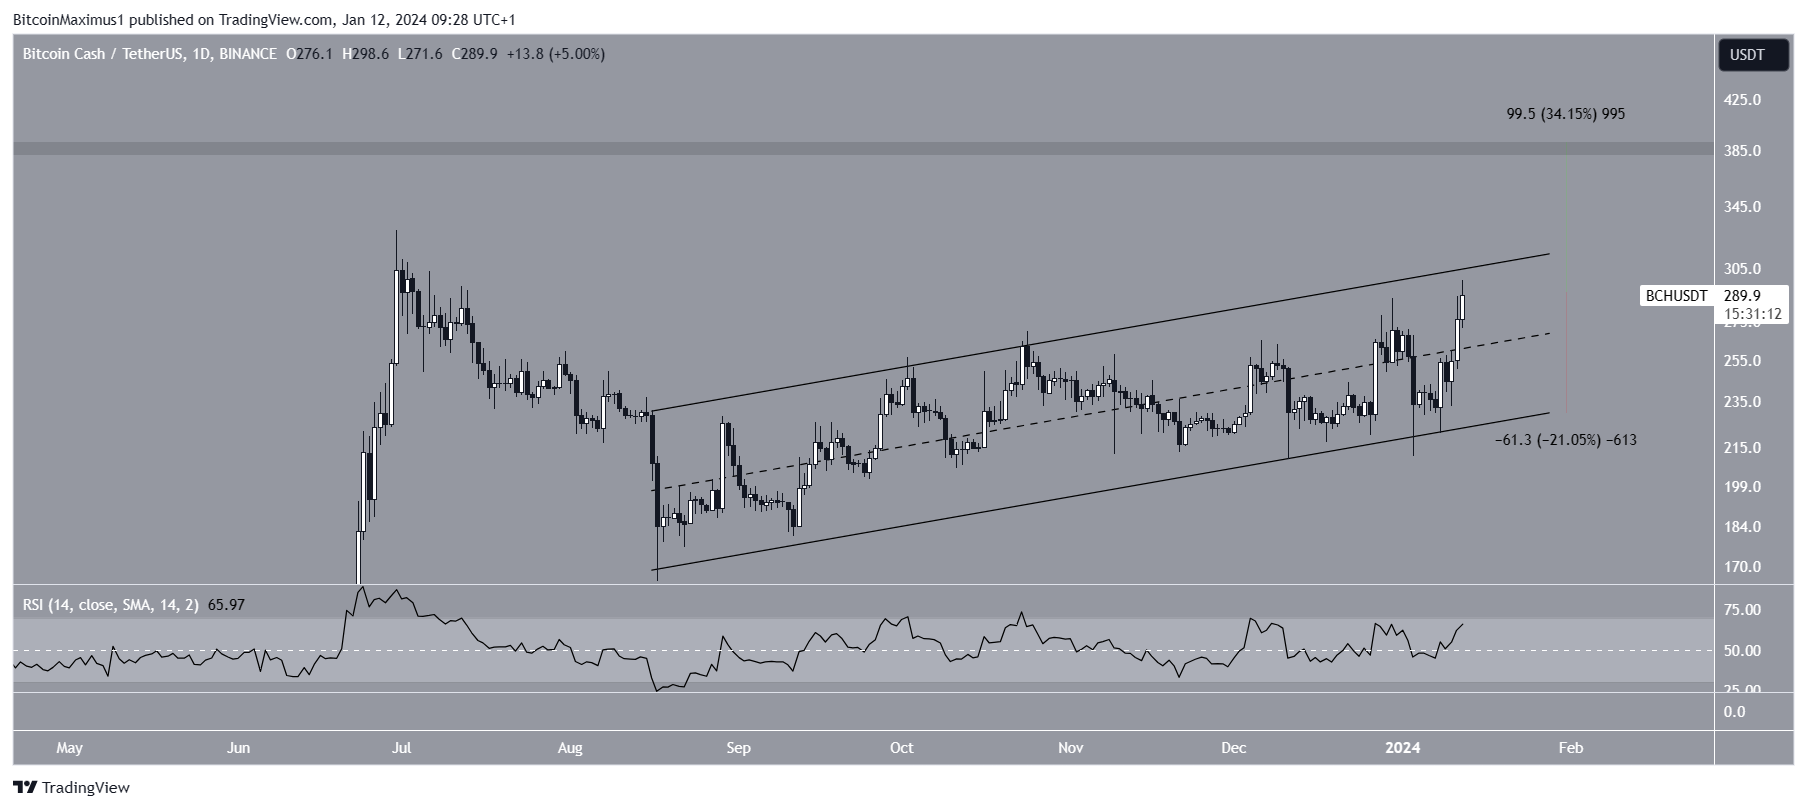
A breakout can trigger a 35% increase to the next long-term resistance at $390. However, if a rejection occurs, BCH could fall 20% to the channel’s support trend line at $230.
For BeInCrypto‘s latest crypto market analysis, click here.



