


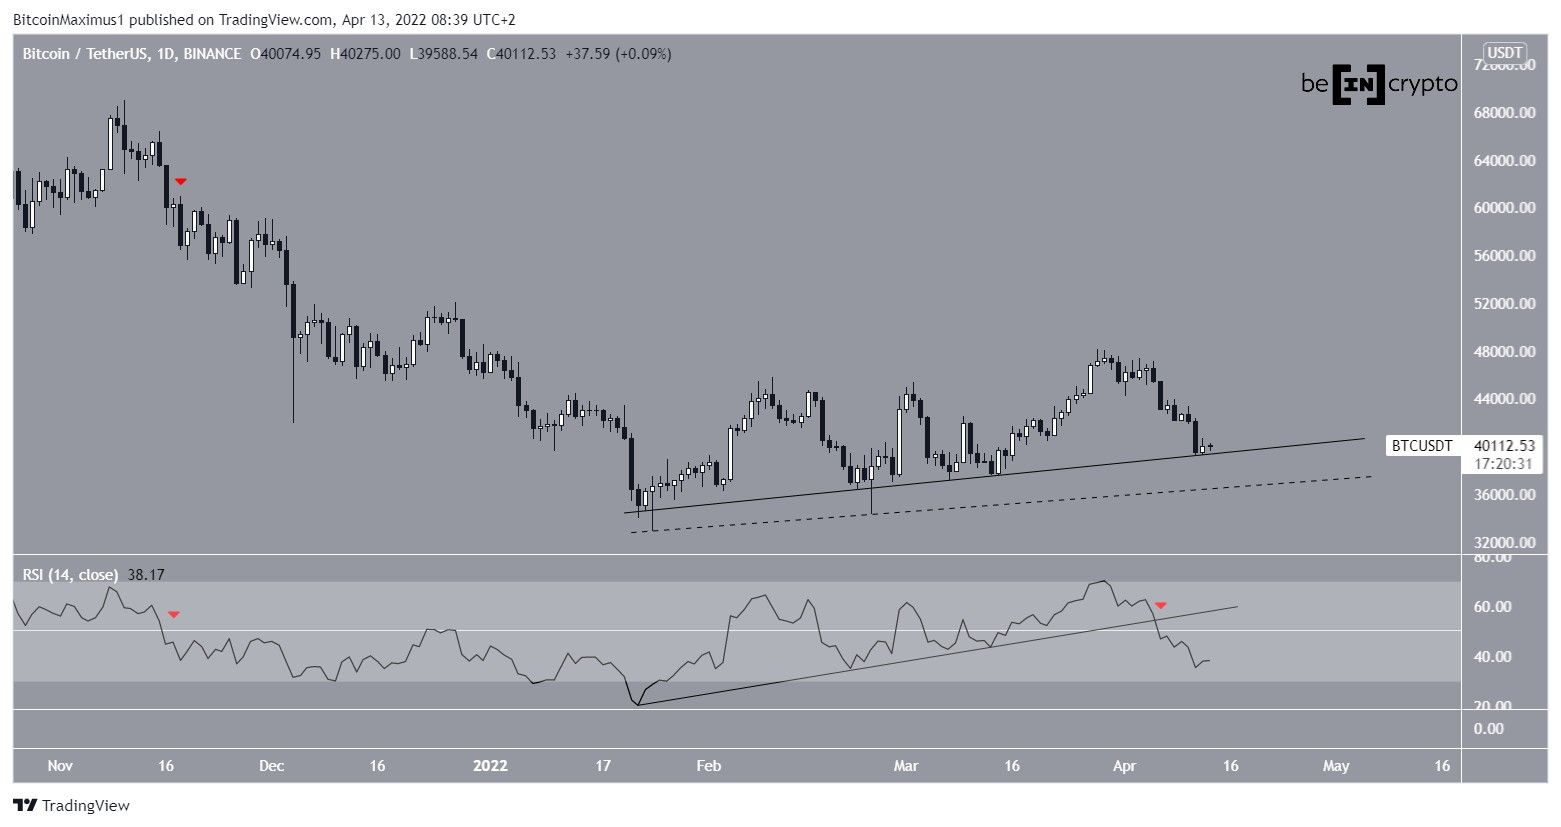
Bitcoin (BTC) rebounded at a minor diagonal support level near $40,000 but could still test the primary support zone between $37,000 and $38,000.
Bitcoin has been decreasing since March 28 and dropped to a local low of $39,200 on April 11.
It’s possible that BTC bounced at an ascending support line (solid) that has been in place since Jan. 22.
However, technical indicators are bearish. The RSI has broken down from an ascending support line and is currently below 50. The RSI is a momentum indicator and readings below 50 are a sign of bearish momentum.
In addition to this, the previous time this indicator decreased below 50 (red icon), it led to a month-long dip to the January lows at $32,917.
If BTC breaks down again, the next ascending support line (dashed) would be found at $37,500.
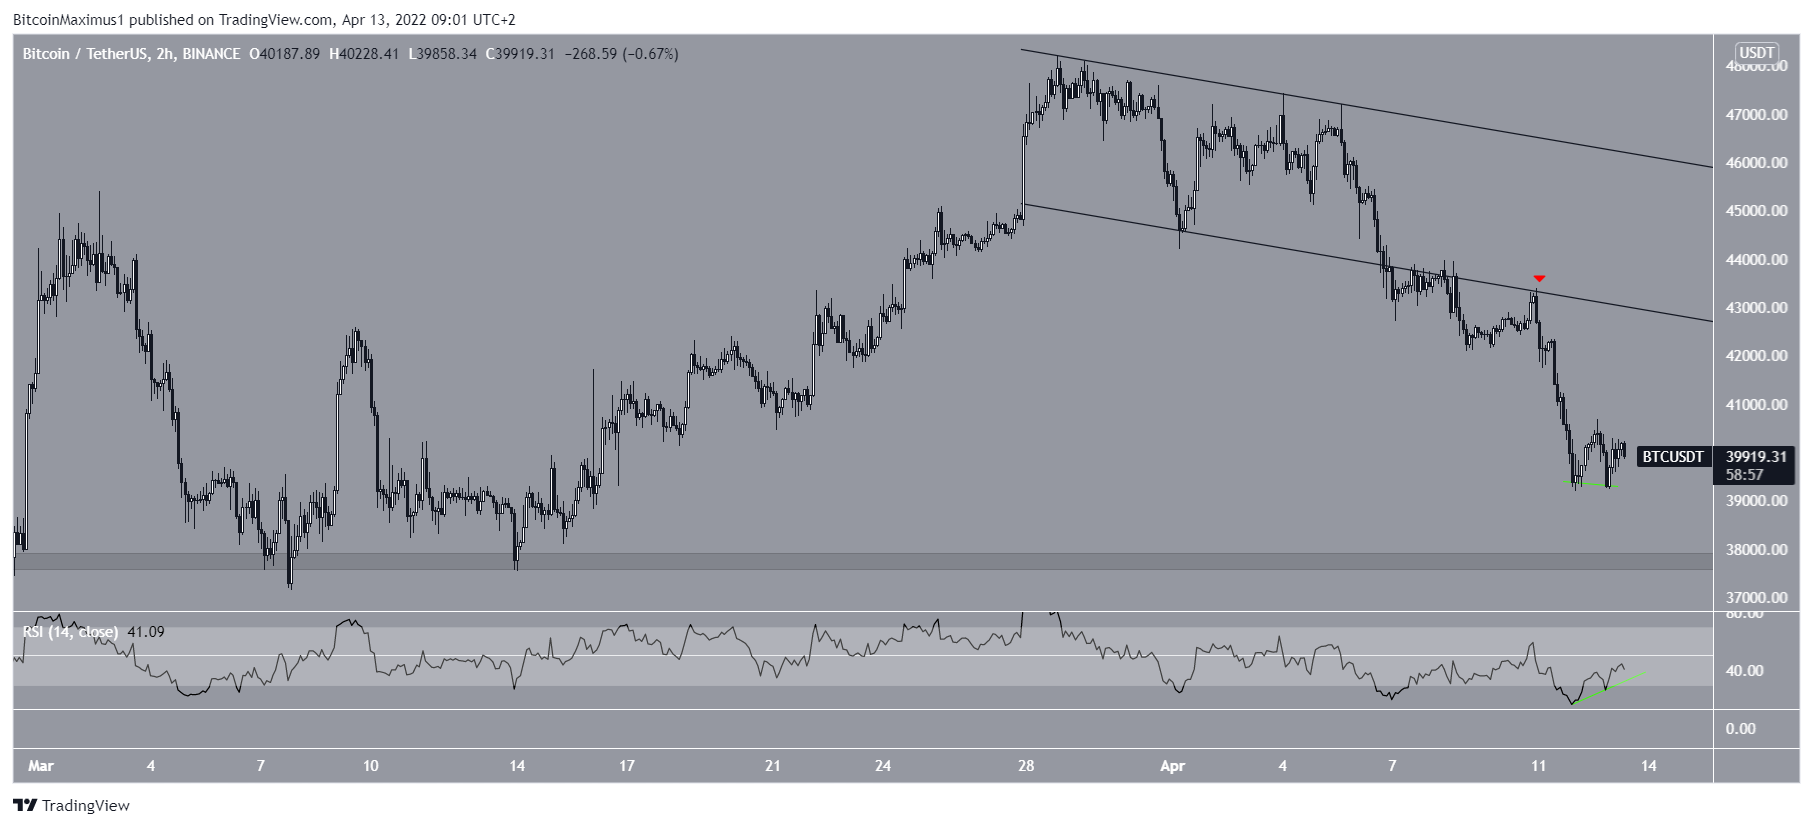
Channel breakdown
The two-hour chart shows that BTC has broken down from a descending parallel channel. It validated the channel as resistance on April 11 (red icon) before accelerating to the downside.
If the downward movement continues, the closest support area would be found near $37,800.
Unlike the daily RSI, the two-hour RSI is showing bullish signs. Apart from generating a bullish divergence (green line), it’s at its most oversold level since January.
However, the price action does not show any bullish reversal signs.
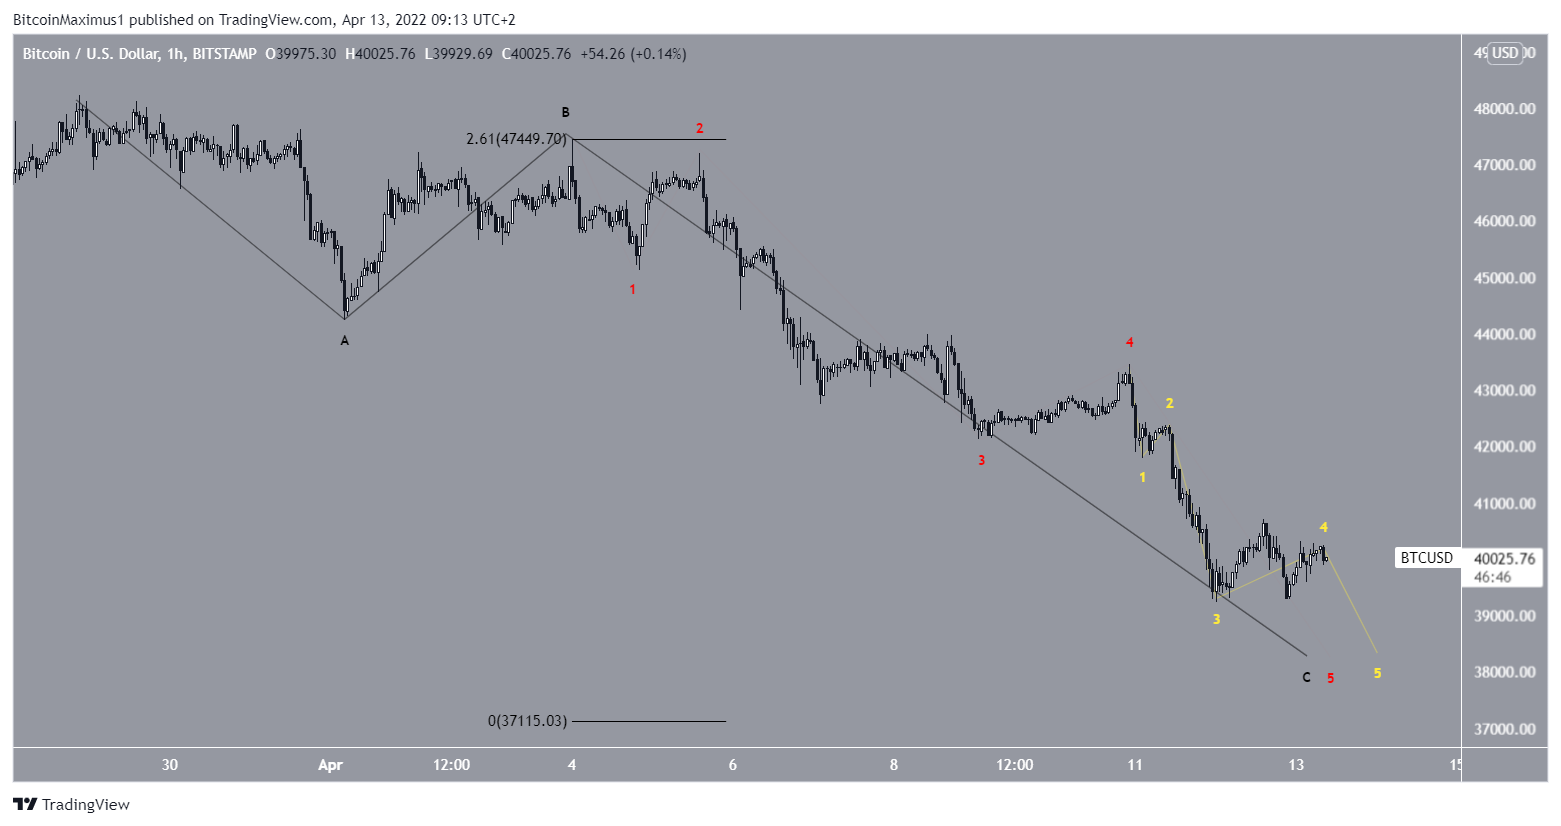
BTC wave count analysis
The long-term wave count suggests that an eventual upward move toward $50,000 is expected. However, BTC could still make another short-term low prior to doing so.
The most likely short-term count suggests that the ongoing decrease is an A-B-C corrective structure (black). Giving waves A and C a 1:2.61 ratio would lead to a low of $37,110. The sub-wave and minor sub-wave counts are shown in red and yellow, respectively.
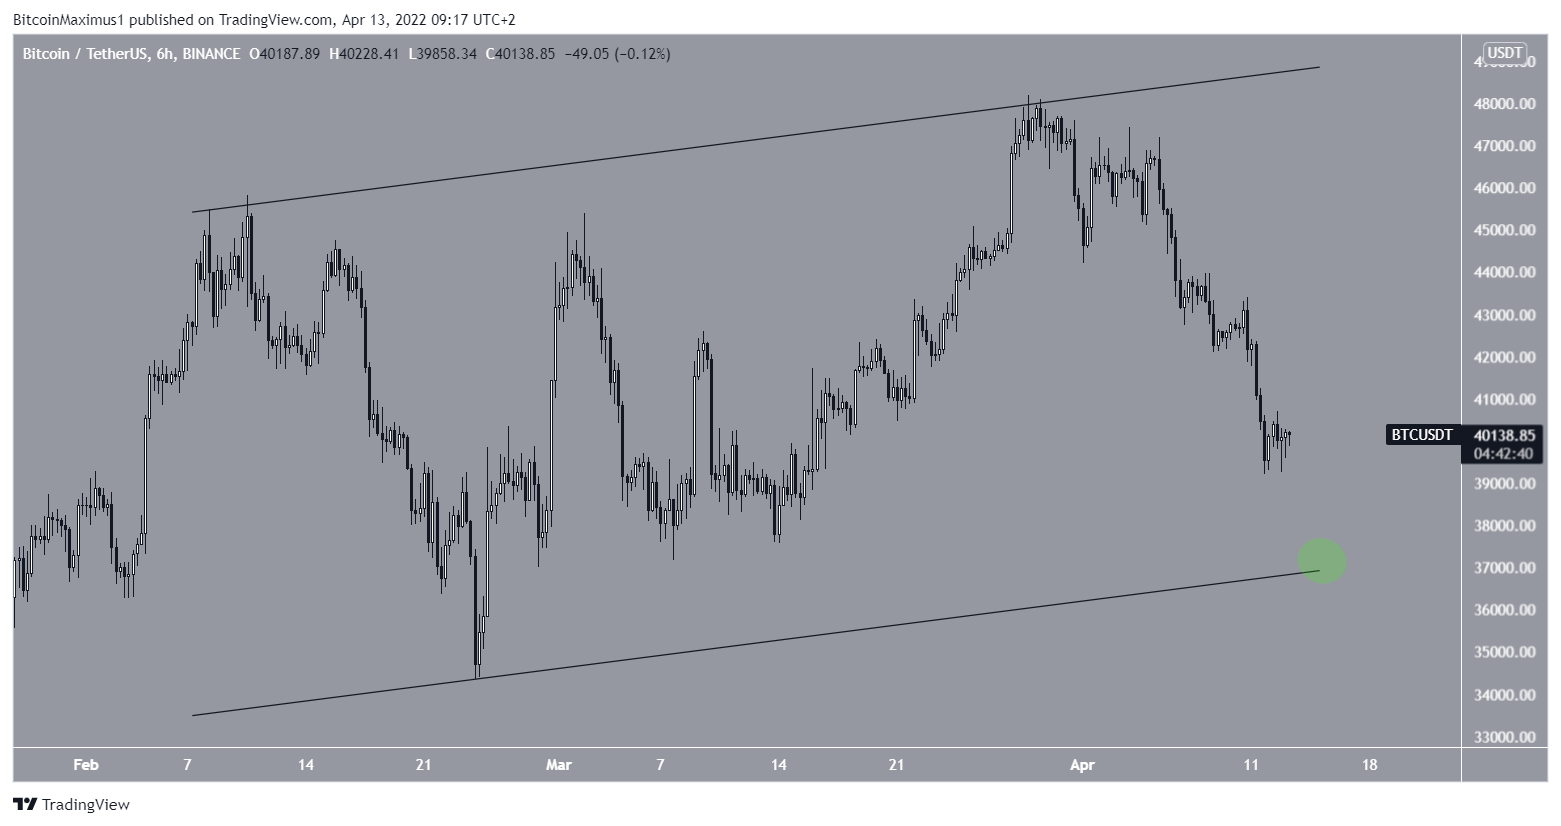
The potential $37,100 target would also take BTC all the way down to the support line of a potential ascending parallel channel.
For BeInCrypto’s previous Bitcoin (BTC) analysis, click here


