


Bitcoin (BTC) has yet to show any clear reversal signs since its March 28 local top. However, indicator readings are oversold and BTC is trading at a confluence of Fibonacci and diagonal support levels.
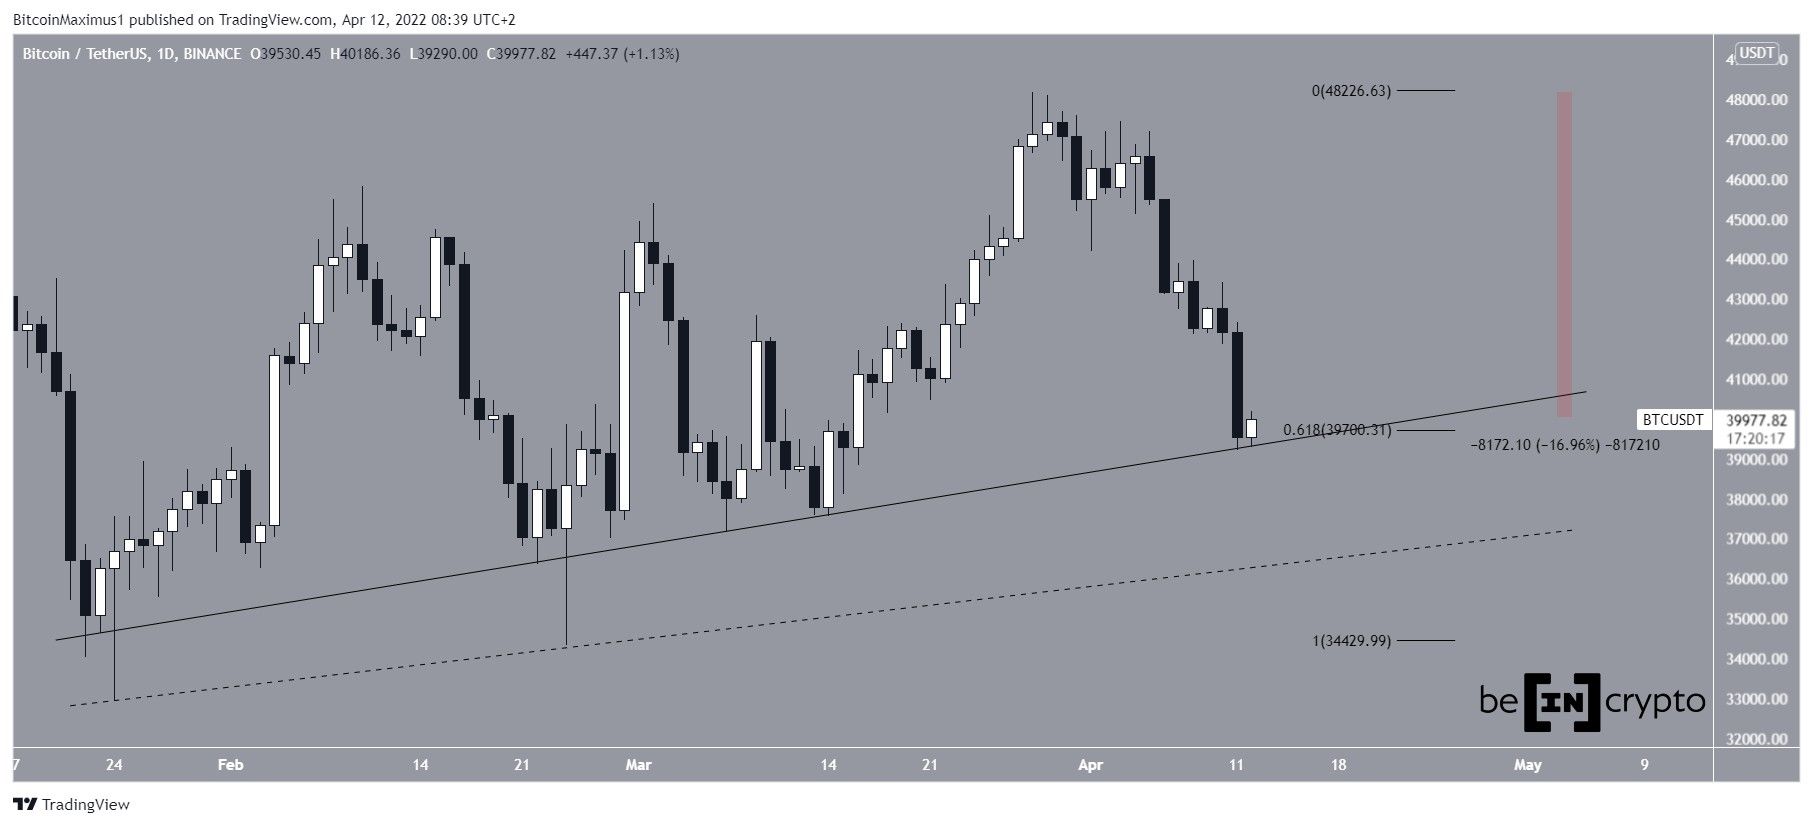
Bitcoin has been falling since reaching a local high of $48,189 on March 28. The downward move led to a low of $39,200 on April 11. This is a decrease of 17% when measuring from the March 28 high.
It appears as though BTC has rebounded at an ascending support line (solid) that has been in place since Jan. 22. This is also near the 0.618 Fib retracement support level of the most recent portion of the upward movement, found at $39,700.
If the area fails to hold as support, there is another ascending support line (dashed) at $37,500. The line is created by connecting the absolute wick lows instead of the price closes.
Bearish BTC readings
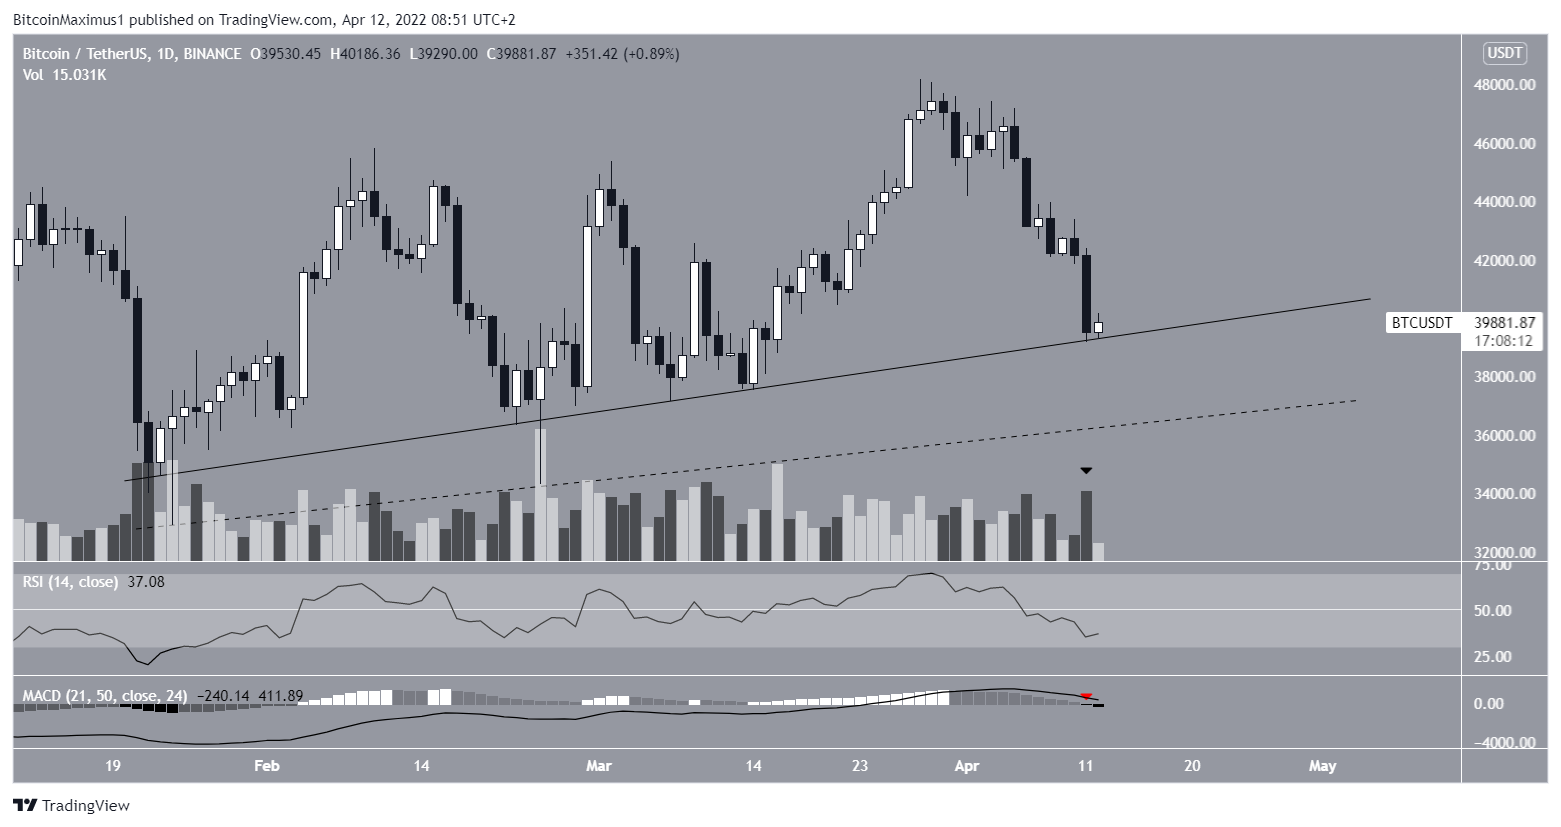
Despite the slight rebound, daily time frame technical indicators are bearish. This is especially visible by the MACD, which is decreasing and is negative (red icon). In addition to this, the RSI is decreasing and is below 50. These are both considered signs of bearish trends.
Finally, the April 11 decrease transpired with higher than average volume (black arrow), supporting the possibility that the trend is bearish.
Short-term movement
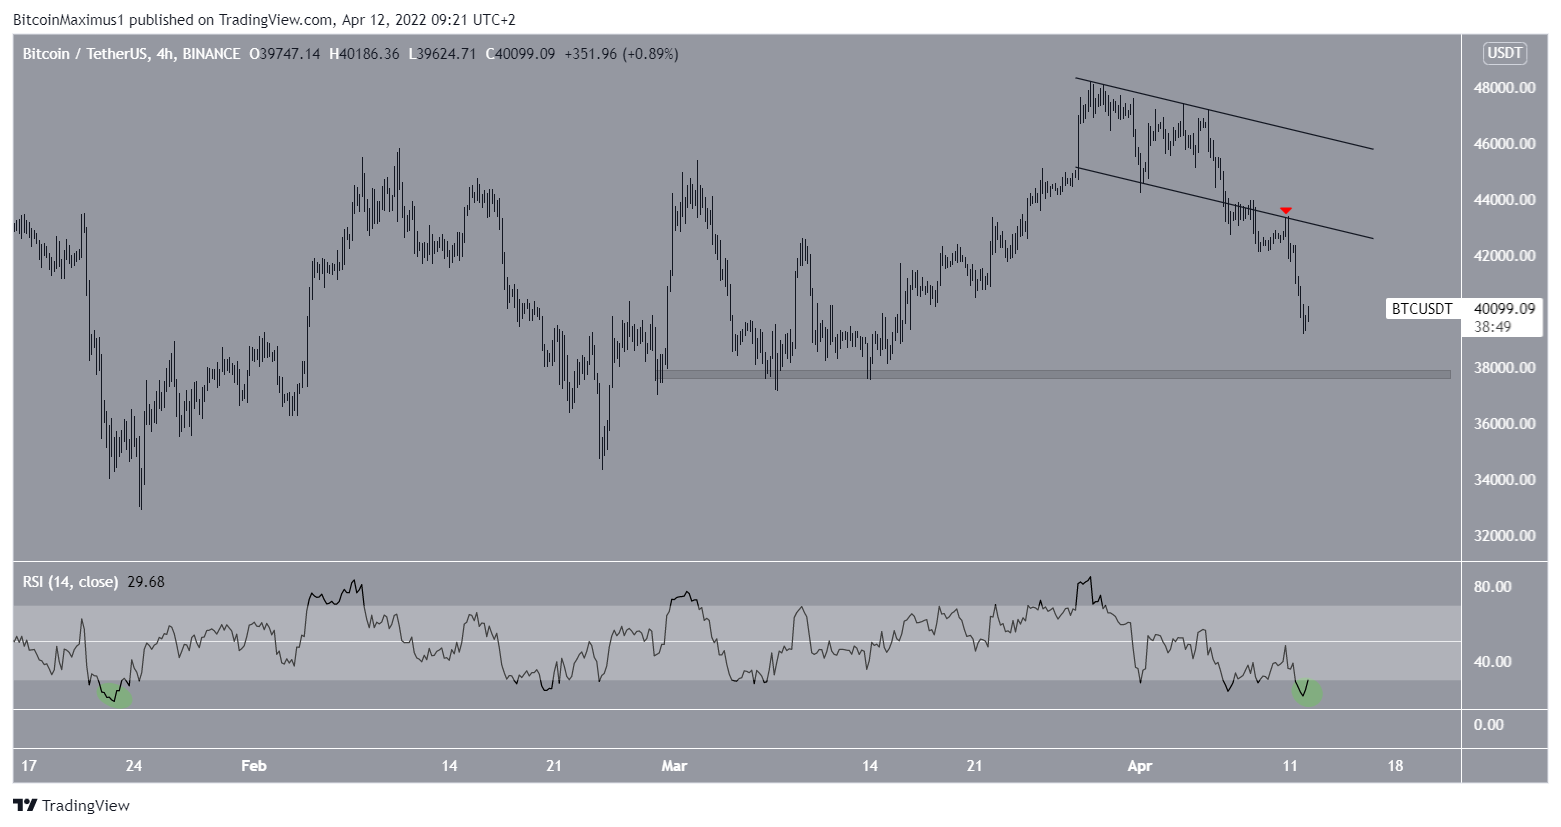
The four-hour time frame shows that BTC has broken down from a descending parallel channel and validated it as resistance (red icon) after. this preceded the acceleration of the downward movement.
An interesting reading comes from the RSI, which currently has a value of 22. This is the lowest value reached since January (green circle) when the price made a local bottom.
Therefore, the short-term chart suggests that a bottom is close.
Wave count analysis
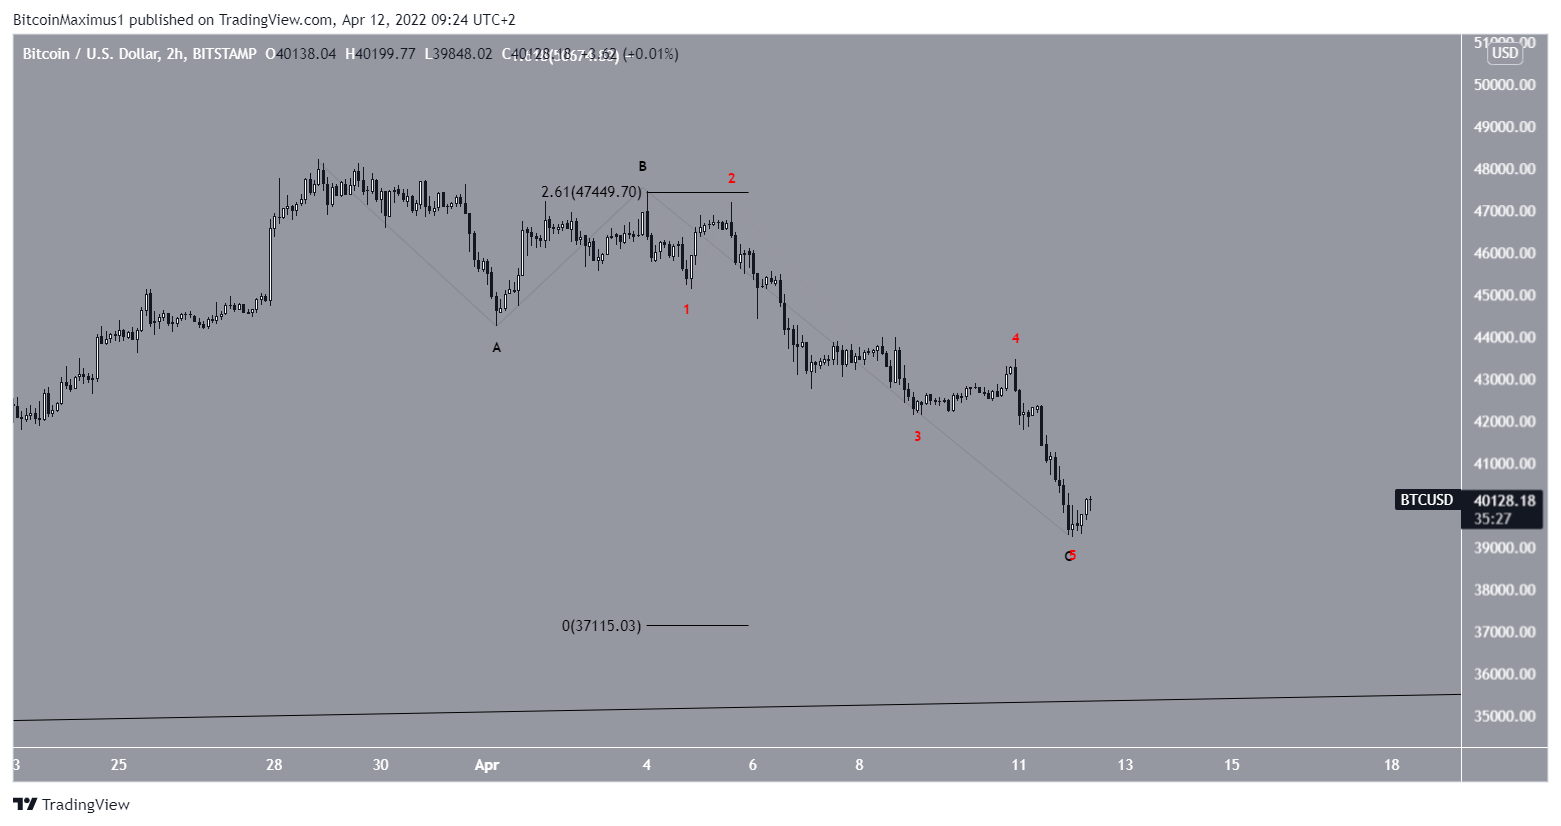
The long-term count suggests that an eventual relief rally towards at least $50,000 is likely. However, prior to it, it’s possible that BTC will make another low.
The decrease since March 28 seems to be an A-B-C corrective structure (black), in which waves A and C already have more than a 1:1.61 ratio. The next common ratio is 1:2.61, which would lead to a low of $37,100.
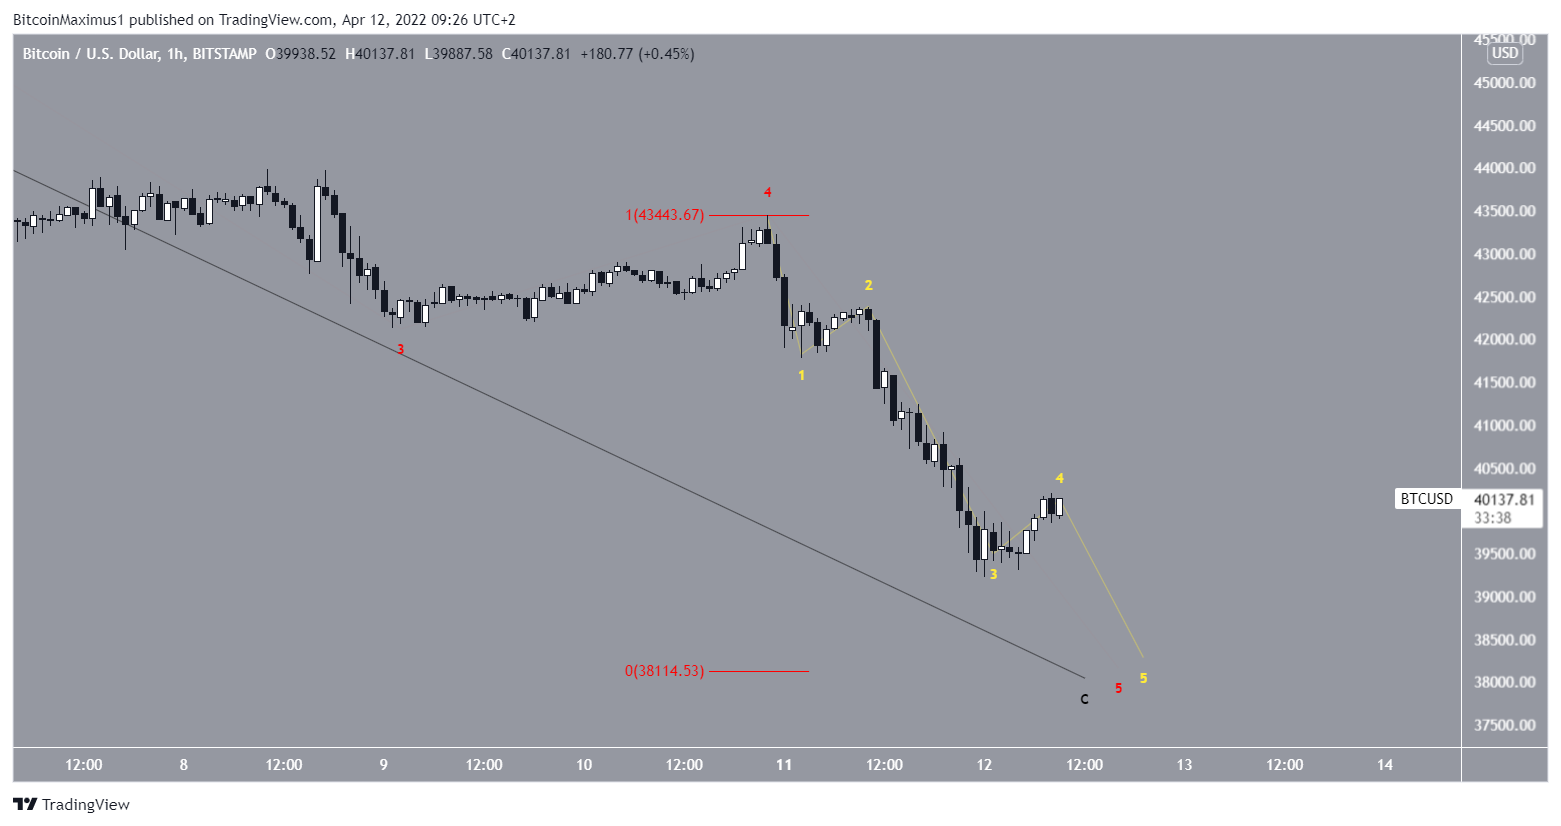
The sub-wave count is shown in red.
A look at the one-hour chart suggests that sub-wave five is coming to an end, potentially after another short-term drop.
This gives a potential target of $38,000 before a major reversal.
In any case, it seems that a bottom is extremely close.
For BeInCrypto’s previous Bitcoin (BTC) analysis, click here


