


Bitcoin (BTC) has potentially completed its corrective structure after rebounding on Nov 19. It’s imperative that the $56,500 support area holds for this to be true.
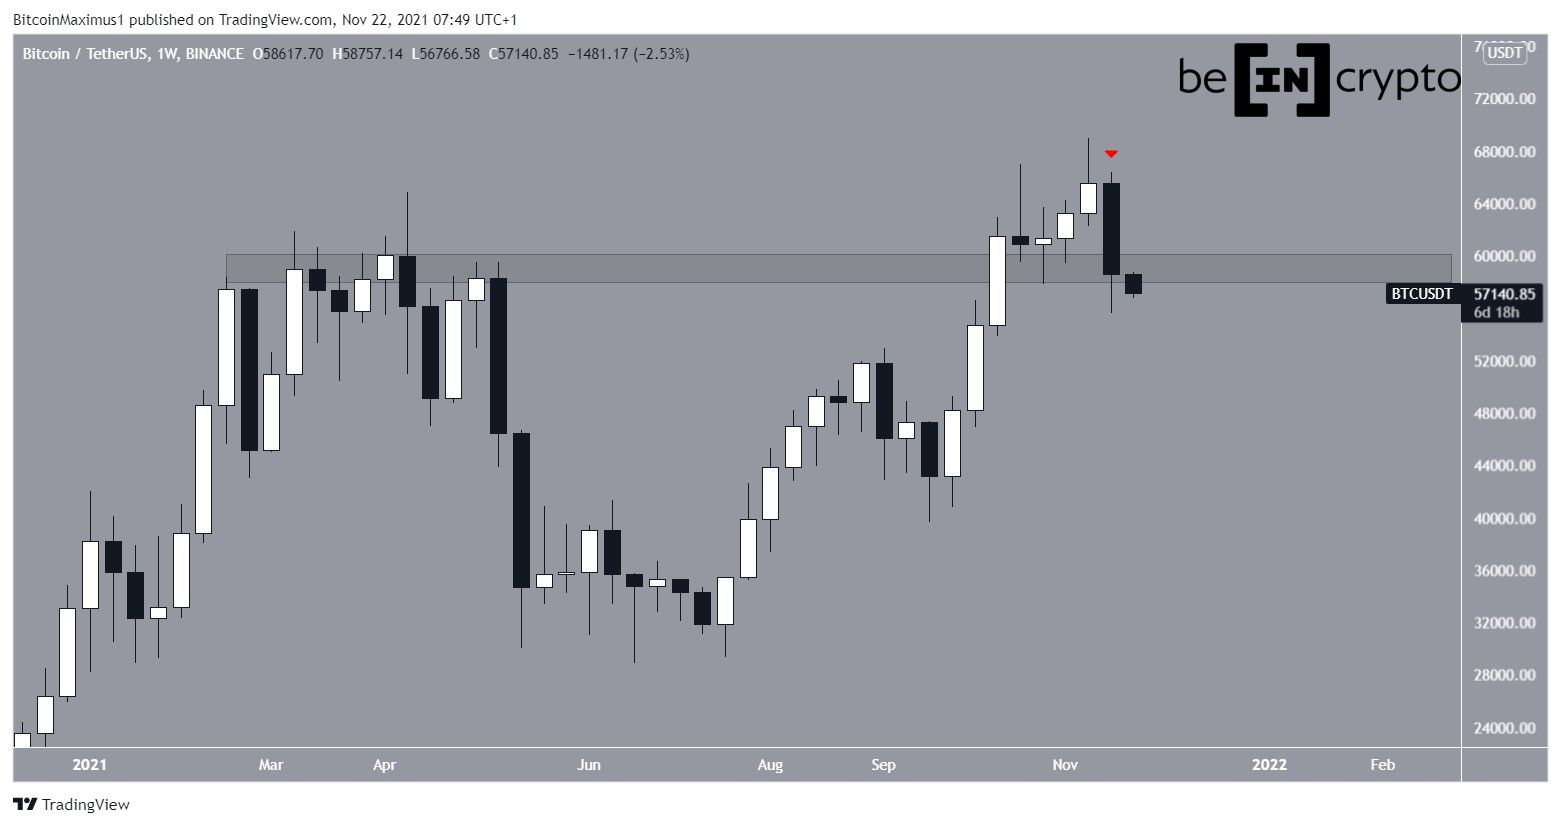
BTC decreased considerably during the week of Nov 15- 21 and created a bearish engulfing candlestick. This is a type of bearish candlestick in which the entire previous week’s increase is negated by the next drop.
Despite the ongoing increase, BTC is still trading just below the long-term $59,000 support area and is currently trading at $57,500. The same area previously acted as the all-time high resistance between February and April and is now expected to act as support.
Short-term movement
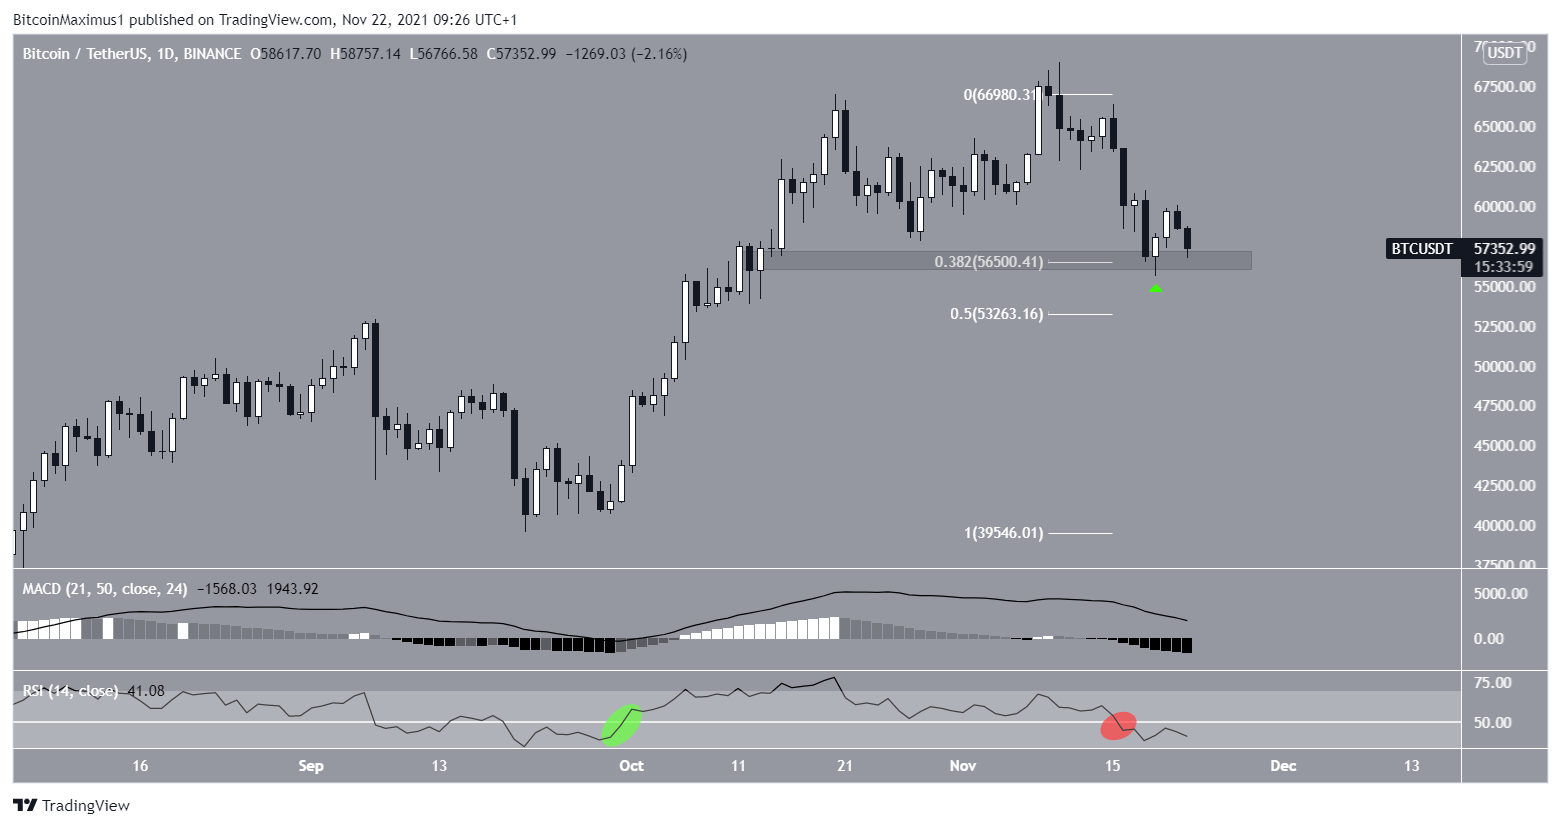
The daily chart shows that BTC is trading above horizontal support at $56,500. This is the 0.382 Fib retracement support level (white) when measuring the recent portion of the upward move.
On Nov 19, BTC bounced at this support area (green icon) and is currently retesting it.
Despite the short-term rebound, technical indicators are still bearish, since the MACD and RSI are both decreasing.
The drop is especially concerning in the RSI, which has fallen below 50 (red circle). The RSI is a momentum indicator, and the 50-line is often considered a benchmark for whether the trend is bullish or bearish. The RSI previously moved above 50 on Sept 29 (green circle), during the beginning of the rebound rally. Reclaiming the 50-line is mandatory in order for the upward trend to resume.
If a breakdown were to occur, the next support would be found at $53,250. This is the 0.5 Fib retracement support level.
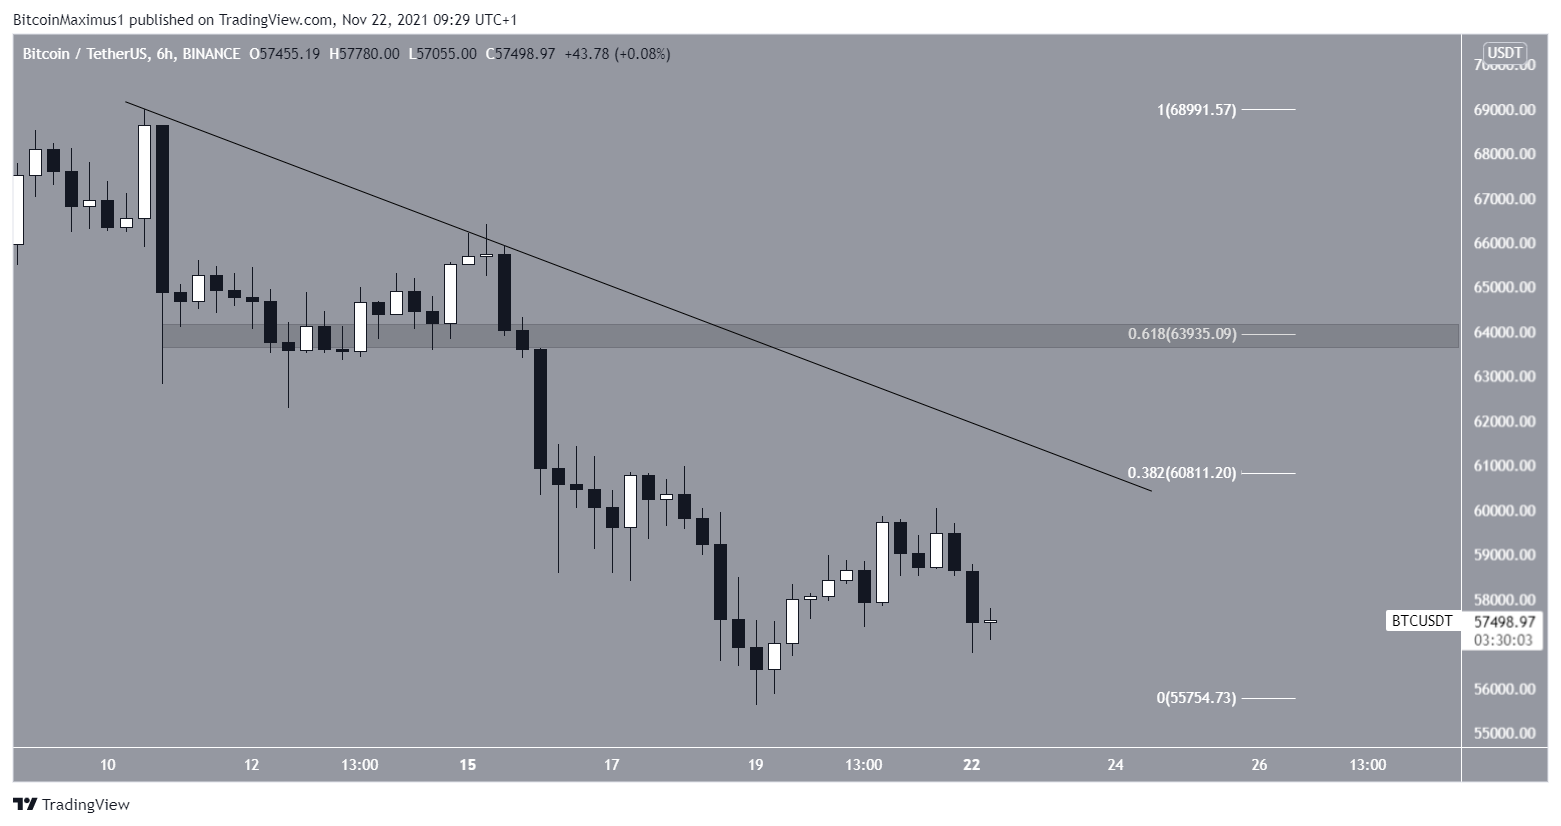
The six-hour chart shows that BTC is moving beneath a descending resistance line.
BTC wave count
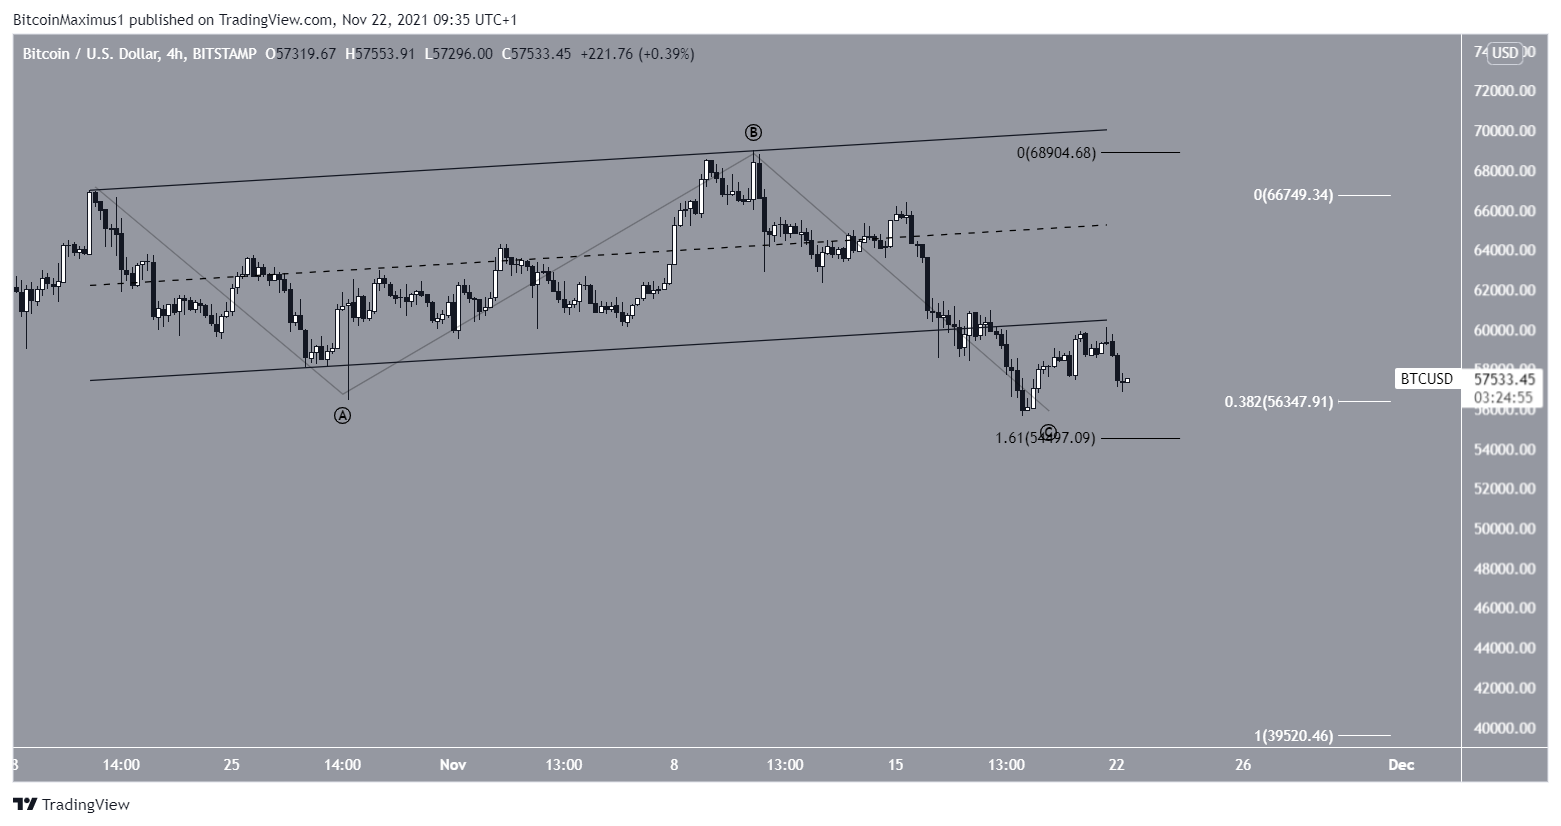
The BTC wave count suggests that the entire movement since Oct 20 is part of an A-B-C corrective structure. Wave C had a 1:1.61 ratio relative to wave A, which is common in such structures.
Therefore, it’s possible that the low has been reached and the BTC correction is complete.
The long-term wave count is decisively bullish and shows that BTC is inside a large 1-2/1-2 wave formation.
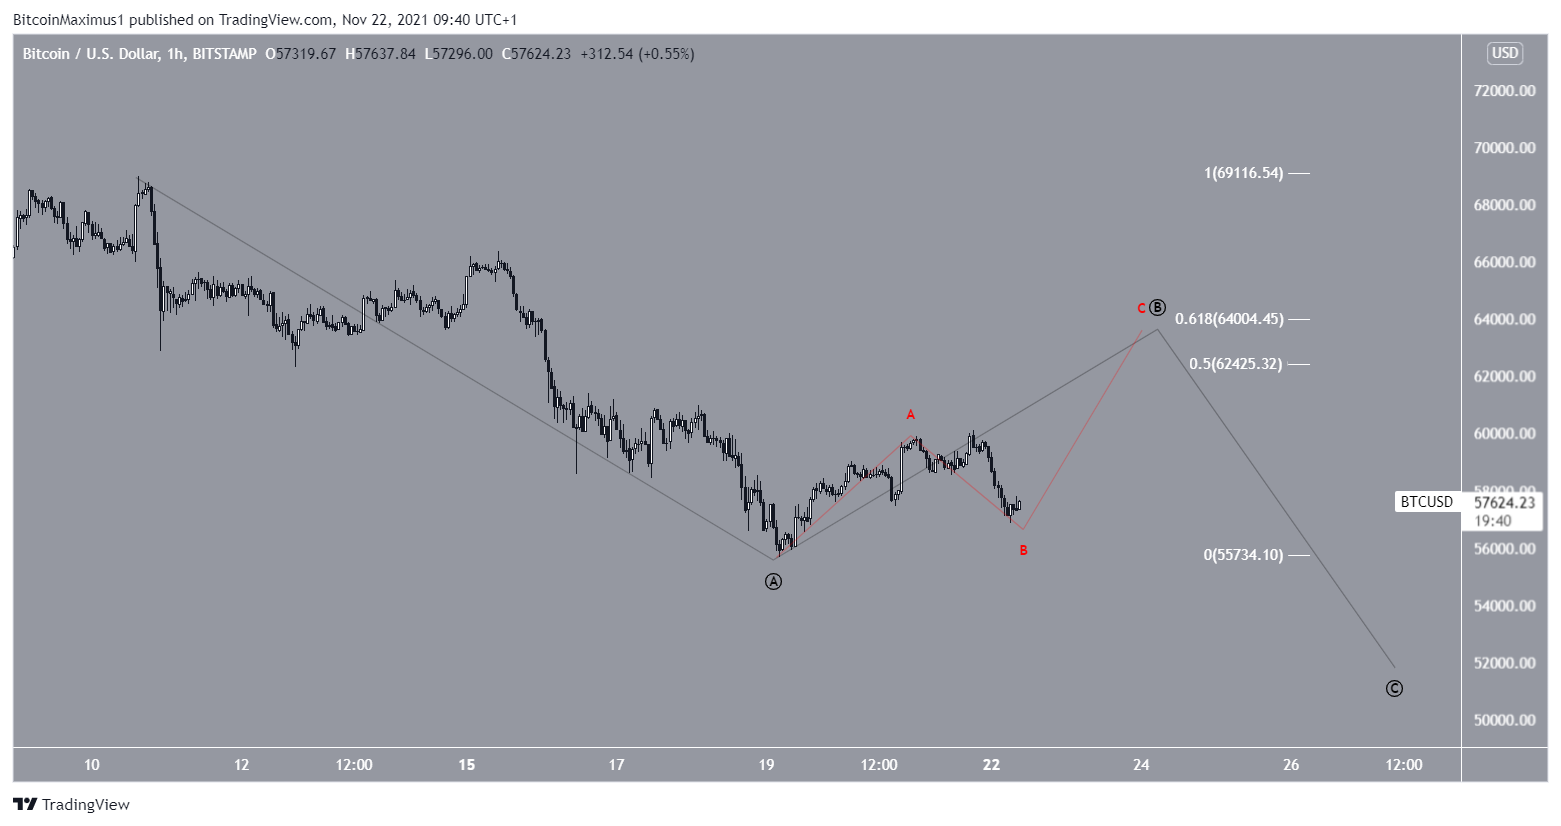
The alternate short-term count is slightly more bearish since it suggests that the November decrease was wave A of an A-B-C structure.
However, this could mean that an upward move towards the $62,400-$64,000 range still happens before another drop. The sub-wave count is shown in red
For BeInCrypto’s previous Bitcoin (BTC) analysis, click here.


