


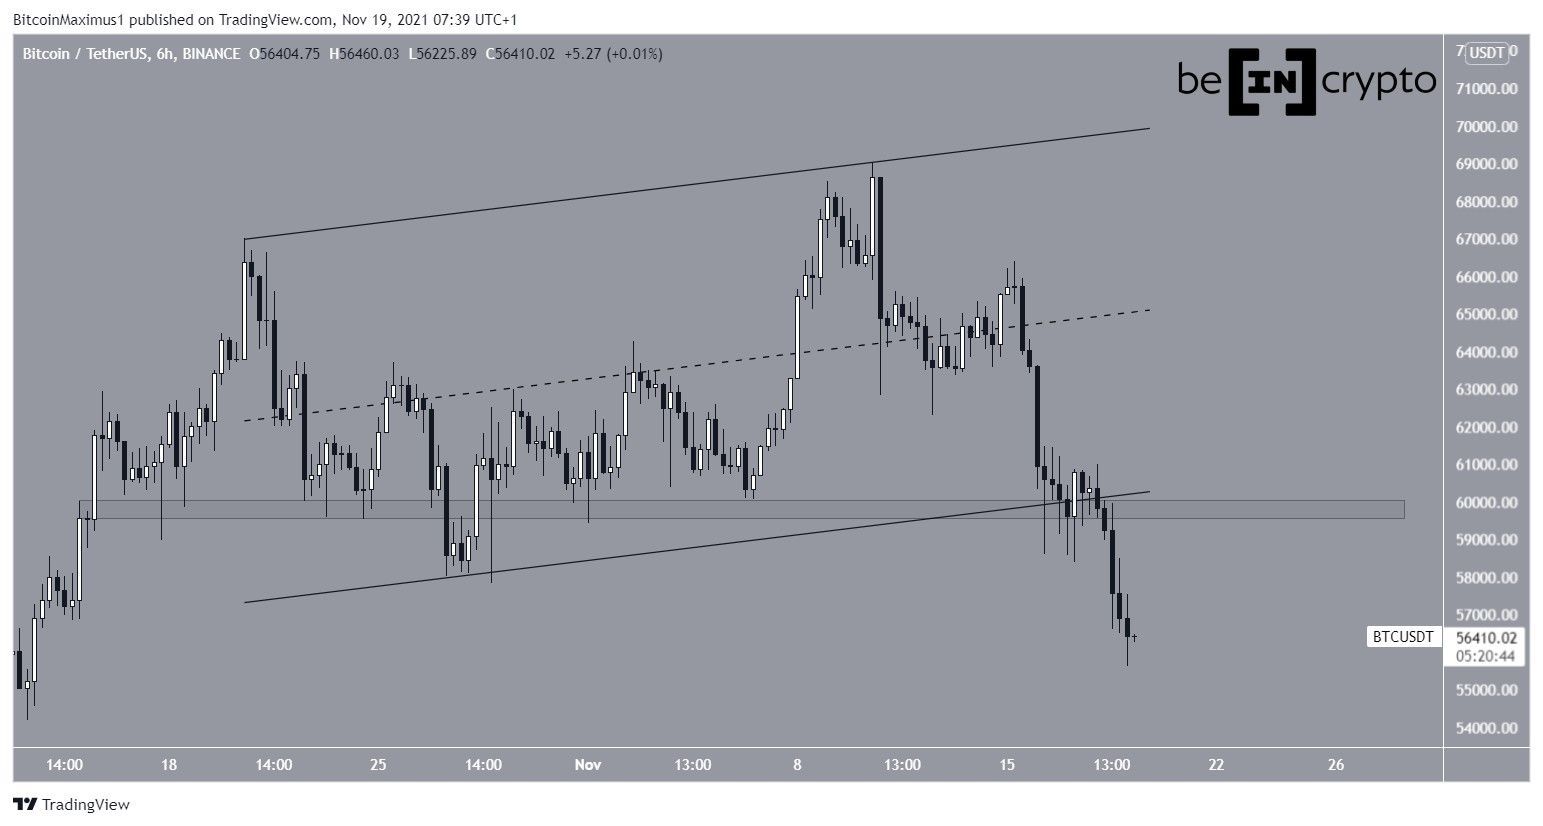
Bitcoin (BTC) decreased considerably on Nov 18 and reached a low of $55,600. However, it is likely nearing the end of its correction.
BTC has been moving downwards since reaching an all-time high price of $69,000 on Nov 10. On Nov 17, it bounced at the support line of the channel and the $59,700 horizontal support area.
However, the bounce was short-lived and BTC broke down from both the channel and the support area on Nov 18. This led to a low of $55,600 the next day.
Has BTC reached a bottom?
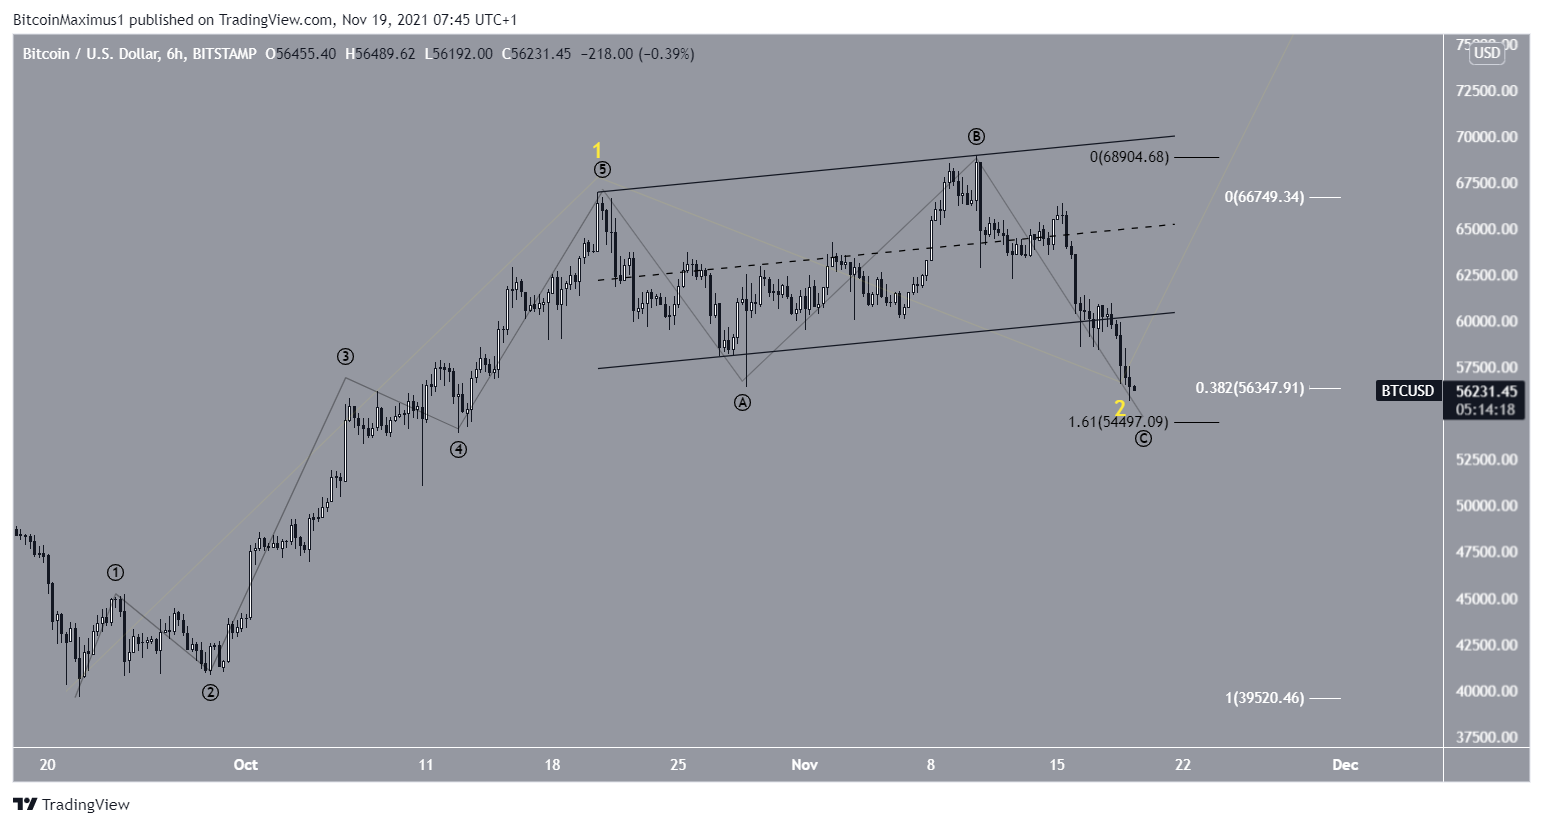
A look at the wave count and Fib levels suggests that a bottom is close.
BTC seems to be in the C portion of an A-B-C corrective structure (black). This is the final portion of the correction, after which an upward movement is likely.
More interestingly, there is very strong support near $54,500 – $56,300. This is the 0.382 Fib retracement support level (white), and would give waves A:C a 1:1.61 ratio. The latter is extremely important, since waves A:C often have either a 1:1 or a 1:1.61 ratio. Since the 1:1 ratio did not hold, the 1:1.61 is the most likely one.
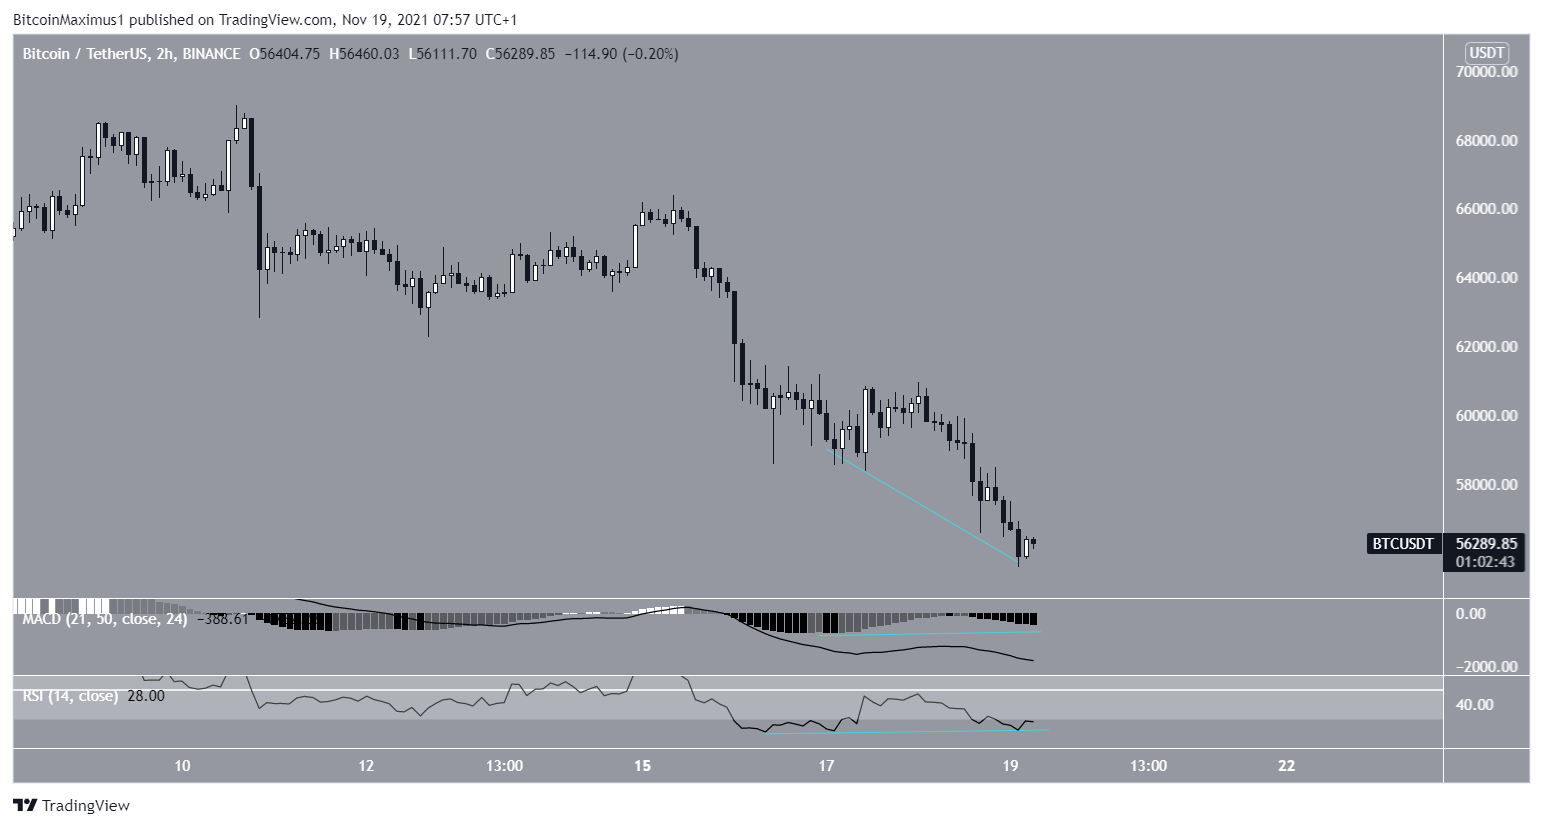
This possibility is supported by a look at the MACD and RSI. Both have generated bullish divergence. This is an occurrence in which a price decrease is not accompanied by the same decrease in technical indicators. It often precedes trend reversals.
Long-term count
The long-term wave count still suggests that the entire movement since July is a massive 1-2/1-2 bullish formation. This means that the rate of increase is expected to accelerate once BTC completes the ongoing correction.
Currently, BTC is in sub-wave two (yellow) of wave two (white). Afterwards, sub-wave three of wave three is usually the sharpest of the entire upward waves. This would be expected to take the price well into a new all-time high.

For BeInCrypto’s previous Bitcoin (BTC) analysis, click here.


