


The Bitcoin (BTC) price shows several bullish signs in long-term time frames. However, the direction of the short-term trend is still unclear.
Federal Reserve data shows that United States bank deposits decreased considerably between March 8 and 15, due to fears of a banking collapse. At the same time, the number of investors that hold Bitcoin (BTC) increased. As noted by Matrixport’s head of research and strategy, “Americans are buying Bitcoin with both hands”. However, Bitcoin net exchange inflows hit a 10-month-high. Similar periods of high inflows have previously preceded sharp decreases.
Bitcoin (BTC) Price Approaches Range High
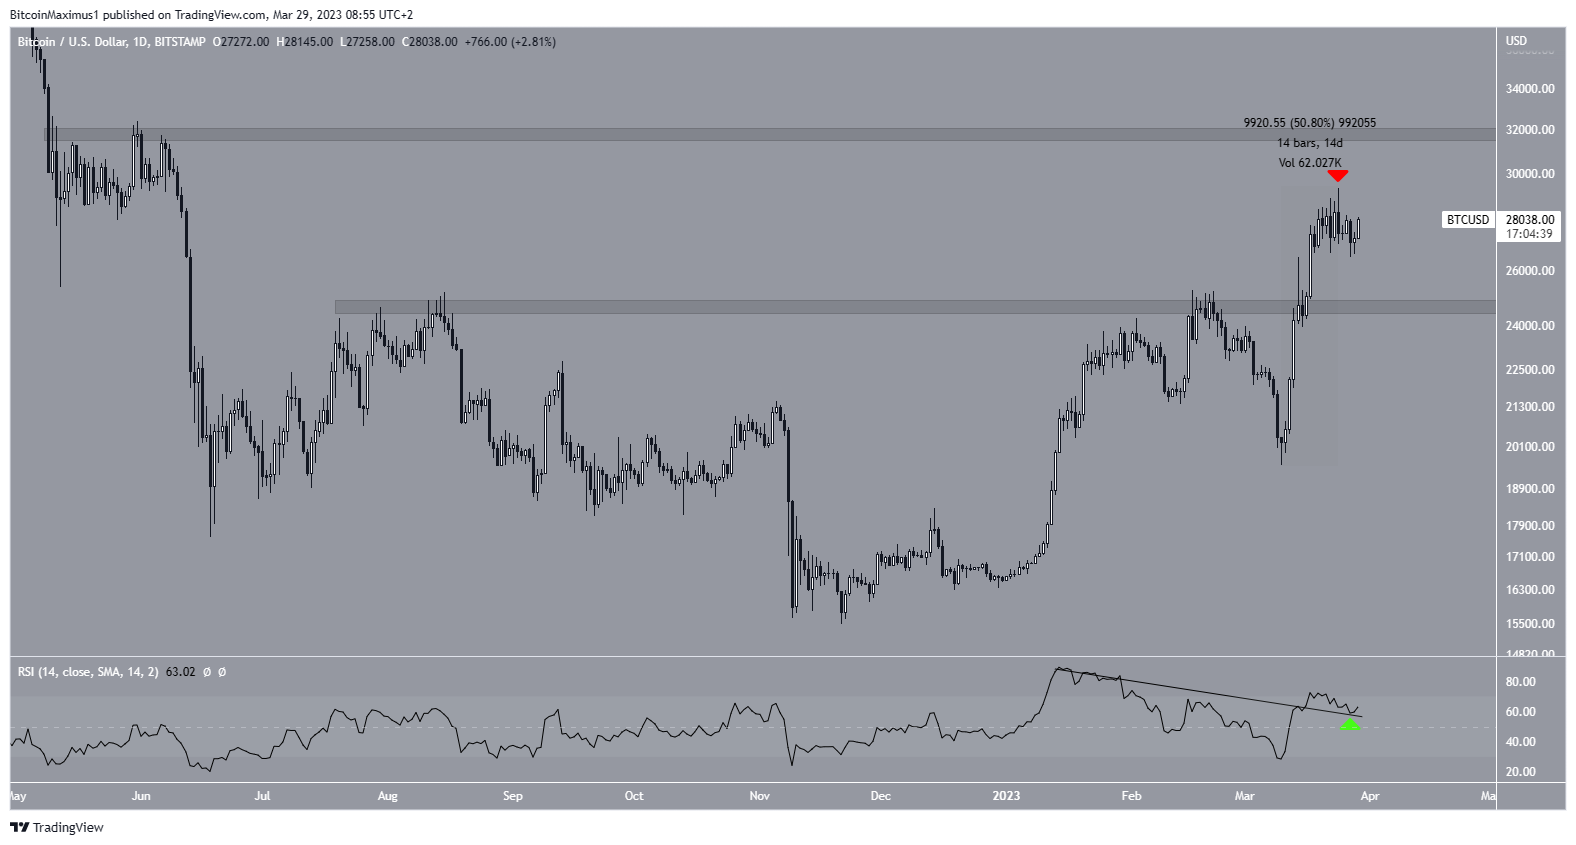
The Bitcoin price has increased rapidly since March 10. In a span of 14 days, it increased by nearly 50%, reaching a new yearly high of $29,380. However, the price created a bearish candlestick and has fallen slightly since (red icon).
Despite the rally stalling, the daily RSI reading is bullish. The indicator broke out from its bearish divergence trend line (black) and is now above 50.
The Bitcoin price is trading between $24,400 and $31,800. Since the RSI reading is bullish, an eventual increase to $31,800 is the most likely scenario.
Short-Term Drop or Continuation?
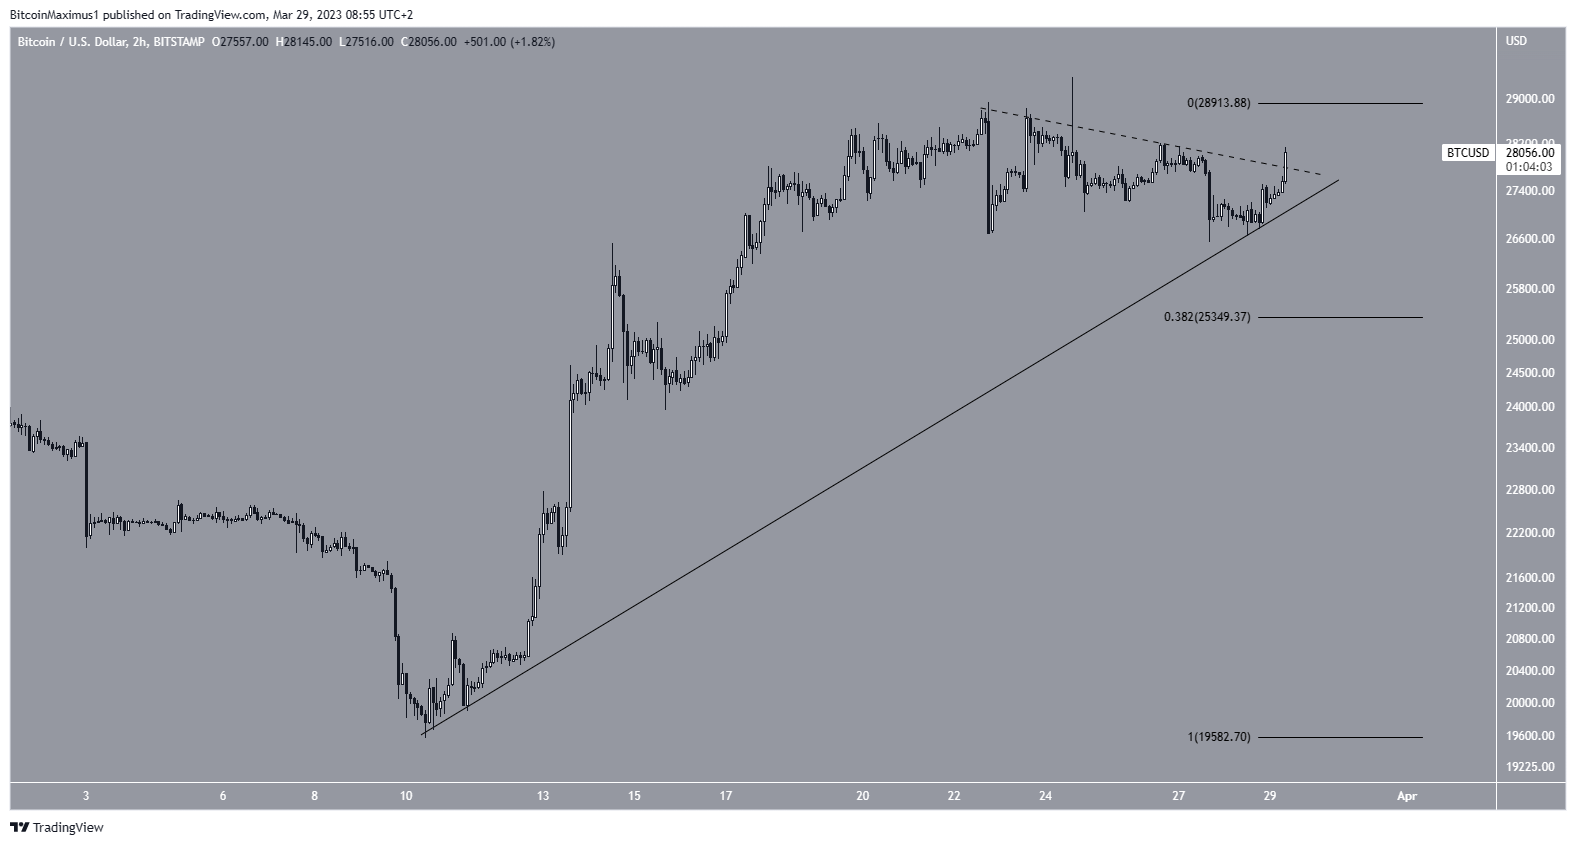
The technical analysis from the six-hour time frame shows that the BTC price bounced at an ascending support line which determined its slope in the rapid portion of the increase. Then, the price broke out from a short-term descending resistance line.
If the increase continues, the price could move to the range high at $31,800.
However, a breakdown would likely lead to a fall to $24,450, the 0.5 Fib retracement support level. Since this also coincides with the previously outlined horizontal support area, it is a very important level that could initiate a bounce.
Bitcoin (BTC) Weekly Outlook: Bullish Sentiment Increases
While there are some conflicting readings in the daily and six-hour time frames, the weekly Bitcoin price chart for BTC provides a bullish outlook. There are numerous reasons for this.
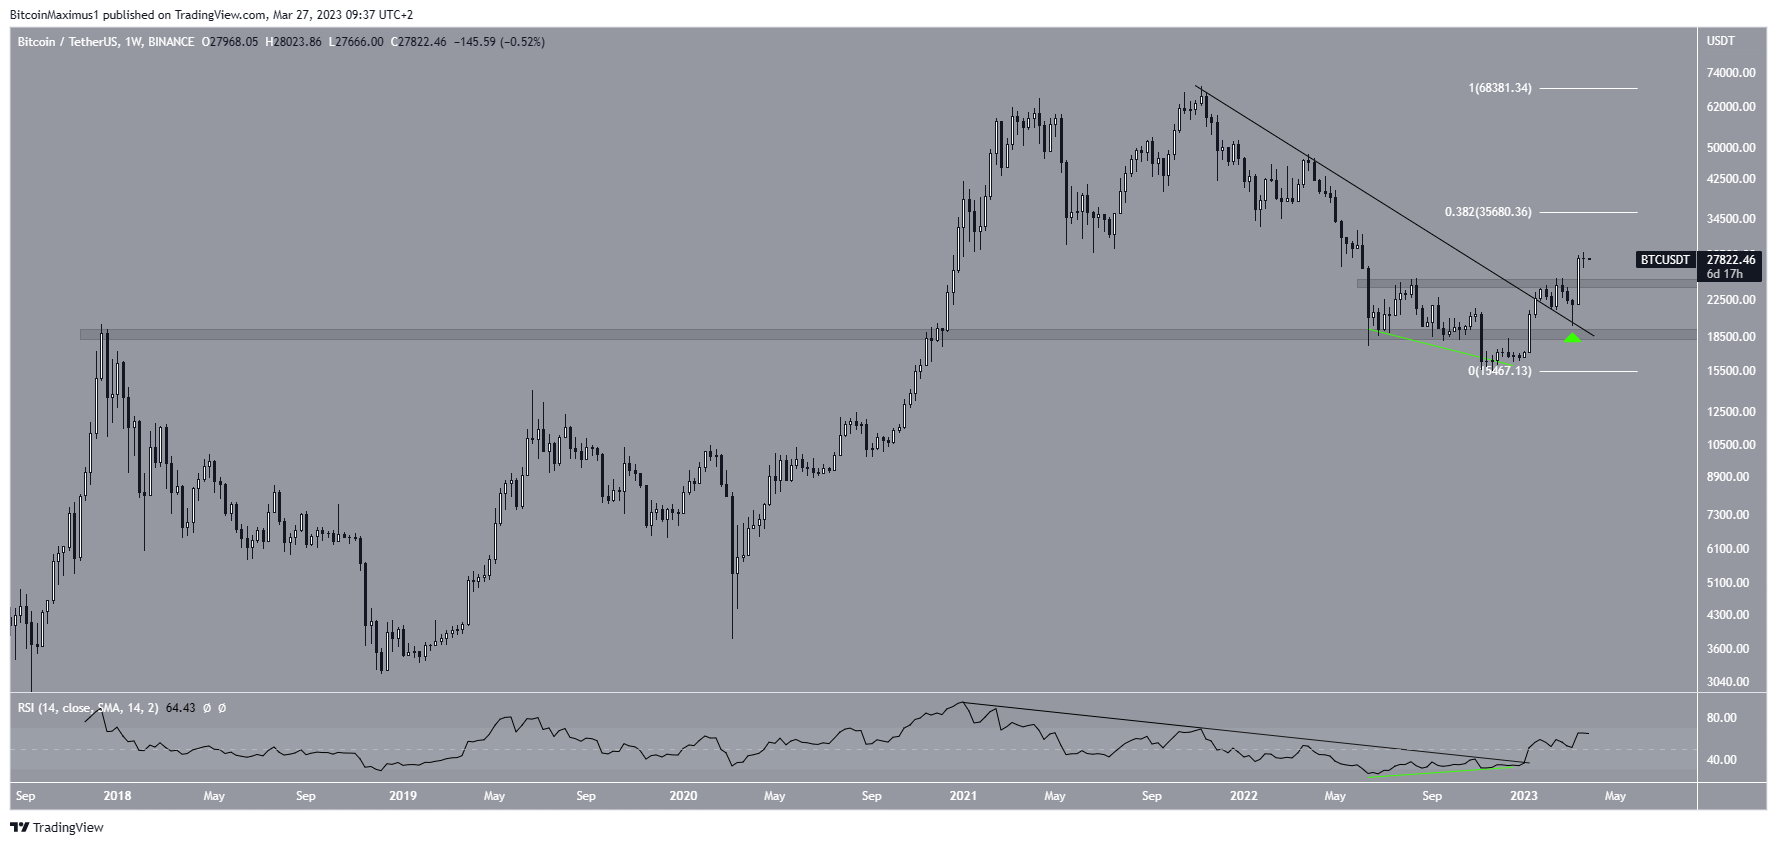
Firstly, the price broke out from a long-term descending resistance line that had existed since the all-time high. Then, it accelerated the rate of increase after validating it as support during the week of March 6-13 (green icon). Then, it broke out from the $24,700 horizontal resistance area, reaching the highest price since June 2022. The $24,700 area is now expected to provide support. The area nearly coincides with that mentioned in the daily time frame.
Besides the price action, the RSI reading is decisively bullish. The indicator broke out from a descending resistance line (black) after generating bullish divergence (green). Then, it moved above 50. All these are considered bullish signs.
If the increase continues, the next resistance would be at $35,680, created by the 0.382 Fib retracement resistance level. On the other hand, if the price closes below $24,700, it will invalidate the bullish forecast. In that case, a drop to $18,600 could follow.
To conclude, the most likely Bitcoin price forecast is an increase to the long-term $35,680 resistance area. This would only be invalidated with a weekly close below $24,700. In that case, a fall to $18,600 could follow.


