

Be[in]Crypto takes a look at on-chain indicators for bitcoin (BTC), more specifically the Stablecoin Supply Ratio (SSR), and the circulating USDT supply.
What is SSR?
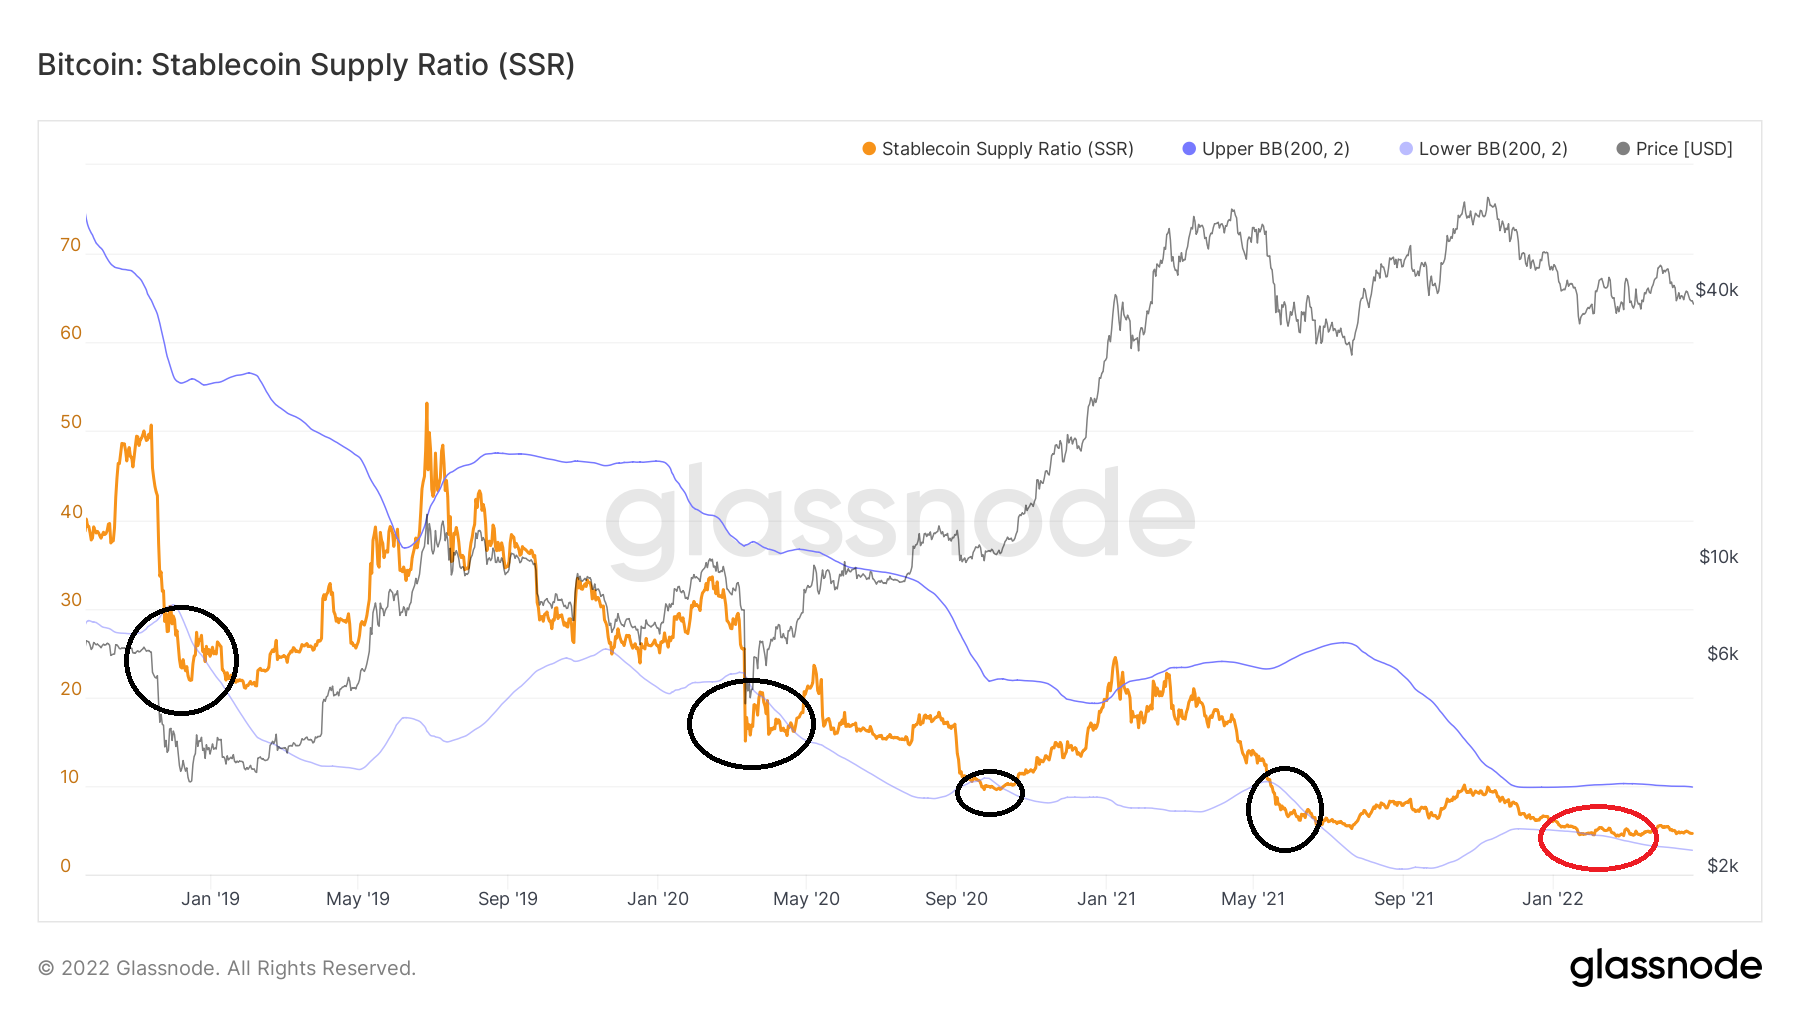
SSR is an on-chain indicator that is used in order to determine the ratio between the supply of stablecoins and that of bitcoin (BTC). The indicator moves when there is a change in either the supply of stablecoins or in the price of BTC.
Low SSR values show that a large percentage of the BTC supply can be purchased by using stablecoins. For example, a SSR value of 5 suggests that 20% (1/5) of the BTC supply can be bought by stablecoins.
Buying signal?
A buy signal has been given whenever SSR falls below the lower Bollinger band (black circle). This suggests that the indicator has decreased significantly more than it usually does.
Until now, there have been five such deviations. Four of them (black circle) led to considerable upward movements.
So far, it has deviated four times. Each of them have been followed by a very considerable upward movement.
On Jan 22, SSR reached a new all-time low value of 4.40, falling below the lower Bollinger Band (red circle). It bounced afterwards, alongside the BTC price, which increased to $46,000. Now, SSR is inside the bands, being closer to the lower one.
If this was the entire increase as a result of the SSR reading, it would be the weakest increase so far. SSR also suggests that an altseason is likely, something which has yet to occur.
USDT stablecoin balance
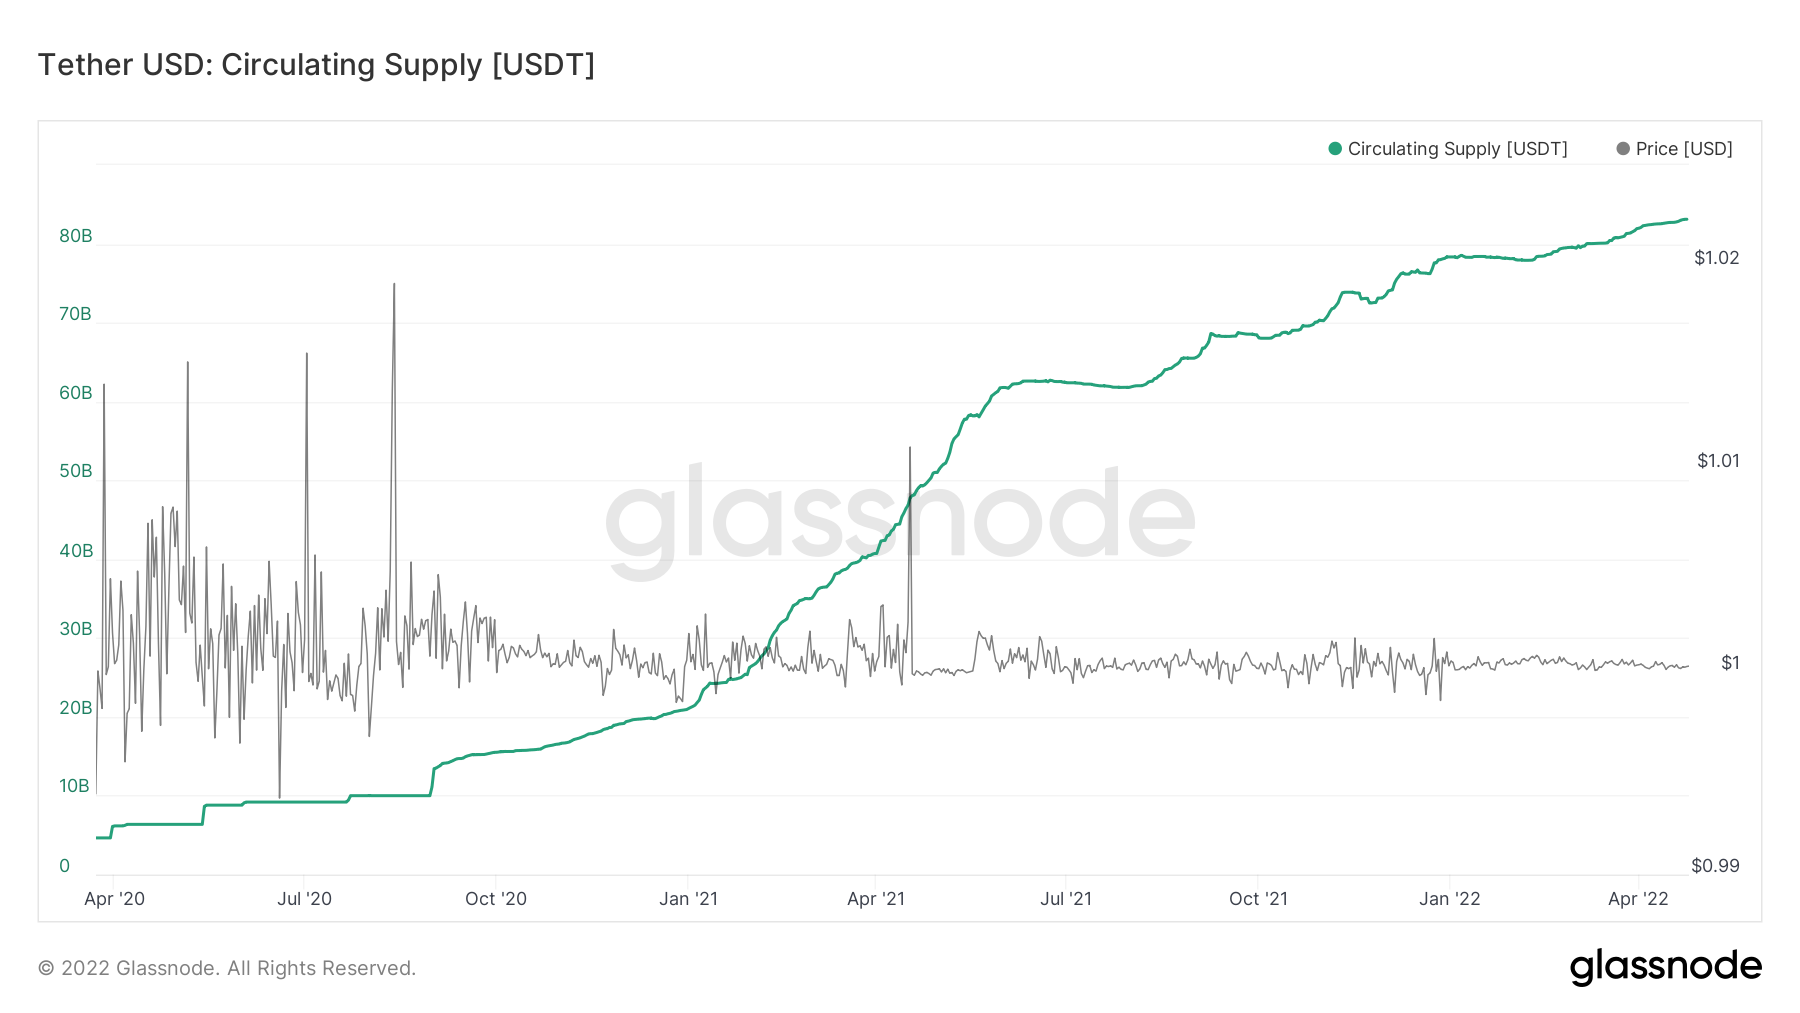
The circulating supply of USDT (green) has been increasing at an accelerated rate since March 2020. While the increase slowed down in Jan 2022, the circulating supply is still growing. In April, it reached a new all-time high of 83 billion.
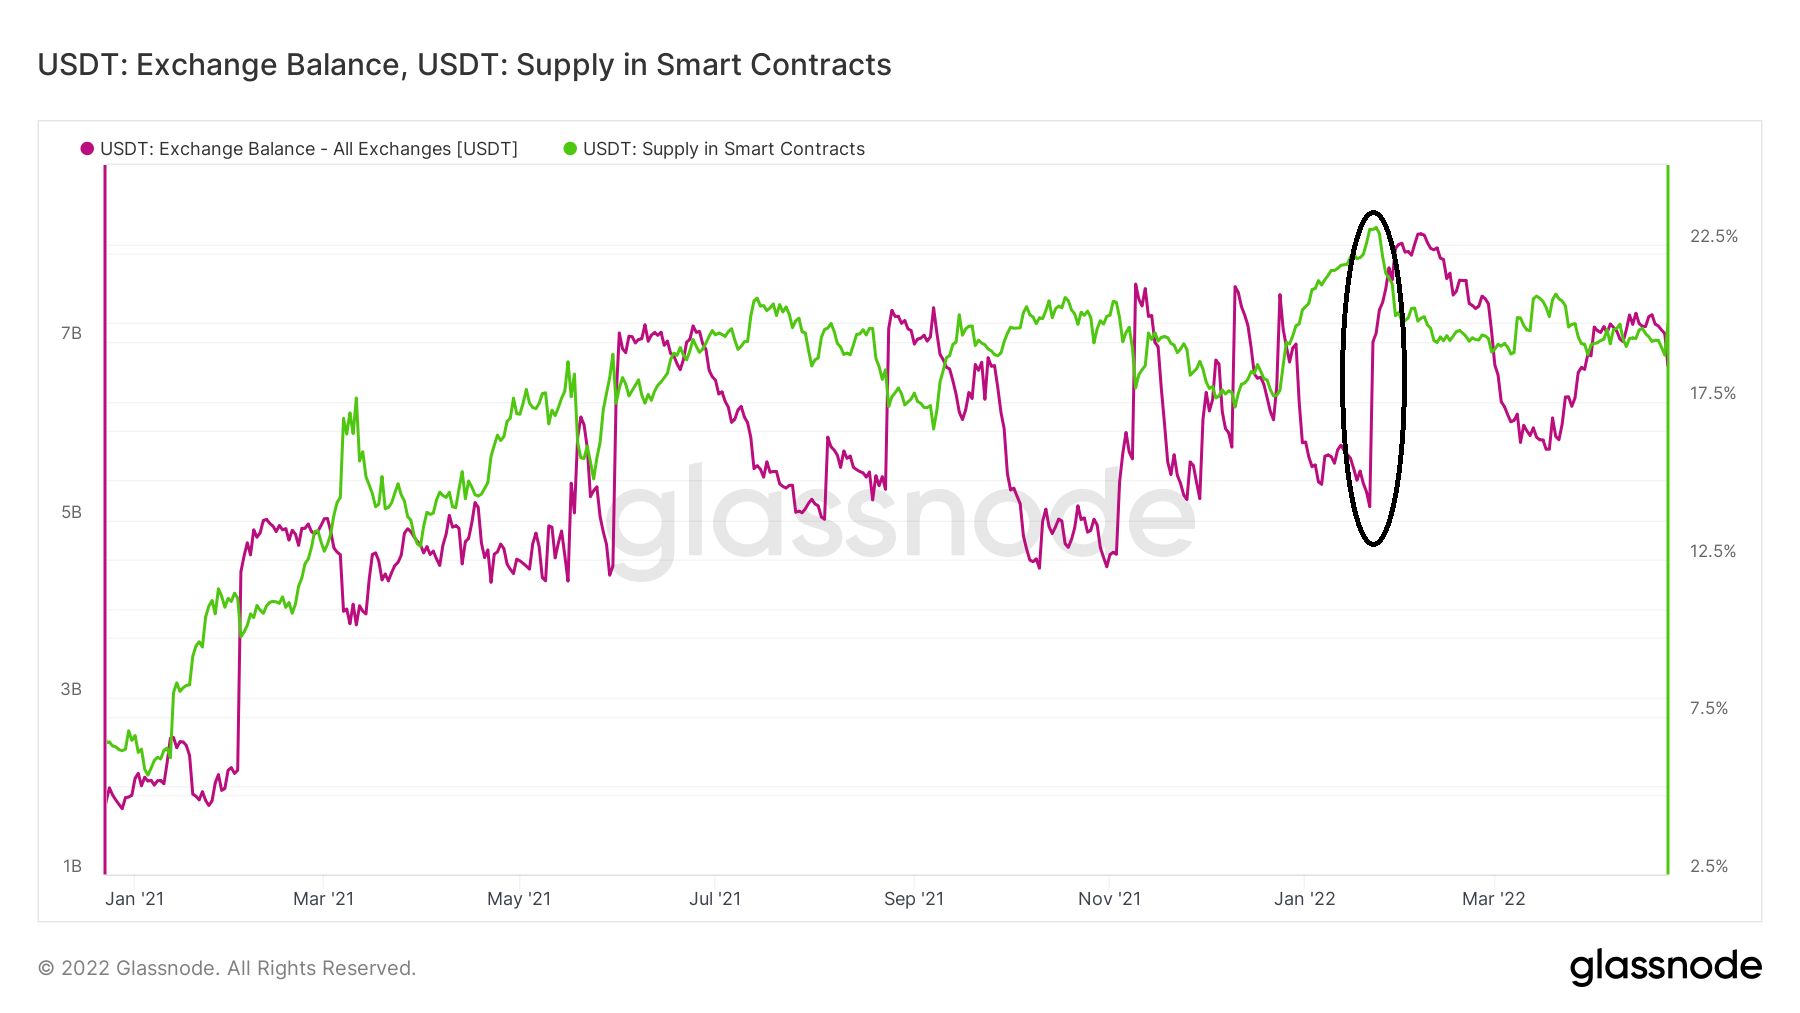
An interesting observation is the fact that since Jan 2022 (black circle), the USDT balance on exchanges has increased, while the supply locked into smart contracts (green) has fallen.
The fact that the USDT held in exchange balances is increasing could mean that investors are preparing to ”buy the dip.”
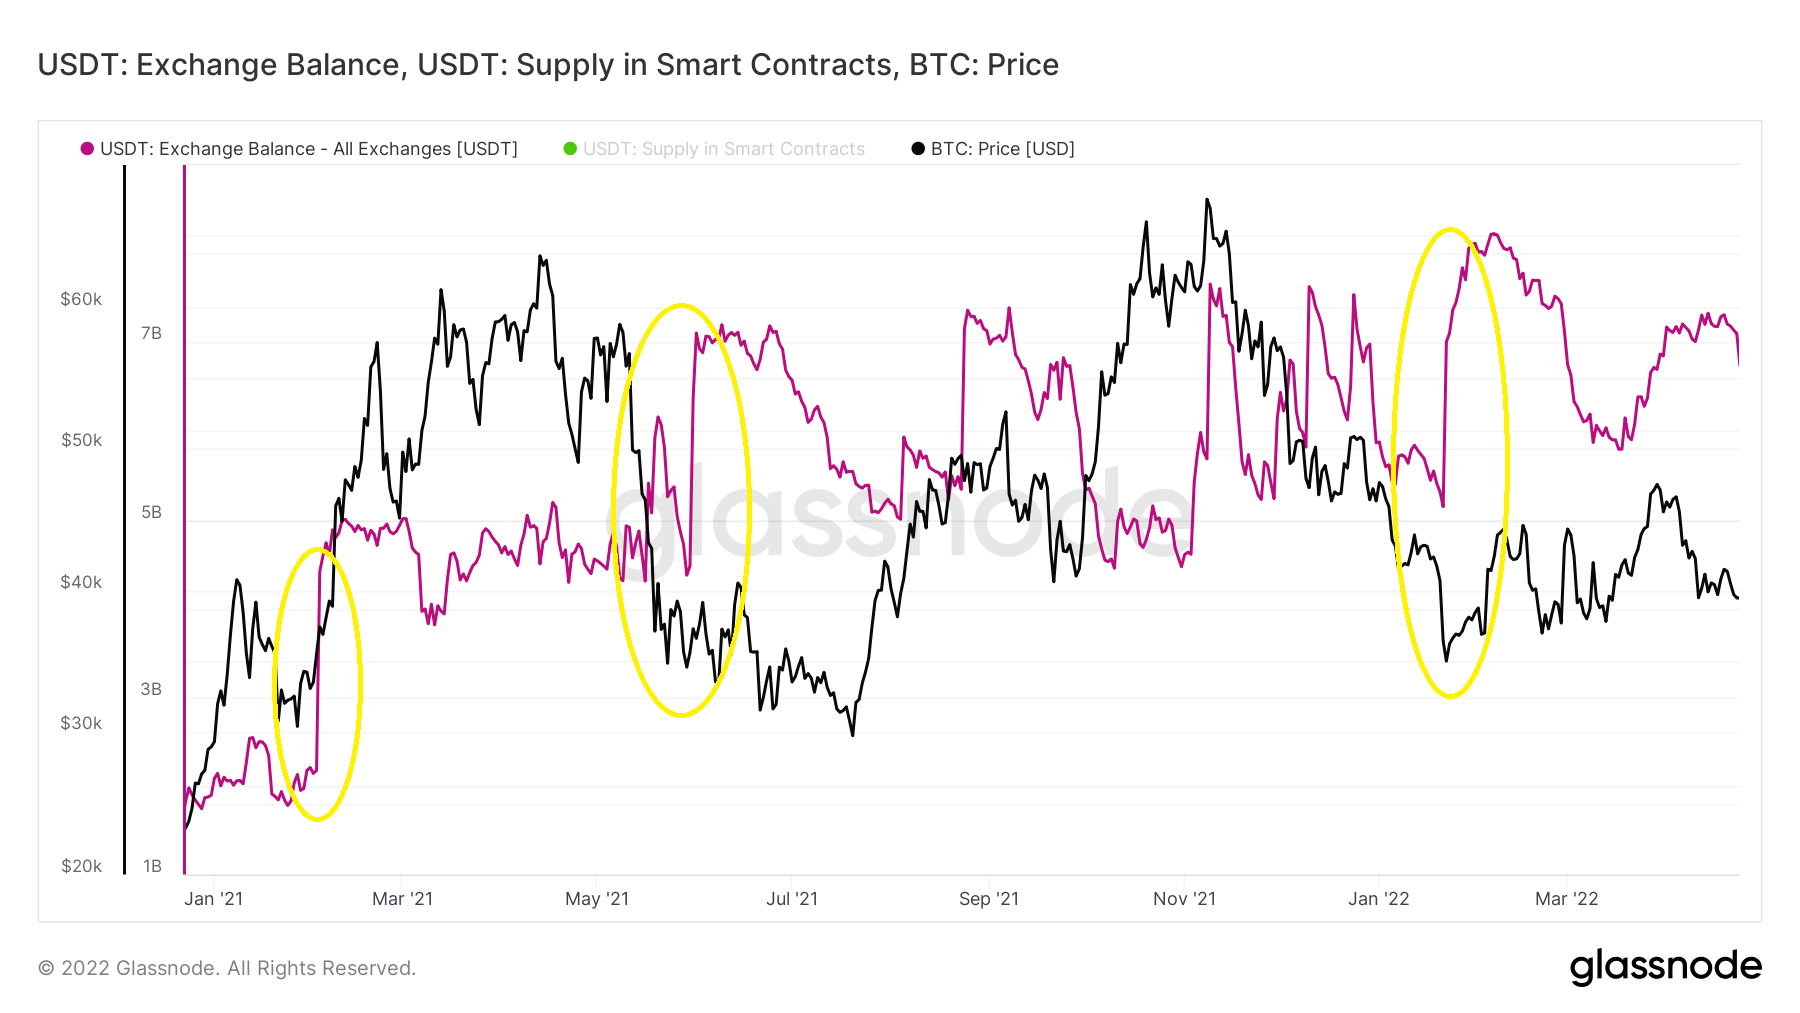
When looking at the stablecoin exchange balance and the BTC price (black), it is visible that sharp increases in the USDT in exchange balances usually precede a price increase.
This was visible in both Feb and May 2021 (yellow circles). However, the sharp increase of Jan 2022 has yet to lead to a significant price increase.
Having said that, is possible that a delayed price increase will occur, similar to what occurred in May. 2021. Several models also suggest that the current BTC price is undervalued. Furthermore, interest in the network seems to be at an all-time high.
For BeInCrypto’s latest Bitcoin (BTC) analysis, click here.
Disclaimer
In line with the Trust Project guidelines, this price analysis article is for informational purposes only and should not be considered financial or investment advice. BeInCrypto is committed to accurate, unbiased reporting, but market conditions are subject to change without notice. Always conduct your own research and consult with a professional before making any financial decisions. Please note that our Terms and Conditions, Privacy Policy, and Disclaimers have been updated.
