

We look at on-chain indicators for Bitcoin (BTC), more specifically the Net Realized Profit/Loss (NUPL) indicator. This is done in order to determine if BTC has initiated a bullish reversal or if the bottom has yet to be reached.
NUPL is an on-chain indicator that shows if the market is in a state of aggregate profit or loss. In order to create it, unrealized losses are subtracted from unrealized profits.
If unrealized losses are higher than unrealized profits, the indicator is negative, in turn meaning that the market is in a state of loss. The opposite is true when unrealized profits are higher than unrealized losses.
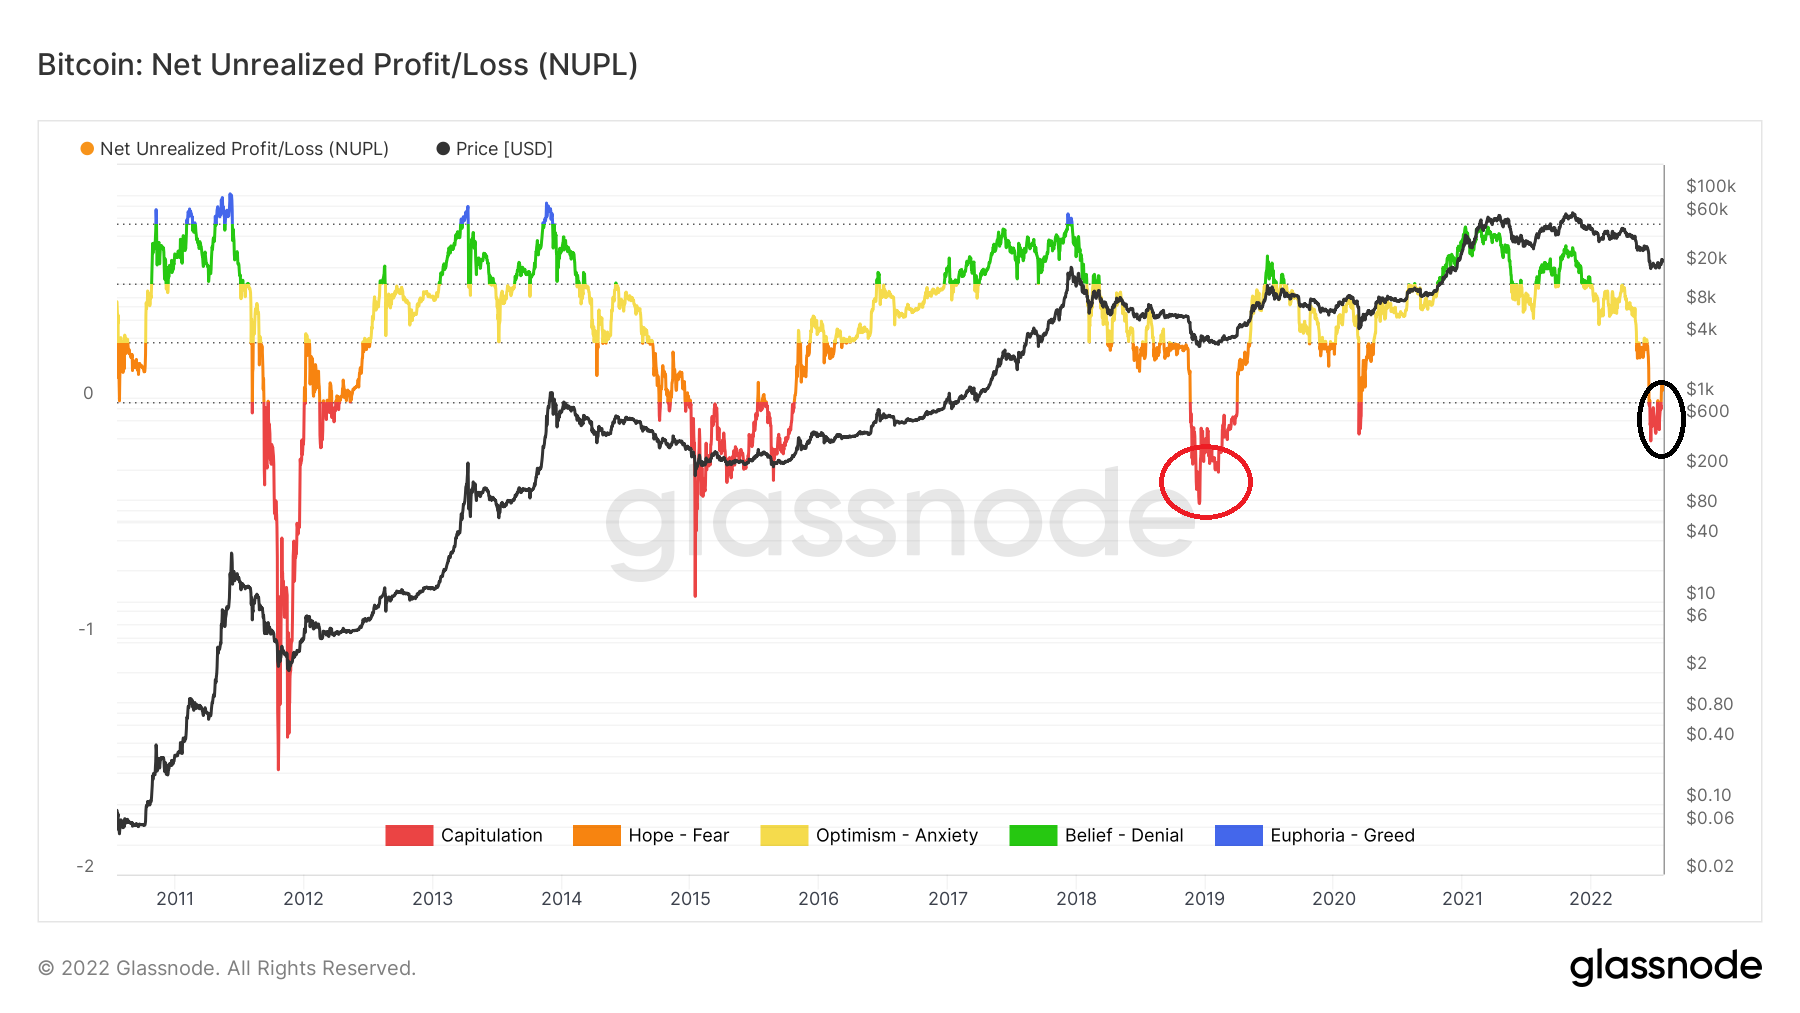
Historically, market cycle tops have been reached above or close to 0.75 (blue), while bottoms have been reached below 0 (red).
BTC NUPL turns negative
On June 13, NUPL became negative (black circle) for the first time since March 2020. It proceeded to reach a low of -0.16 on June 18. This was lower than the March 2020 bottom, and the lowest value since the Dec 2018 bottom at -0.42 (black circle).
A reading of -0.16 means that unrealized losses are higher than unrealized profits by 16% of the market cap.
Historical readings
The two previous absolute market cycle bottoms were reached at -0.56 and -0.36, respectively. So, the current low is considerably higher than both of them, and is more similar to the March 2020 low.
Additionally, the 2015 bottom was reached 19 days after the NUPL crossed into negative territory, while the 2018 one was reached 24 after such a cross. The current bottom was reached only five days after NUPL crossed into negative territory. As a result, it is much more similar to the March 2020 local bottom.
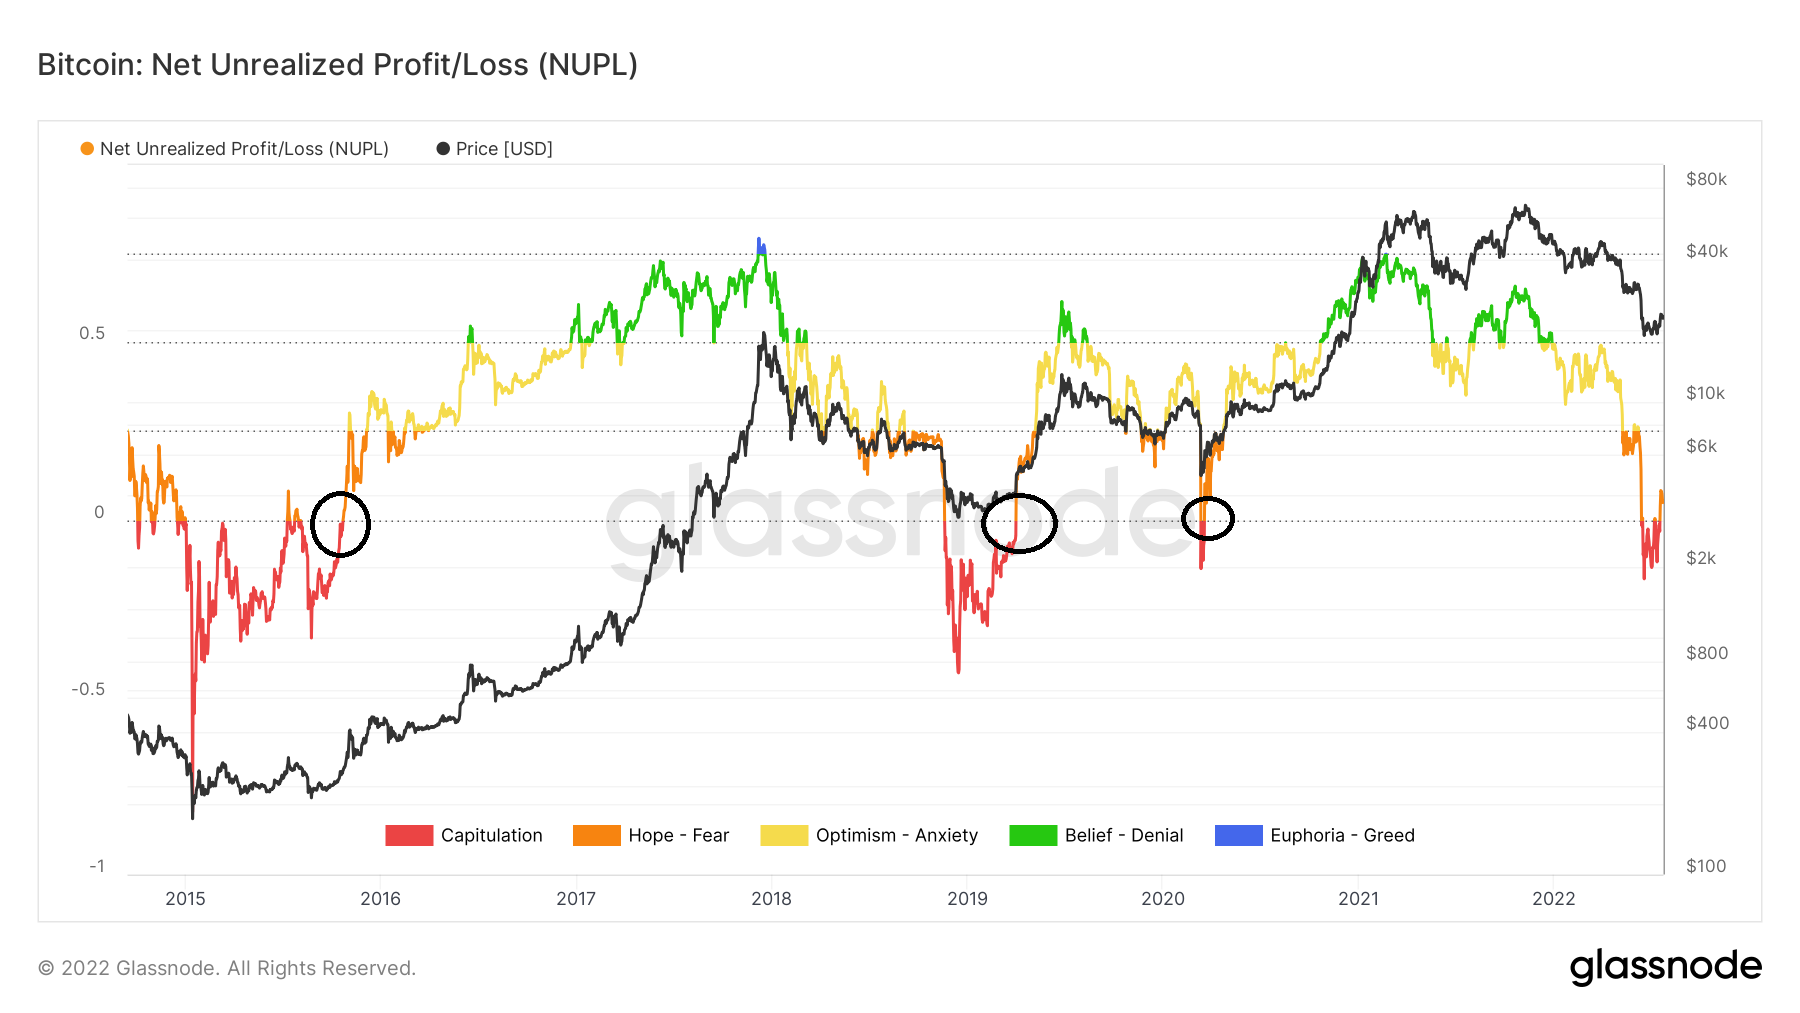
Another way to look at the indicator is to analyze what occurred after NUPL moved back into positive territory after previously being negative. This would be a sign that the market is back on track after a capitulation event.
In 2015, such a cross occurred in Oct, well after a bottom was reached. The same thing occurred in the 2018 and 2020 bottoms (black circles).
Therefore, by looking at it this way, it is possible that BTC has already bottomed.
For Be[in]Crypto’s latest Bitcoin (BTC) analysis, click here
Trusted
Disclaimer
In line with the Trust Project guidelines, this price analysis article is for informational purposes only and should not be considered financial or investment advice. BeInCrypto is committed to accurate, unbiased reporting, but market conditions are subject to change without notice. Always conduct your own research and consult with a professional before making any financial decisions. Please note that our Terms and Conditions, Privacy Policy, and Disclaimers have been updated.
