
Bitcoin (BTC) is showing several bullish signs in the daily time frame but has yet to break out from a short-term corrective pattern.
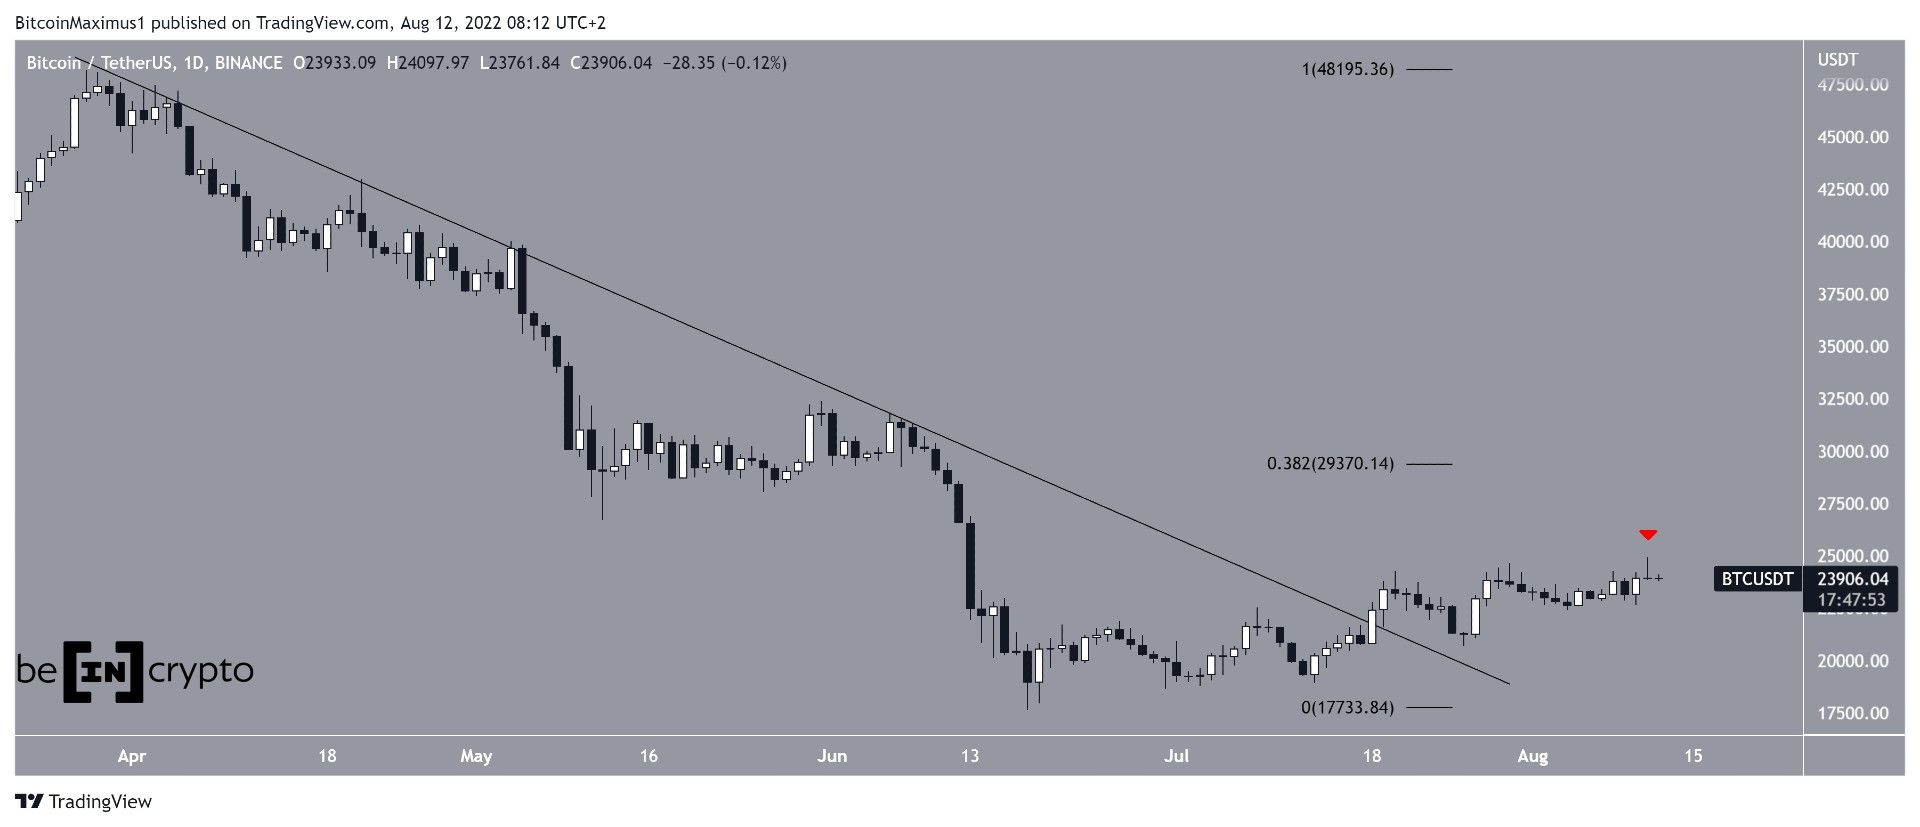
Bitcoin has been moving upwards since reaching a long-term low of $17,622 on June 18. On July 19, it broke out from a long-term descending resistance line, which had been in place since the end of March.
On Aug. 11, BTC reached a local high of $24,918, which was the highest since June 12. However, it failed to sustain this increase and created a long upper wick in its daily candlestick (red icon).
If the upward movement continues, the closest resistance area would be found at $29,370. This target is the 0.382 Fib retracement resistance level.
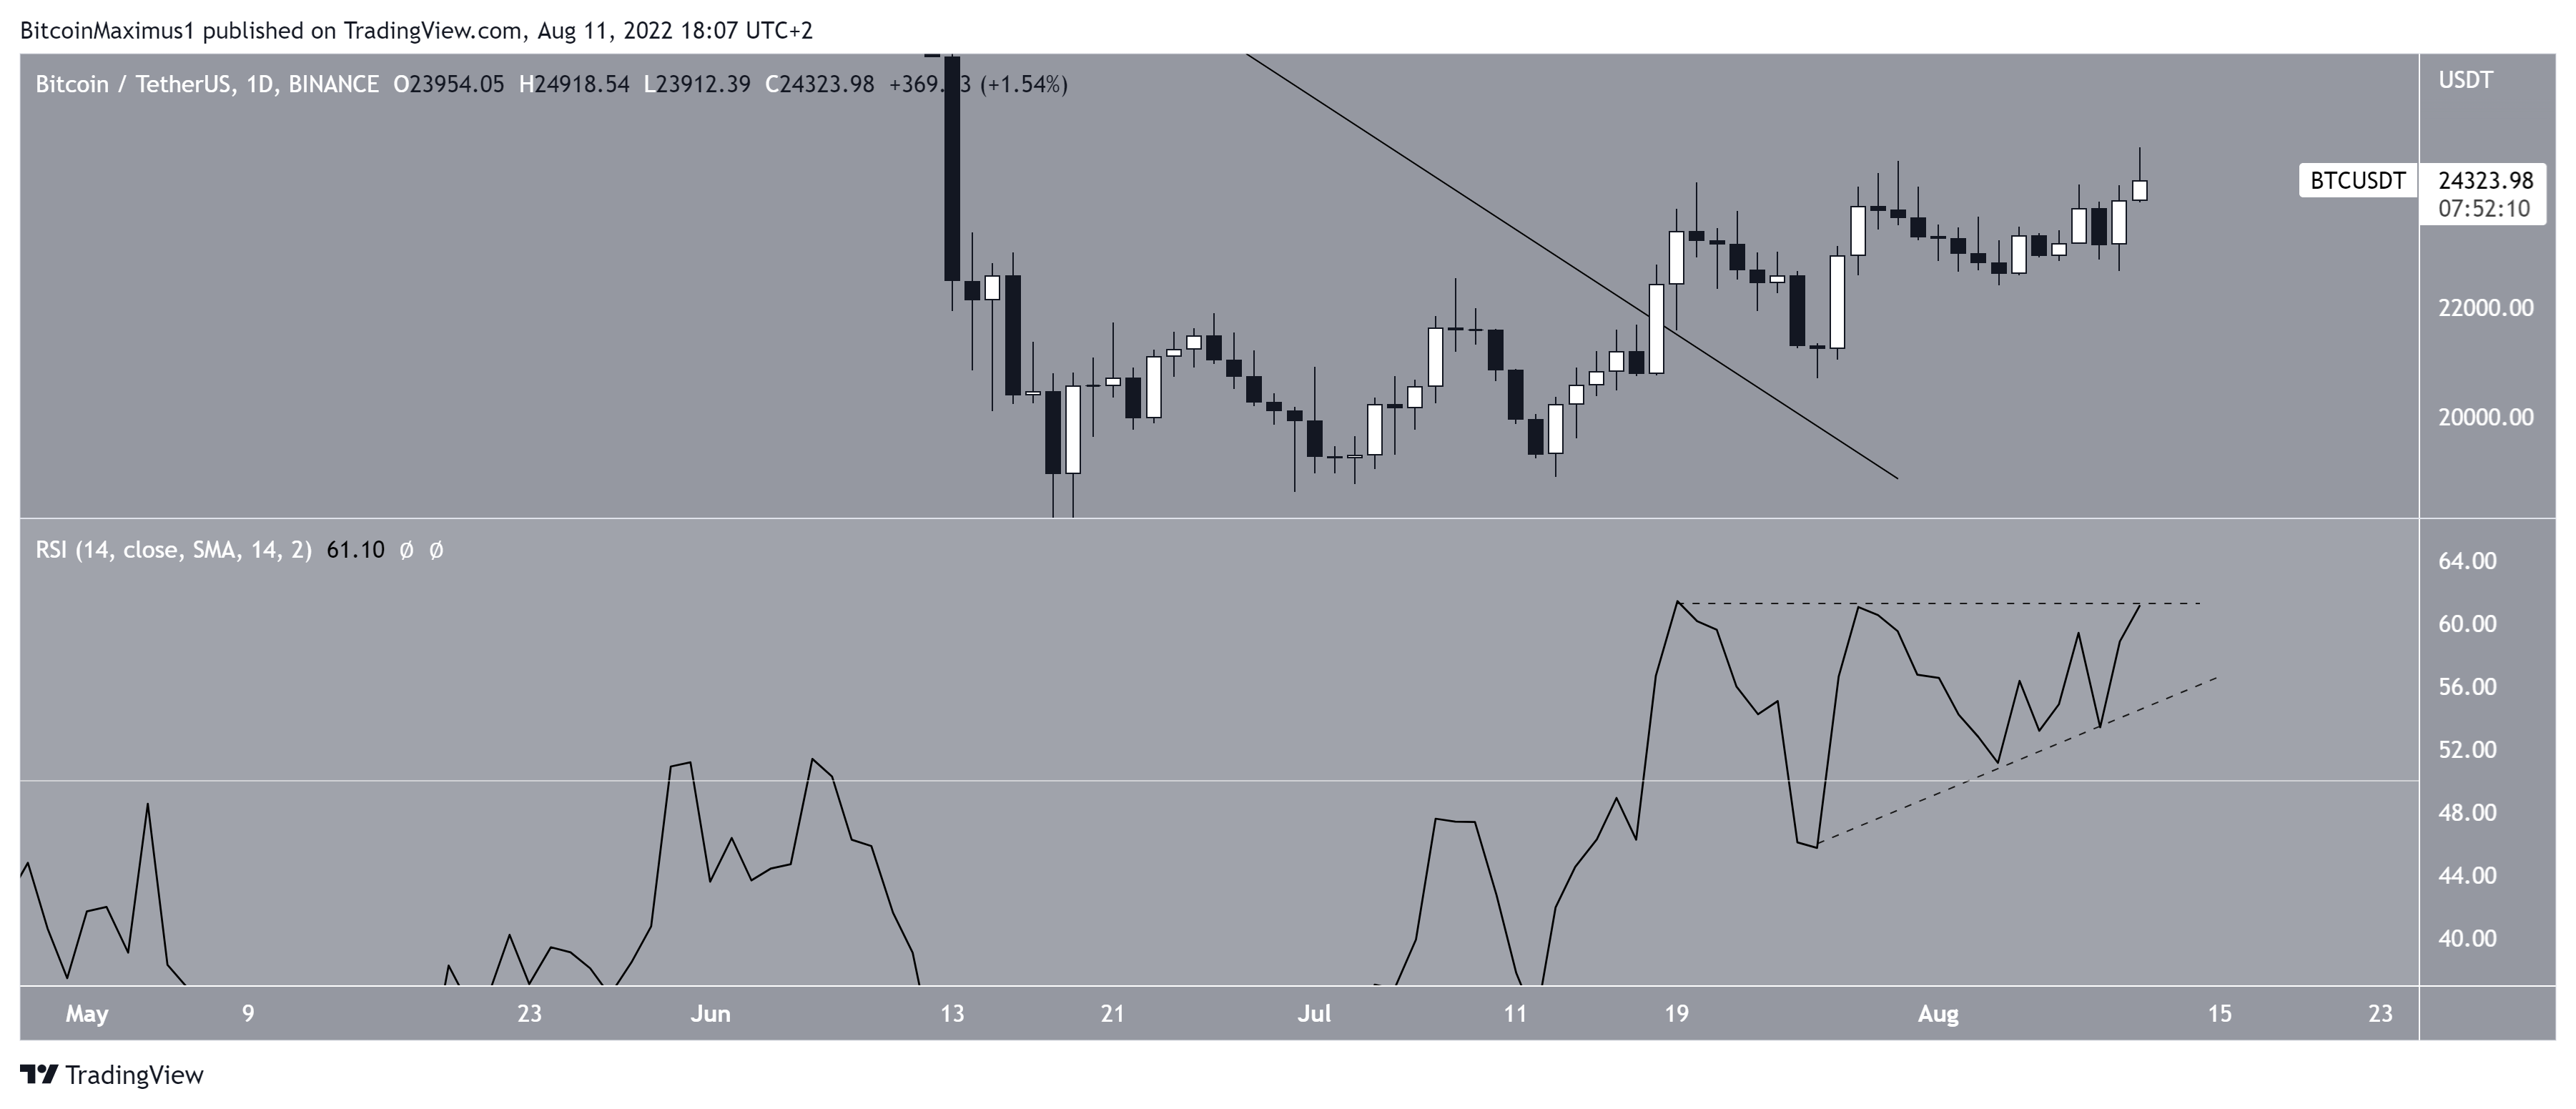
An interesting reading comes from the daily RSI, which moved above 50 at the same time which the price broke out from the descending resistance line.
Since then, the RSI has created an ascending triangle (dashed), which is often considered a bullish pattern. The indicator is currently at 61, right at the resistance line of this pattern.
Therefore, a breakout above it would likely also cause the price to accelerate upwards.
Short-term BTC pattern
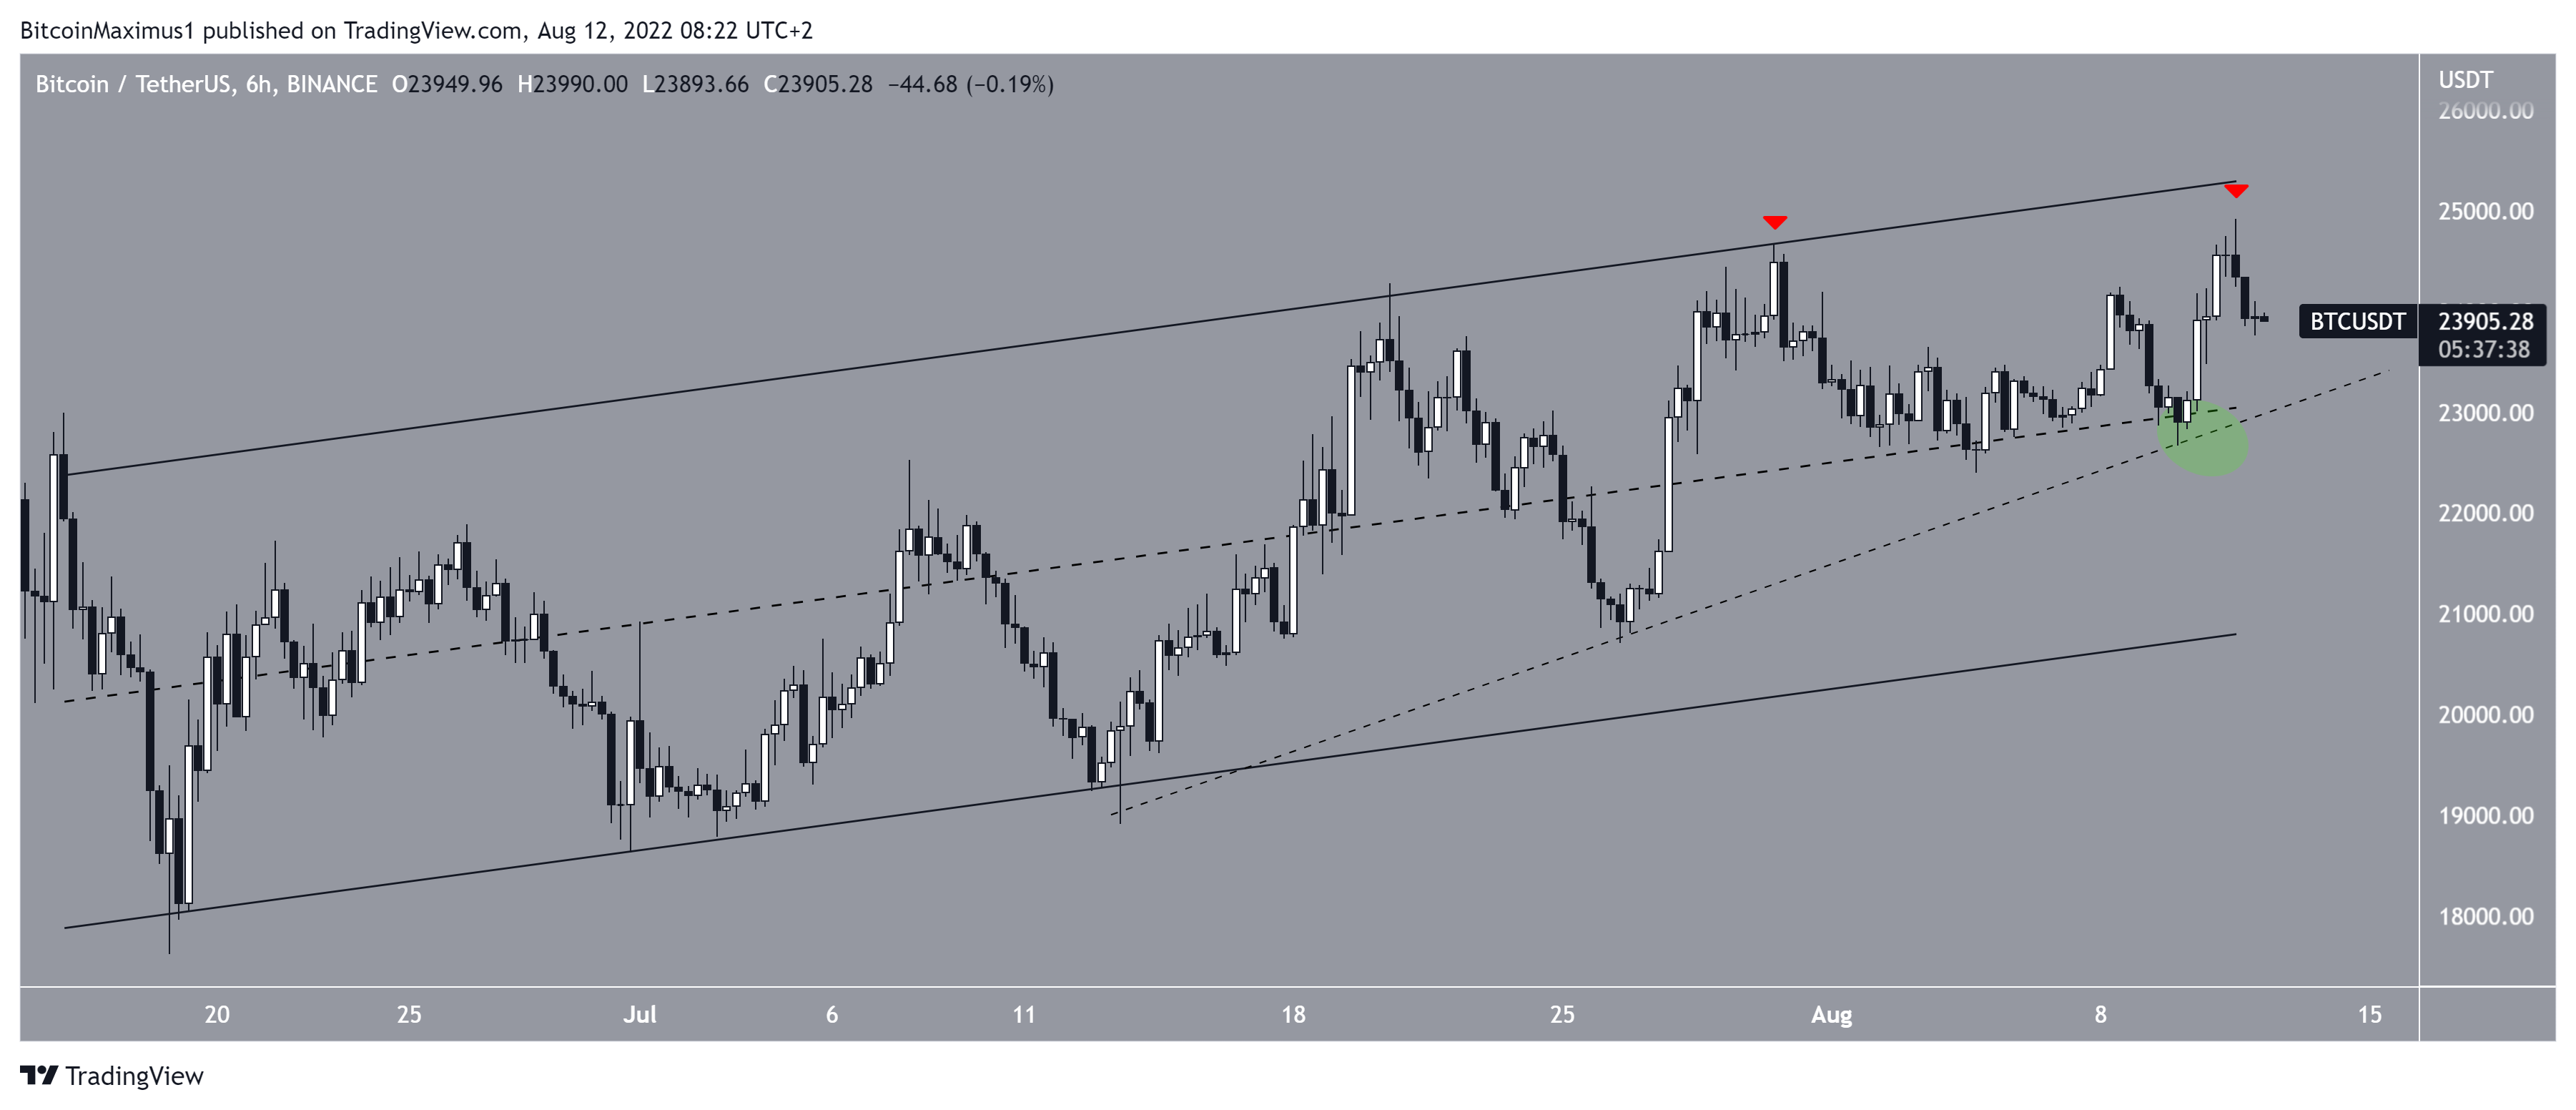
Despite the relative bullishness from the daily time frame, the six-hour chart shows that BTC has been trading inside an ascending parallel channel since the June 18 bottom. Such channels usually contain corrective patterns, meaning that an eventual breakdown from it would be expected.
Moreover, the price has created what resembles an even shorter-term double top (red icons), which is considered a bearish pattern made at the resistance line of the channel.
On Aug. 9 (green circle), the price rebounded from the midline of this channel and at a short-term ascending support line.
So, whether BTC breaks out from the channel or breaks down from the support line will likely determine the direction of the future trend.
Wave count analysis
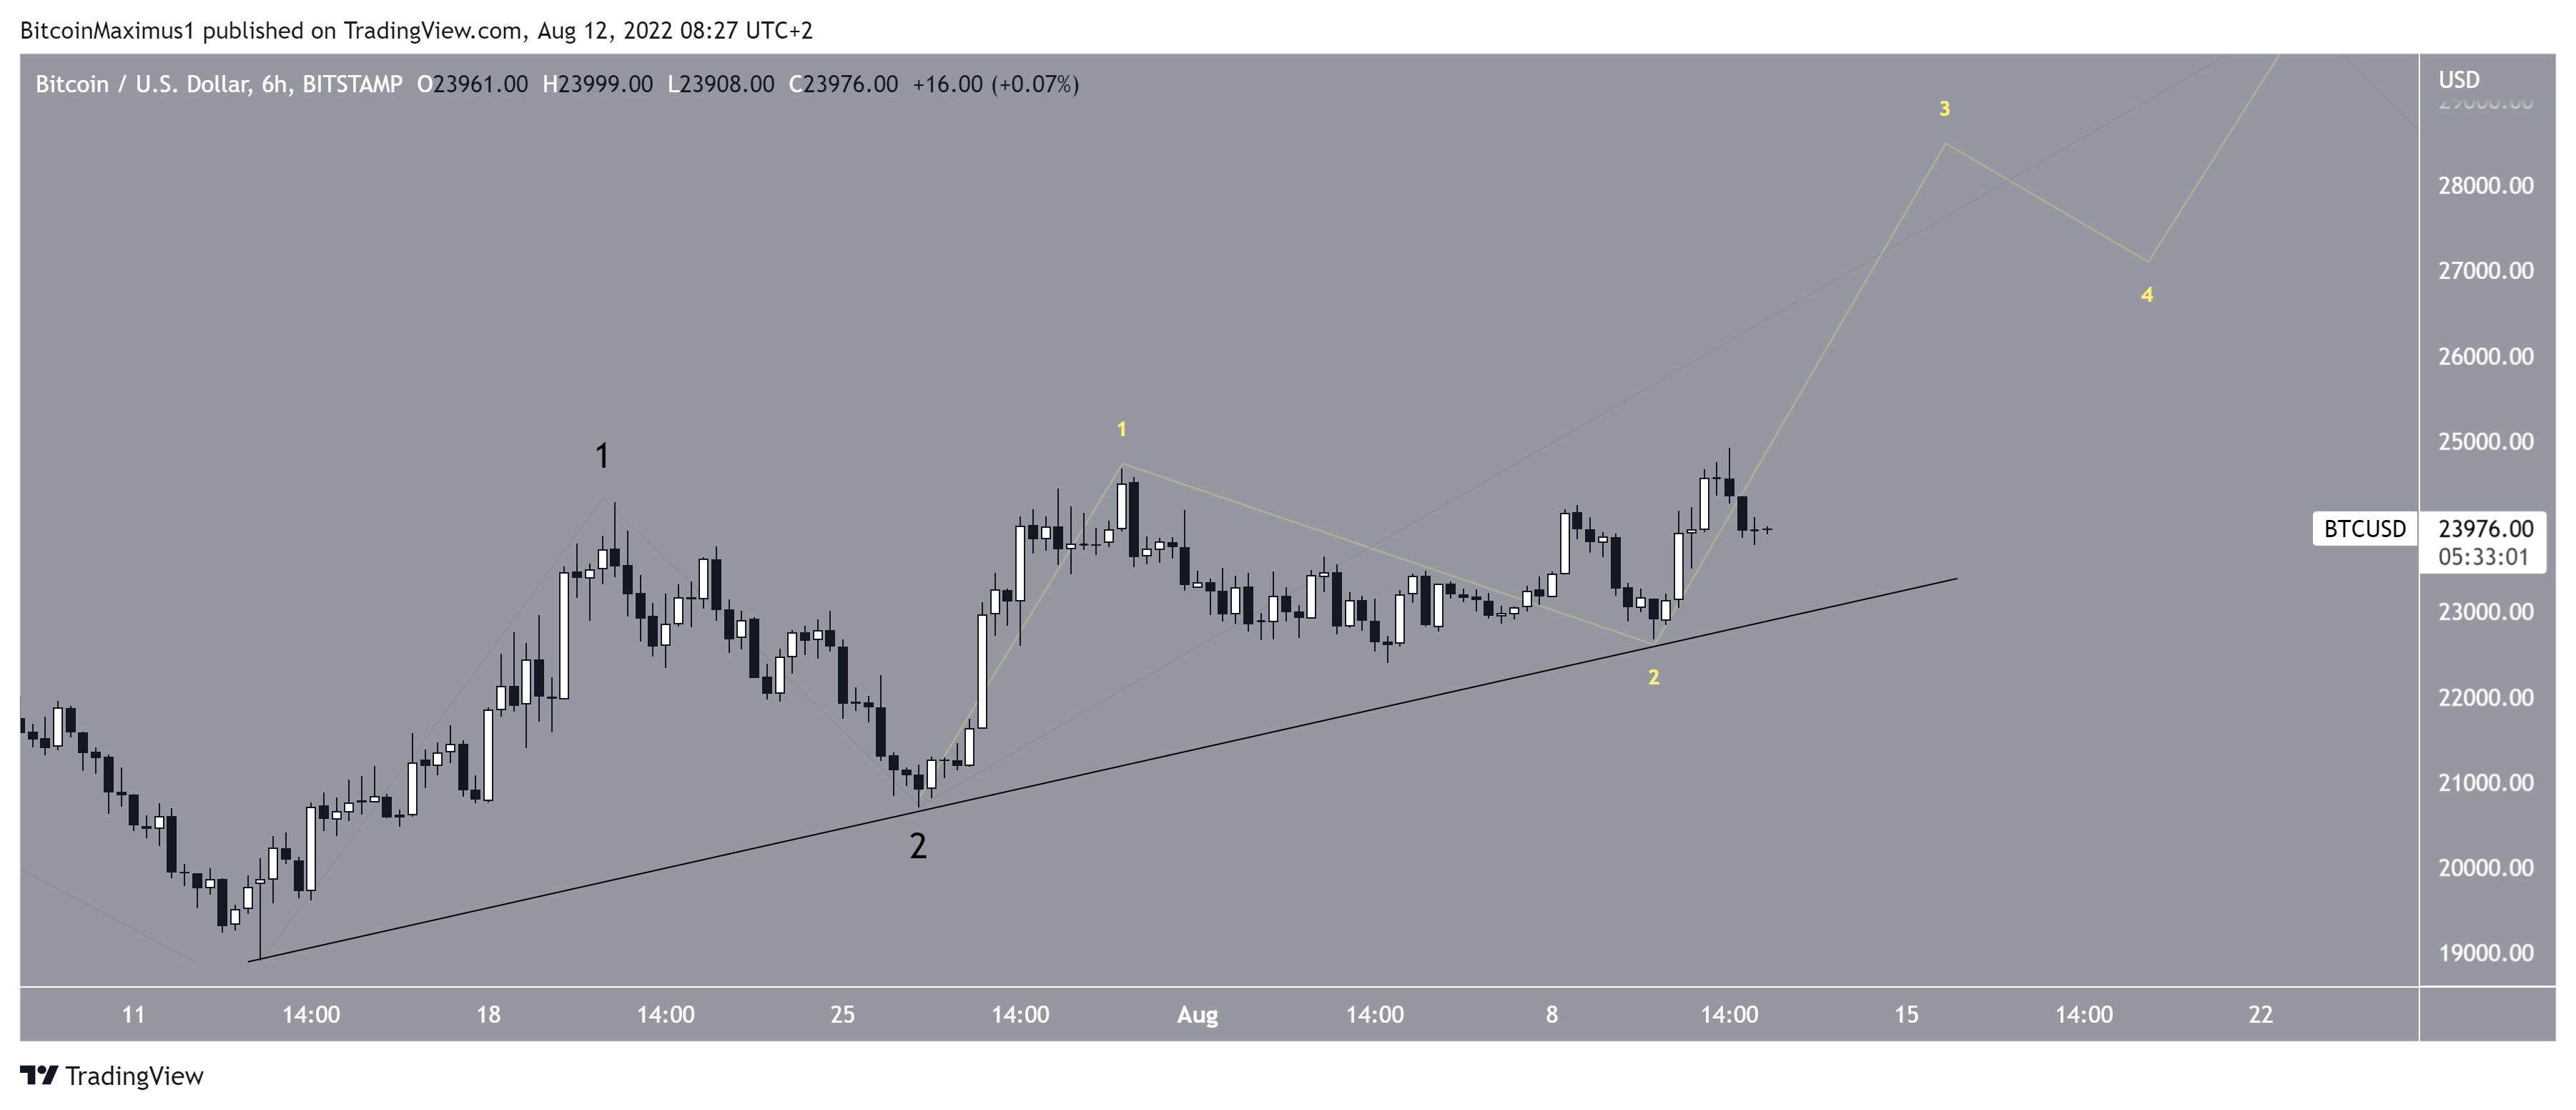
The main wave count indicates that BTC is likely in wave three of a five-wave upward move (black). The sub-wave count is shown in yellow, and also suggests that the price is in wave three. So, this seems to be a 1-2/1-2 wave formation. If correct, it would mean that the upward move will accelerate in the near future.
In order for the count to remain correct, Bitcoin has to hold on above the slope of the original 1-2 (black).
The most likely long-term wave count is also bullish, aligning with the proposed short-term count.
For Be[in]Crypto’s previous Bitcoin (BTC) analysis, click here
