


Technical analysts of the cryptocurrency market have recently provided new insights into the traditional concept of Bitcoin cycles. According to the circular analysis, the largest cryptocurrency is close to reaching a bottom and starting a new bull cycle.
On this occasion, Be[In]Crypto looks at two other concepts according to which the cryptocurrency market is governed by Bitcoin cycles: the classical one and the hypothesis of lengthening cycles.
Against these, the circular concept of BTC cyclicity looks interesting, although it is still in the early stages of its development.
Classic BTC cycles
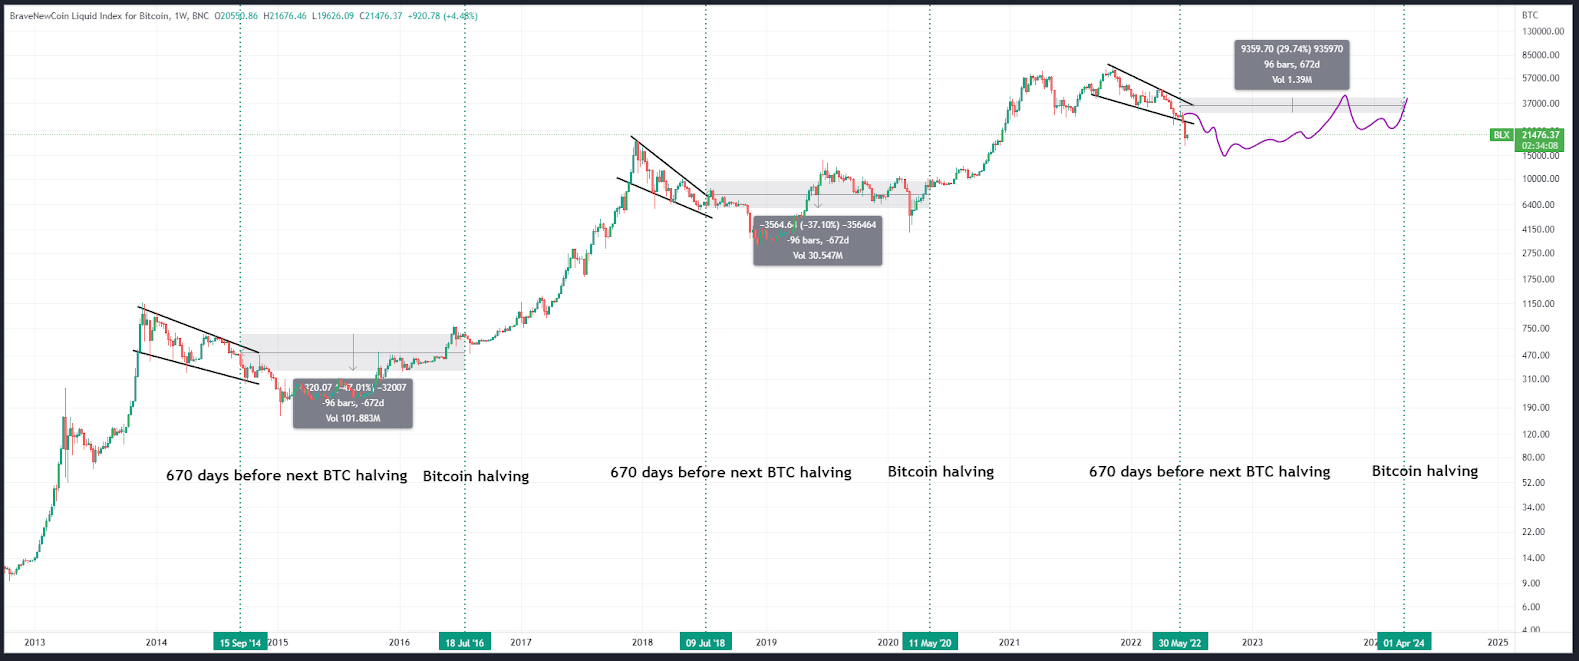
The classic concept of Bitcoin cycles is based on the juxtaposition of historical price action with halving that takes place once every four years. This event involves a halving of the BTC miner’s reward. It currently stands at 6.25 BTC per block, while in 2024 it will drop to 3.125 BTC.
In the broadest terms, the following pattern of a single Bitcoin cycle is assumed, which begins shortly after the halving:
- Bull market: a parabolic rise that lasts about one year and is ended with a blow-off top;
- Bear market: a sharp decline that lasts about one year and is completed with a macro bottom;
- Consolidation: after reaching the bottom, Bitcoin goes through a two-year sideways trend stage, which leads to another halving.
This simple pattern seemed to fit the historical data going back to the early days of BTC trading. However, some argue that the price action of the past two years has invalidated the classic Bitcoin cycles hypothesis.
The main reason is said to be the lower-than-expected all-time high of the major cryptocurrency and the lack of a blow-off top. Most crypto market specialists predicted that in 2021 the BTC price peak would break through $100,000.
However, according to other analysts, Bitcoin’s recent history also confirms that classic cycles still apply. For example, user @venturefounder tweeted an updated version of this hypothesis. According to him, this is “still my most viable forecast for #Bitcoin before next halving.”
He further states: “#BTC will capitulate in the next 6 months & hit cycle bottom (anywhere between $14-21k), then chop around $28-40k in most of 2023 and be at ~$40k again by next halving.”
BTC lengthening cycles
The best-known promoter of the hypothesis that Bitcoin’s successive cycles are lengthening is – or rather was – Benjamin Cowen. Unfortunately, about two months ago, in early May 2022, he admitted that his hypothesis “is dead.” He did so in the face of an elongated bear market, back when Bitcoin was still trading at $35,000.
Bitcoin lengthening cycles assumed that successive cycles in the cryptocurrency market lasted longer, and that they produced diminishing returns measured in return on investment (ROI). By the second half of 2021, it seemed that the current bull market – and by extension the entire cycle – would be longer than previous ones. Also, Cowen assumed a cycle peak in the $100,000-$200,000 range.
However, the sharp decline in the valuation of BTC and other cryptocurrencies that followed Nov 2021 no longer allowed him to defend this hypothesis. Moreover, Bitcoin, for the first time in history, fell below the level of the all-time high (ATH) of the previous cycle – $20,000 in 2017.
This fact has become an additional factor in falsifying the hypothesis of Bitcoin lengthening cycles. Moreover, it is a strong argument for modifying the classical version of this concept.
The collapse of great narratives: stock-to-flow
The world of cryptocurrency trading and investing – like nature – abhors a vacuum. There is a need to rationalize and simplify the complexities of cryptocurrency economics, of which the Bitcoin price chart is a physical manifestation. There is a need for a great narrative of the crypto market.
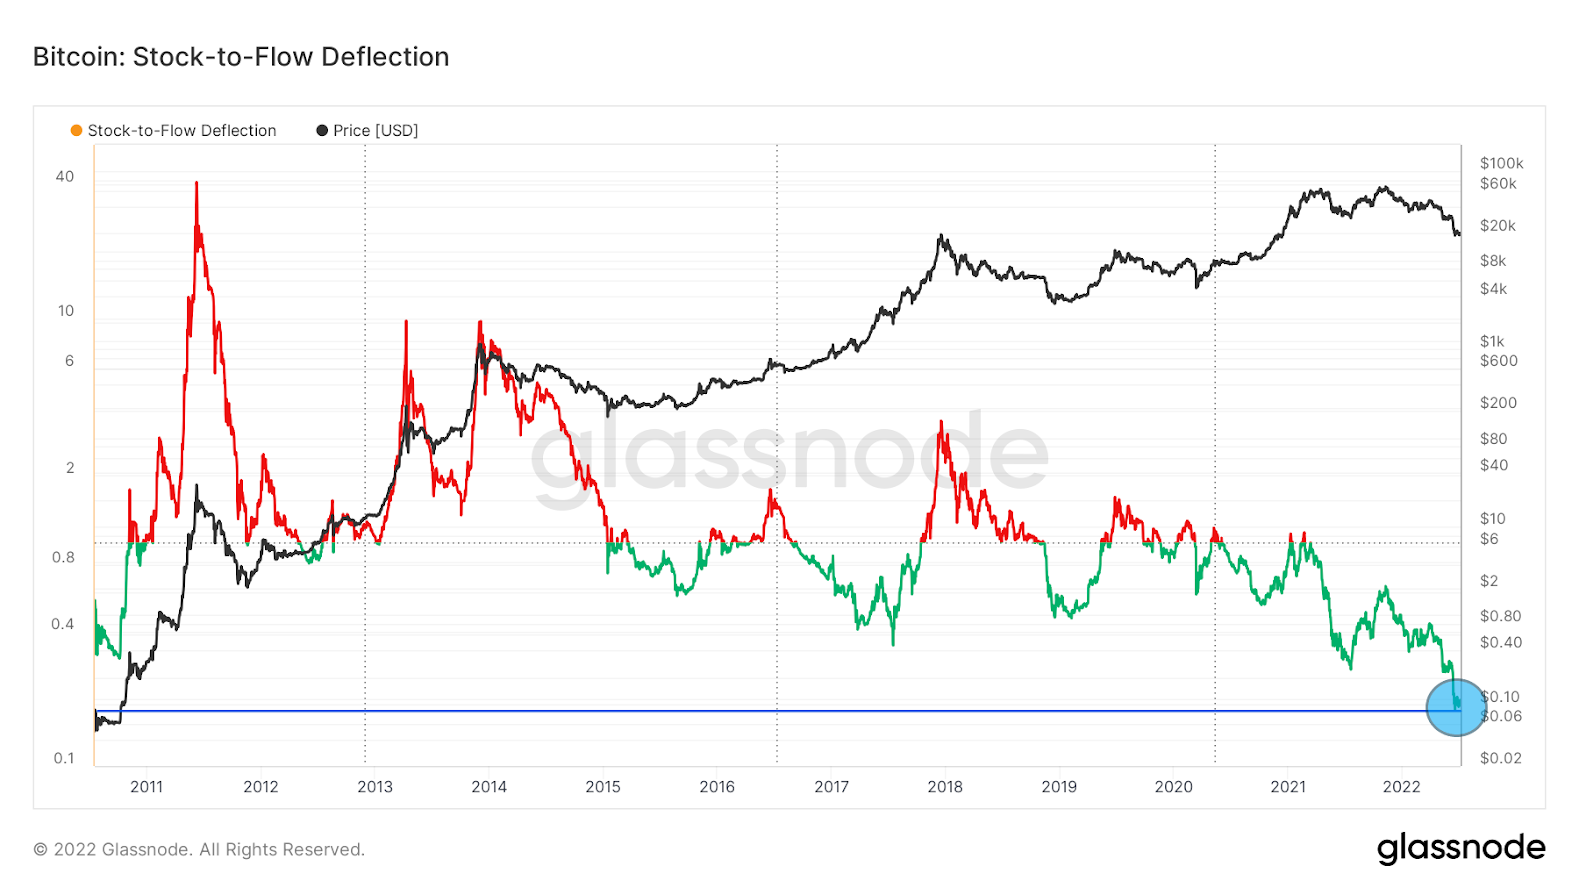
One such narrative, which has been experiencing fundamental problems for many months, is the stock-to-flow model, by the pseudo-anonymous PlanB. However, many believe that this model too has already been falsified. The reason is said to be the largest-ever deviation from the predicted averaged price (blue line).
New hypothesis: Bitcoin circular cycles
Faced with the collapse, or doubts, toward previous hypotheses of Bitcoin cycles and the stock-to-flow model, analysts are building new constructs. The latest attempt is the hypothesis that Bitcoin cycles fit into circular, self-similar patterns.
It should be noted right away that no single, widely accepted concept has yet been developed. For now, we are witnessing the first attempts to fit Bitcoin’s historical price action into the circuits of decreasing circular patterns.
These are decreasing over time, but they do so on a logarithmic chart. Therefore, although successive circles visually appear smaller, their perimeters over time cover an absolutely larger range of prices on the Y axis.
However, the X axis, which reflects time, remains on a normal scale. This means that cycles would shorten, and successive peaks would be reached faster. Exactly the opposite of the version of lengthening cycles.
Two models proposed
Two analysts have recently presented their attempts to build a circular hypothesis of Bitcoin cycles. The first of them, @StockmoneyL tweeted two versions of his model. In the first, we see that successive circles of bull and bear markets are separated by a period of 439-day consolidation between cycles.
In addition, according to the author, there is a dashed line of “grand support.” The declines of successive Bitcoin cycles since the so-called “Innovators” era of 2011 to 2013 end on it.
According to this interpretation, the current BTC price is exactly on the support line and could be a signal for a macro bottom in the BTC price.
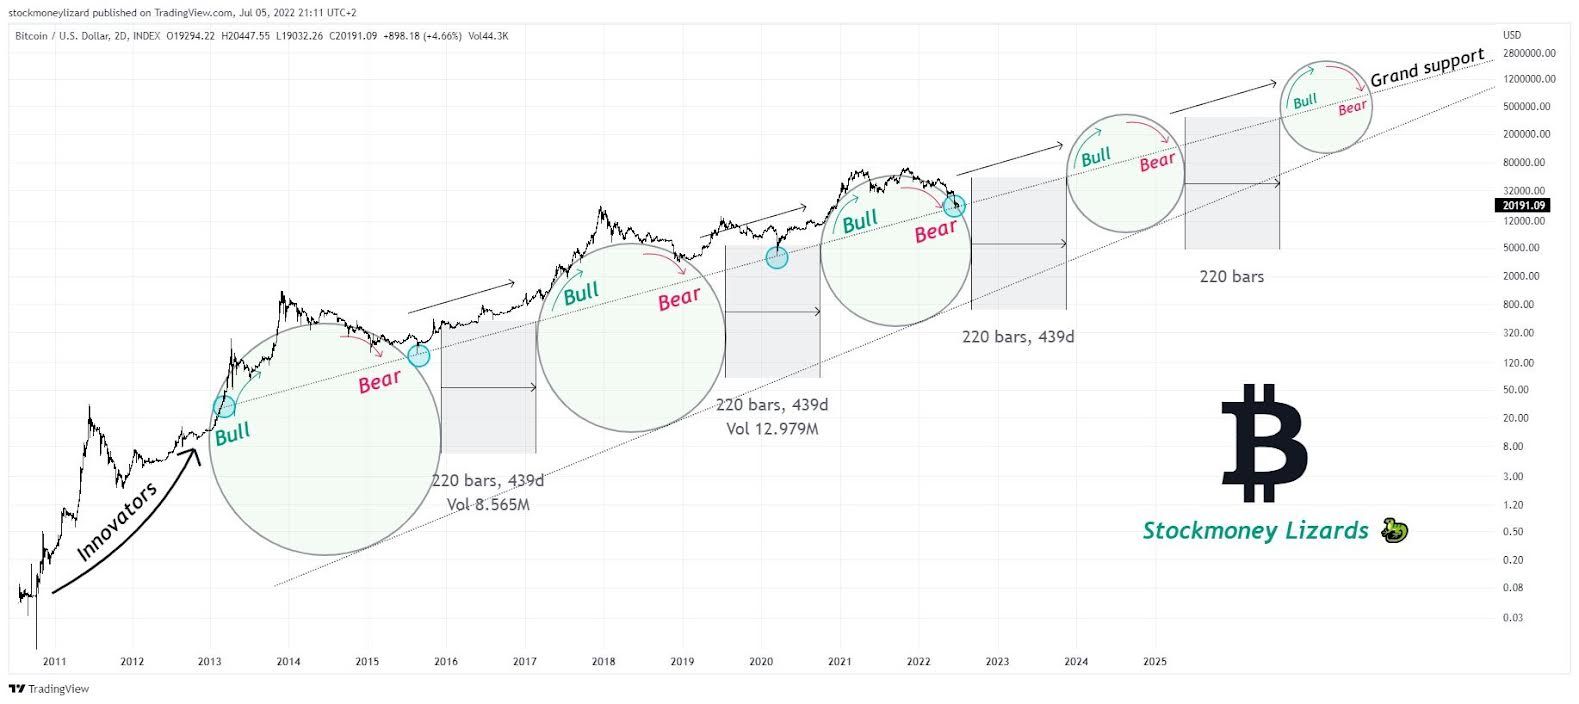
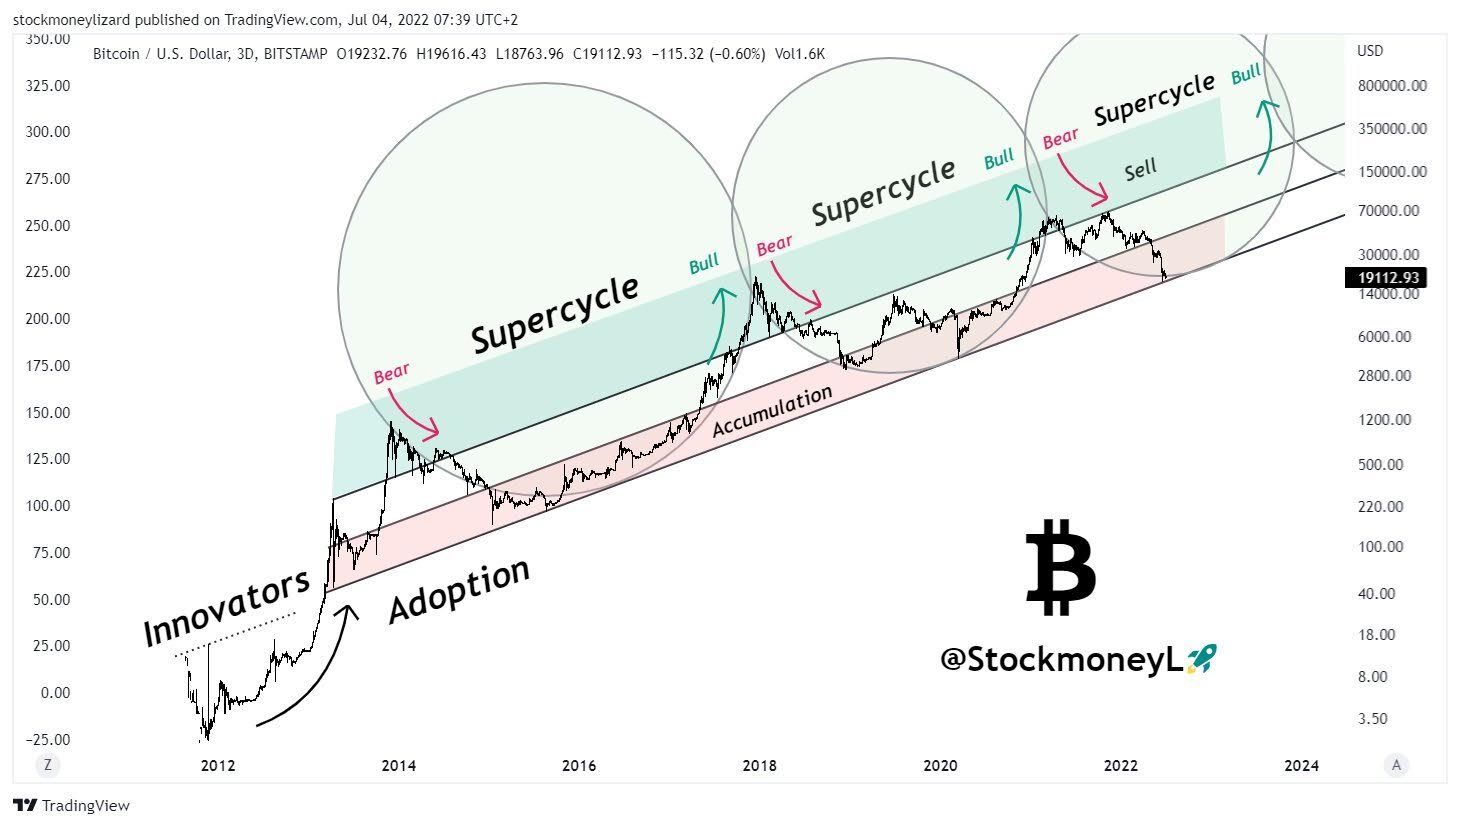
In the second version of his circular hypothesis, the analyst uses larger, slightly intersecting circles to inscribe a chart of BTC from the 2014 bear market.
This version includes an additional three straights that divide Bitcoin’s price ranges into three areas: red/accumulation, white/neutral and green/sell. Here, too, Bitcoin cycles reach macro lows near the contact of the circles with the lower accumulation line.
Bitcoin circular cycles: an alternative version
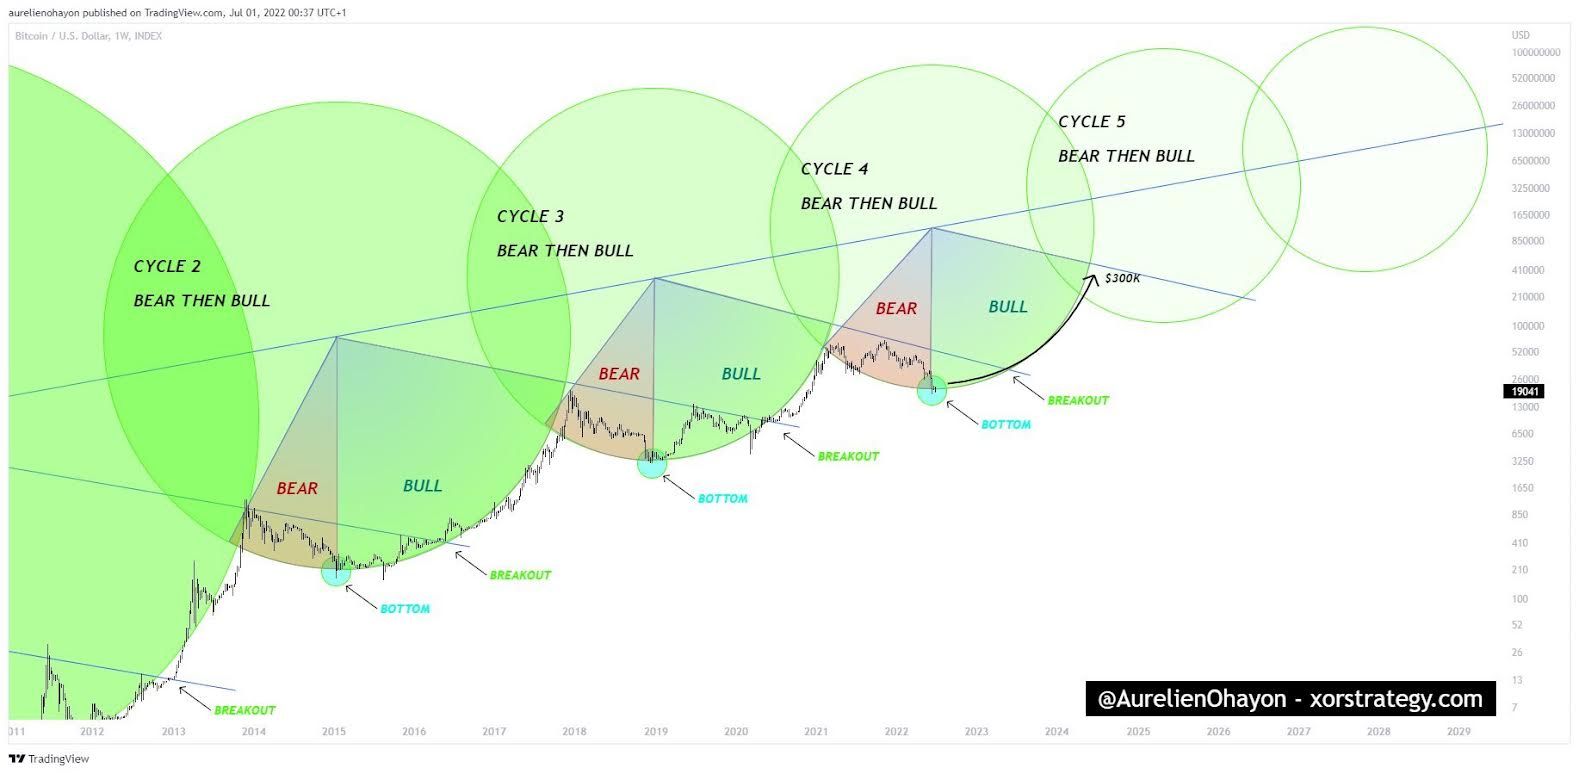
An alternative version of the hypothesis that Bitcoin cycles fit into circular patterns was presented by analyst @AurelienOhayon. His take is similar to the previous author’s second version. Here, too, the circles intersect – even more strongly than in the chart above.
Similarly, Bitcoin’s price is currently at the lower edge of the circle’s circumference, suggesting a macro bottom.
An innovation over the previous suggestion is the radial measure of each circle, which is supposed to delineate the bearish and bullish periods of the cycle. The former (red) are shorter than the latter (green).
Moreover, the angular prediction of the peak of the next bull market places the long-term target at $300,000. It is expected to be reached around the turn of 2024-25.
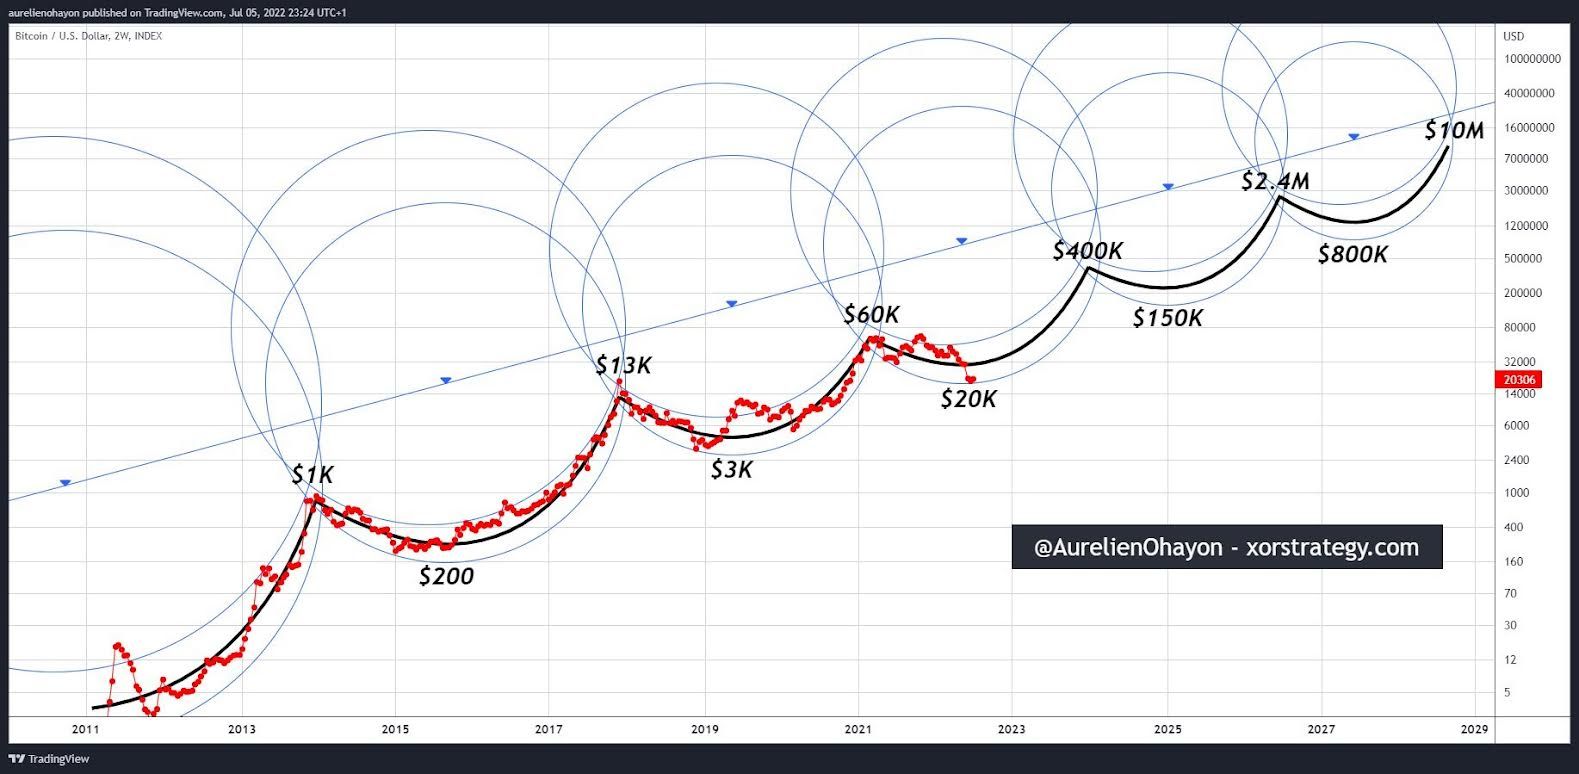
Finally, it is still worth looking at the second version of this author’s model, in which the wheel of each cycle appears in two versions. Thanks to this modification, the Bitcoin price in each cycle is contained in a channel between the lower parts of the two circles. This allows a greater tolerance for deviations and is helpful in determining potential peaks and bottoms.
Also in this version, the current BTC price oscillating around $20,000 is interpreted as the macro bottom area for the current cycle. Moreover, the model includes forecasts for the next three cycles. At the end of 2024, Bitcoin is expected to reach $400,000.
Then as high as $2.4 million in mid-2026 to reach $10 million in 2028. If this were to happen, Bitcoin’s cycles would certainly shorten.
For Be[in]Crypto’s latest Bitcoin (BTC) analysis, click here.


