


Bitcoin (BTC) did not move substantially in either direction last week, failing to assert the direction of the trend.
Its failure to break down in the short-term and subsequent bounce could mean that the current movement is not corrective, thus indicating that the low is in. The movement in the next few days will be crucial in determining the future trend.
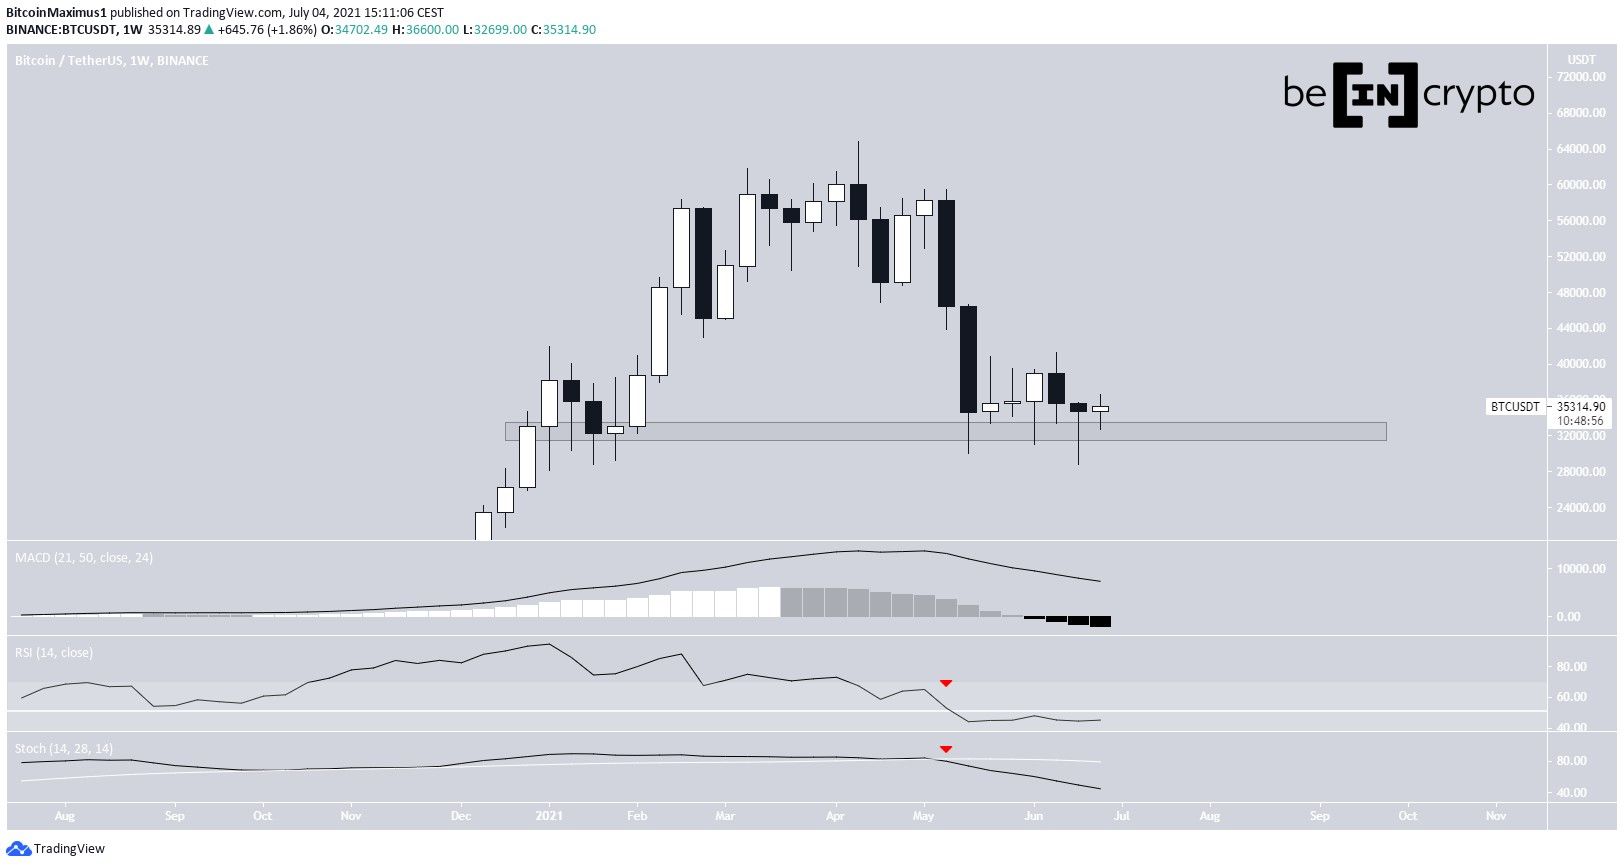
Weekly consolidation
During the week of June 28-July 5, BTC did not move significantly in either direction. On the contrary, it ranged between $32,699 and $36,660. It’s still trading above the long-term horizontal support level of $32,600, and has created several long lower wicks below it.
However, technical indicators in the weekly time frame are still bearish. The MACD is negative, the RSI has crossed below 50, and the Stochastic oscillator has made a bearish cross.
BTC trading range
The daily chart shows that BTC has been trading inside a range between $31,400 and $40,550 since May 19. The latter is also the 0.382 Fib retracement resistance level and could coincide with a descending resistance line, depending on when it’s reached.
BTC bounced at the support area on June 22, created a higher low on June 26, and has been moving upwards since.
However, technical indicators are not bullish yet. The MACD signal line is negative and the RSI is below 50. However, both are increasing.
In addition to this, the Stochastic oscillator is very close to making a bullish cross (green circle).

Wave count
There are two potential wave counts in play.
The bearish count suggests that BTC is still in a bearish impulse, one that has been ongoing since the all-time high of $64,895 from April 14.
If the count is correct, BTC would currently be in sub-wave two (black) of wave five (orange).
A potential target for the bottom of the move is found near $19,800.

BTC completed sub-wave two (red) yesterday near the 0.786 Fib retracement resistance level of $33,800. It failed to reach the middle of the channel and broke down instead.
Therefore, for the count to remain valid, BTC would have to break down from the channel soon with a sharp downward movement.

The bullish count indicates that the upward movement is a leading diagonal instead. In this case, BTC would reach a high near $37,500, before breaking down.
Nevertheless, the increase would be a part of wave A (orange) of an A-B-C corrective structure, indicating that the local low is already in.
Whether BTC breaks down from the current support or bounces will likely determine the future trend.

For BeInCrypto’s previous bitcoin (BTC) analysis, click here.


